. 2020 May 28;147(10):dev186650.
doi: 10.1242/dev.186650.

A collection of genetic mouse lines and related tools for inducible and reversible intersectional mis-expression

Affiliations

A collection of genetic mouse lines and related tools for inducible and reversible intersectional mis-expression

Elham Ahmadzadeh et al. Development. .

Abstract

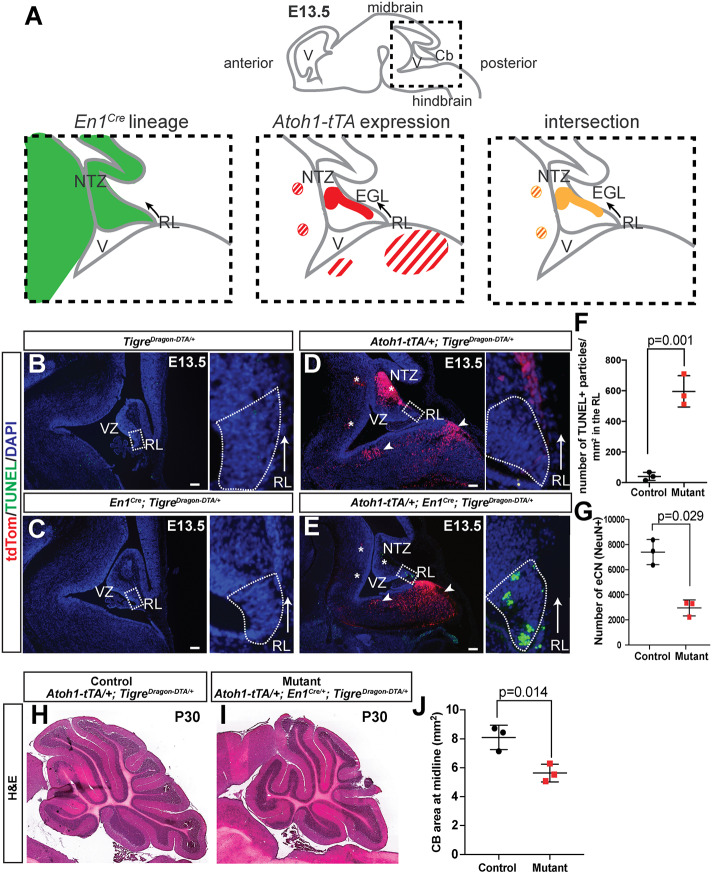
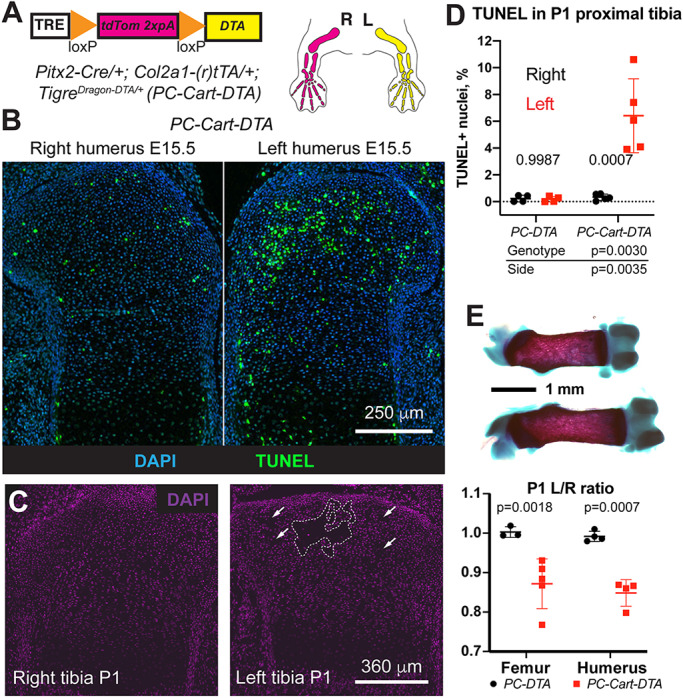
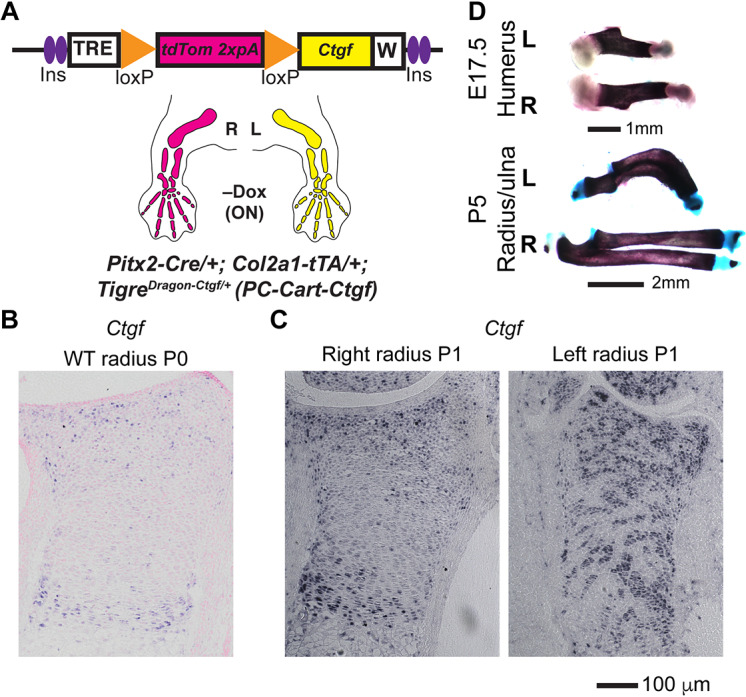
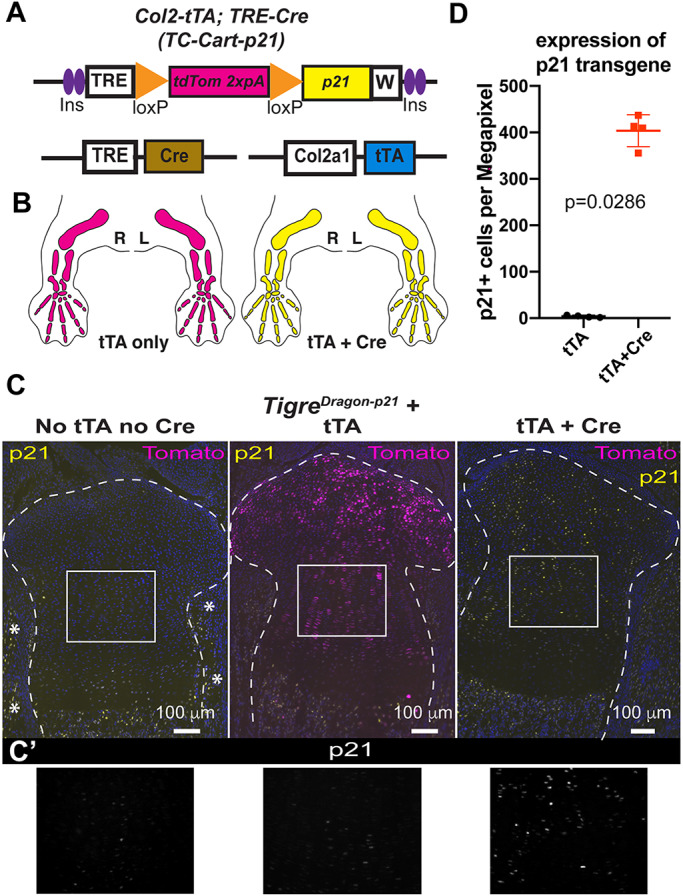
Thanks to many advances in genetic manipulation, mouse models have become very powerful in their ability to interrogate biological processes. In order to precisely target expression of a gene of interest to particular cell types, intersectional genetic approaches using two promoter/enhancers unique to a cell type are ideal. Within these methodologies, variants that add temporal control of gene expression are the most powerful. We describe the development, validation and application of an intersectional approach that involves three transgenes, requiring the intersection of two promoter/enhancers to target gene expression to precise cell types. Furthermore, the approach uses available lines expressing tTA/rTA to control the timing of gene expression based on whether doxycycline is absent or present, respectively. We also show that the approach can be extended to other animal models, using chicken embryos. We generated three mouse lines targeted at the Tigre (Igs7) locus with TRE-loxP-tdTomato-loxP upstream of three genes (p21, DTA and Ctgf), and combined them with Cre and tTA/rtTA lines that target expression to the cerebellum and limbs. Our tools will facilitate unraveling biological questions in multiple fields and organisms.

Keywords: Ccn2/Ctgf; Cre; DRAGON; DTA; Diphtheria toxin; Inducible and reversible gene mis-expression; Intersectional genetics; Tigre locus; Tissue-specific; p21; rtTA; tTA; tox176.


Conflict of interest statement

Competing interestsThe authors declare no competing or financial interests.

Figures

Fig. 1.
Fig. 1.
An intersectional genetic system for inducible and reversible gene mis-expression. (A) Basic components of the TigreDragon alleles. Ins: insulators; W: Woodchuck virus RNA stabilizing sequence (WPRE). Expression of the GOI depends on both Cre and (r)tTA. (B-D) In the presence of just (r)tTA (blue in C and D), only the tdTomato (tdT) embedded in the intact floxed cassette is expressed (top row in B, magenta in C and D). In the presence of just Cre (green in C and D), the floxed tdTomato-STOP cassette is eliminated, priming the system and deleting tdT, but the GOI is not expressed (middle row in B). It is only in the presence of both Cre and (r)tTA (hatched blue and green in C and D) that the GOI is expressed (bottom row in B, yellow in C and D). As the expression of both tdT and the GOI depends on (r)tTA activity, their expression is inducible and reversible, as it requires the presence of doxycycline (Dox) for rtTA to be active (C), or its absence in the case of tTA (D). (E) Table summarizing the available Dragon lines and their potential uses.
Fig. 2.
Fig. 2.
A TigreDragon-DTA model to generate acute cell/tissue-specific cell ablation. (A,B) Schematic showing TigreDragon-DTA allele (A) and the experimental plan (B). (C-F) Sagittal sections through the cerebellum of three types of E13.5 control embryos (TigreDragon-DTA/+, Atoh1-Cre/+; TigreDragon-DTA/+ and Atoh1-tTA/+; TigreDragon-DTA/+) and an AC-eCN-DTA embryo in the absence of Dox. The boxed areas are shown magnified in the lower panels. Long arrows in the top panels show the direction of the tangential migration as the cells exit the RL. Arrowheads in the bottom panels point to apoptotic cells (TUNEL+). (G) Quantification of cell death in the NTZ identified by MEIS2 staining on adjacent sections (not shown) of E13.5 embryos as measured by the number of TUNEL+ particles. TigreDragon-DTA/+ animals were used as controls (n=3/genotype, P=0.016, Mann–Whitney unpaired test). (H,I) Sagittal sections through the cerebellum at P1, showing reduced numbers of MEIS2+ eCN in AC-eCN-DTA mutants compared with a TigreDragon-DTA/+ control. Right panels show magnification of the boxed areas in the left panels. (J) Quantification of MEIS2+ eCN number per half P1 cerebellum (every other section). TigreDragon-DTA/+ animals were used as controls (n=4/genotype, P=0.029, Mann–Whitney unpaired test). Data are mean± s.d. EGL, external granule layer; NTZ, nuclear transitory zone; RL, rhombic lip; VZ, ventricular zone. Scale bars: 100 μm.
Fig. 3.
Fig. 3.
Intersectional capabilities of the TigreDragon-DTA model. (A) Schematic of En1-lineage (based on Sgaier et al., 2007) and Atoh1 expression (based on Machold and Fishell, 2005). Striped regions represent hindbrain nuclei that are outside of the cerebellum. (B-E) Representative sagittal sections showing the cerebellar anlagen at E13.5 in control embryos (either TigreDragon-DTA/+, En1Cre/+; TigreDragon-DTA/+ or Atoh1-tTA/+; TigreDragon-DTA/+) and EC-eCN-DTA embryos, in the absence of Dox. Asterisks indicate the loss of tdTom+ cells in the NTZ and the two hindbrain nuclei targeted by the intersectional approach; arrowheads point to the hindbrain nuclei that are not affected. The boxed areas are shown magnified in the right panels, rotated counterclockwise. These insets show cell death (TUNEL+) in the rhombic lip region (RL). Arrows show the direction of the tangential migration as the cells exit the RL. Dotted lines indicate the RL region. (F) Quantification of cell death in the RL of E13.5 embryos detected by TUNEL (n=3/genotype, P=0.001, Mann–Whitney unpaired test). (G) Quantification of large NeuN+ cells from every other sagittal section from half P30 cerebella shows the number of excitatory cerebellar nuclei in EC-eCN-DTA animals compared with controls (n=3 for both genotypes, P=0.029, Mann–Whitney unpaired test). (H,I) Representative images of the P30 cerebella of EC-eCN-DTA (I) and littermate control (H). (J) Quantification of cerebellar area of midline sections shows reduction in cerebellar area after eCN ablation. TigreDragon-DTA/+ or Atoh1-tTA/+; TigreDragon-DTA/+ animals were used as controls for the quantifications shown in F,G and J. Data are mean±s.d. EGL, external granule layer; NTZ, nuclear transitory zone; RL, rhombic lip; V, ventricle; VZ, ventricular zone. Scale bars: 100 μm.
Fig. 4.
Fig. 4.
TigreDragon-DTA allows generation of structural damage and reduced local cell density due to cell death in tissues with low cell motility such as cartilage. (A) Schematic of the unilateral cartilage-specific cell ablation model. Col2a1-tTA (Tet-Off) starts to be expressed in the limbs at ∼E12.5, the same stage at which Dox was provided in the Tet-On model to activate Col2a1-driven rtTA (and maintained until collection). (B) TUNEL staining on E15.5 proximal humerus sections shows increased apoptosis in the left cartilage compared with the right. (C) One week of continuous DTA expression leads to the generation of acellular gaps in the left cartilage (dashed lines and arrows). (D) Quantification of TUNEL+ cells in cartilage at P1 (n=4 PC-DTA and 5 PC-Cart-DTA). Two-way ANOVA results are shown. The bottom table shows the P-values for the different variables. P-values within the graph are for Sidak's multiple comparisons test. (E) Cell death in the cartilage leads to impaired left-bone growth compared with the contralateral one at P1 (representative femora shown in top panel). Bone length ratios were analyzed by a mixed effects model (pGenotype <0.0001), as some samples lacked matching femur-humerus measurements. P-values for Sidak's multiple comparisons post-hoc test are shown in the chart. Data are mean±s.d.
Fig. 5.
Fig. 5.
Unilateral overexpression of CTGF leads to bone asymmetry. (A) Schematic of the PC-Cart-Ctgf model to achieve mis-expression of Ctgf in the cartilage of the left limb. Note that Col2a1-tTA (Tet-Off system) is used in this model, such that tTA is active without Dox (starting at ∼E12.5). (B,C) In situ hybridization for Ctgf mRNA in the distal radius cartilage from wild-type (WT) (B) and PC-Cart-Ctgf mice (C) at P0-P1 (n=3). (D) Representative examples of skeletal preparations of left (L) and right (R) PC-Cart-Ctgf bones at the indicated stages (n=7 at E15.5, 6 at E17.5, 4 at P1, 5 at P5-P7).
Fig. 6.
Fig. 6.
Different outcomes of transient versus continuous expression of Ctgf in the cartilage of the growing bones. (A) Schematics of the transient injury experiment. (B) RNA in situ analysis of expression of Ctgf in the proximal cartilage of left and right tibia of PC-Cart-Ctgf P0 pups, 2 days after Dox administration at E17.5 (n=3). (C) When transgenic Ctgf expression was shut down by Dox treatment in the PC-Cart-Ctgf model (Dox at E17.5, analysis at P0-P1), the asymmetry was not as extreme as in the case of continuous Ctgf mis-expression (no-Dox condition). In the graphs, quantification of left/right ratio of bone length is shown for control (tTA) and experimental animals (Exp; tTA+), treated or not with Dox. Analysis by two-way ANOVA for Genotype and Treatment. P-values for Sidak's multiple comparisons post-hoc test are shown. As we used an internal ratio (left/right length), data from femora and humeri were pooled together. They were treated as independent samples because Pitx2-Cre has been shown to recombine with different efficiencies in forelimb and hindlimb (Rosello-Diez et al., 2018). Data are mean±s.d.
Fig. 7.
Fig. 7.
The Dragon lines are effectively activated by tTA and Cre, and not leaky. (A) Depiction of the alleles that a TC-Cart-p21 model is composed of (see text for details). (B) Prediction of expression domains (color code as in A) in the presence of Col2a1-tTA but absence of the Cre allele (left), and when both Cre and tTA alleles are present along with Dragon-p21 (right). Right (R) and left (L) limbs are shown. (C) Representative micrographs of immunohistochemistry for the indicated proteins on proximal tibia sections from newborn littermates of the indicated genotypes (TigreDragon-p21 is common to all three). Dashed lines delimit the cartilage. Asterisks indicate endogenous expression of p21 in muscle and perichondrium. No Dox was provided for these experiments. (C′) 1.8× magnification of boxed areas in C. Only p21 staining is shown. (D) Quantification of p21 expression in control and experimental mouse sections (n=4 each). P-value for unpaired Mann–Whitney test is shown. Data are mean±s.d.
Fig. 8.
Fig. 8.
A germline-recombined version of the TigreDragon-p21 allele becomes responsive to active (r)tTA only. (A) Depiction of the recombined allele (p21rec) and how it works in the presence of Col2-rtTA (Cart-p21 model). Note that the crosses include Pitx2-Cre for control purposes, even though it is not necessary for p21 expression. (B) Representative micrograph showing p21 expression in left and right proximal tibial cartilage at E16.5, 4 days after Dox administration. Dashed outline indicates the proliferative zone (PZ). (C) Quantification and statistical analysis of p21+ cells in the PZ. Data points are shown. P-value for Wilcoxon matched-pairs signed rank test is shown (n=3).
Fig. 9.
Fig. 9.
The Dragon vectors can be used for in ovo electroporation. (A) Schematic of the electroporation procedure in the neural tube of chicken embryos and representative examples of the outcome (micrographs taken on a fluorescence dissecting microscope). (B,C) Individual and merged channels of transverse neural tube sections (dashed lines) from electroporated chicken embryos, either untreated (B, n=3) or Dox-treated (C, n=11), 24 h after electroporation. In order to be able to visualize the native fluorescence of BFP, we used a green nuclear stain (SYTOX Green).
Fig. 10.
Fig. 10.
Orthogonal Dragon-driven gene mis-expression combining electroporation and implantation of Cre-soaked beads. (A) Schematic of the procedure of electroporation followed by bead implantation. (B) Implantation of TAT-Cre beads (3 mg/ml) activates tdT expression in some of the electroporated cells (TagBFP+) close by, but not in cells further than ∼100 μm from the bead. Native expression of TagBFP is shown. (C,D) Control experiments with PBS-only beads and a full electroporation mix (C, n=5) and Cre-beads in the presence of an electroporation mix lacking the rtTA plasmid (D, n=5). Scale bars in the right panels of B apply to C and D.

References

    1. Belteki G., Haigh J., Kabacs N., Haigh K., Sison K., Costantini F., Whitsett J., Quaggin S. E. and Nagy A. (2005). Conditional and inducible transgene expression in mice through the combinatorial use of Cre-mediated recombination and tetracycline induction. Nucleic Acids Res. 33, e51 10.1093/nar/gni051 - DOI - PMC - PubMed
    1. Blank M. C., Chizhikov V. Millen K. J. (2007). In ovo electroporations of HH stage 10 chicken embryos. J. Vis. Exp. 9, e408 10.3791/408 - DOI - PMC - PubMed
    1. Breitman M. L., Rombola H., Maxwell I. H., Klintworth G. K. and Bernstein A. (1990). Genetic ablation in transgenic mice with an attenuated diphtheria toxin A gene. Mol. Cell. Biol. 10, 474-479. 10.1128/MCB.10.2.474 - DOI - PMC - PubMed
    1. Brocard J., Feil R., Chambon P. and Metzger D. (1998). A chimeric Cre recombinase inducible by synthetic,but not by natural ligands of the glucocorticoid receptor. Nucleic Acids Res. 26, 4086-4090. 10.1093/nar/26.17.4086 - DOI - PMC - PubMed
    1. Dymecki S. M. and Kim J. C. (2007). Molecular neuroanatomy's “Three Gs”: a primer. Neuron 54, 17-34. 10.1016/j.neuron.2007.03.009 - DOI - PMC - PubMed

Publication types