. 2020 Aug;69(8):1833-1842.
doi: 10.2337/db19-0592. Epub 2020 May 4.

Longitudinal Analysis of Serum Cytokine Levels and Gut Microbial Abundance Links IL-17/IL-22 With Clostridia and Insulin Sensitivity in Humans

Affiliations

Longitudinal Analysis of Serum Cytokine Levels and Gut Microbial Abundance Links IL-17/IL-22 With Clostridia and Insulin Sensitivity in Humans

Xin Zhou et al. Diabetes. 2020 Aug.

Abstract

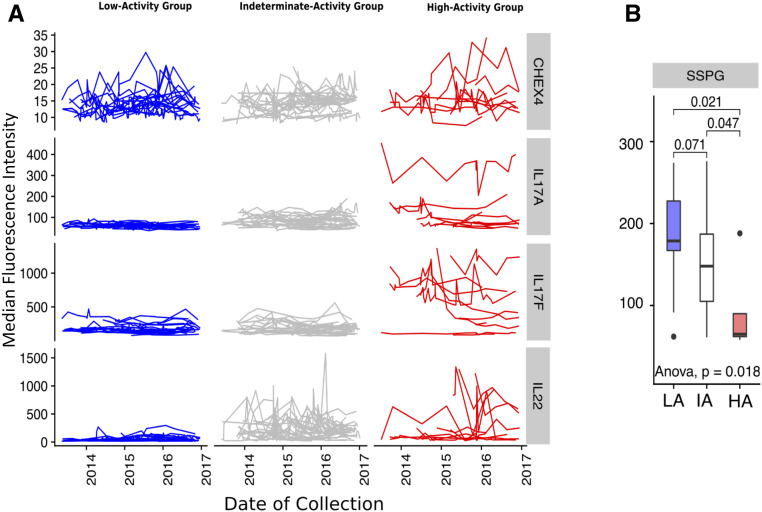
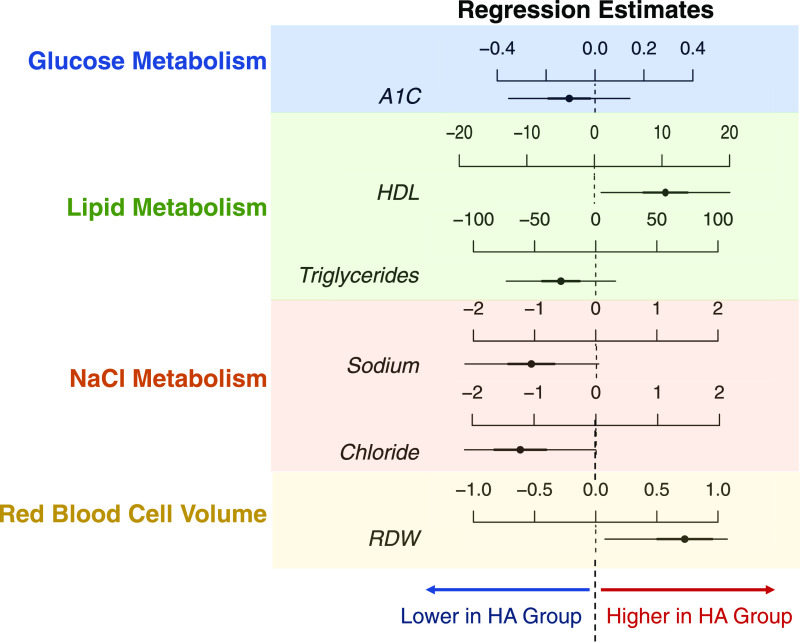
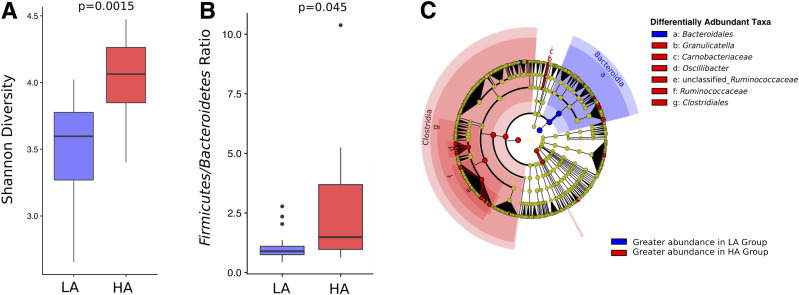
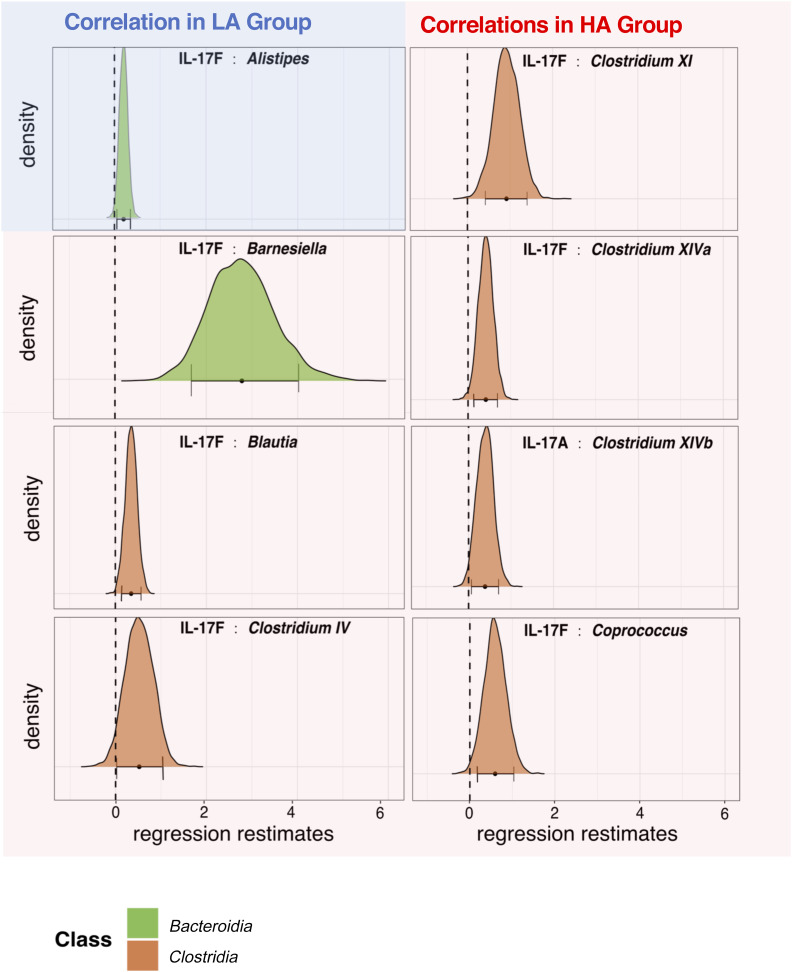
Recent studies using mouse models suggest that interaction between the gut microbiome and IL-17/IL-22-producing cells plays a role in the development of metabolic diseases. We investigated this relationship in humans using data from the prediabetes study of the Integrated Human Microbiome Project (iHMP). Specifically, we addressed the hypothesis that early in the onset of metabolic diseases there is a decline in serum levels of IL-17/IL-22, with concomitant changes in the gut microbiome. Clustering iHMP study participants on the basis of longitudinal IL-17/IL-22 profiles identified discrete groups. Individuals distinguished by low levels of IL-17/IL-22 were linked to established markers of metabolic disease, including insulin sensitivity. These individuals also displayed gut microbiome dysbiosis, characterized by decreased diversity, and IL-17/IL-22-related declines in the phylum Firmicutes, class Clostridia, and order Clostridiales This ancillary analysis of the iHMP data therefore supports a link between the gut microbiome, IL-17/IL-22, and the onset of metabolic diseases. This raises the possibility for novel, microbiome-related therapeutic targets that may effectively alleviate metabolic diseases in humans as they do in animal models.


Figures

Figure 1
Figure 1
Participants grouped according to IL-17/IL-22 cytokines. A: Gaussian mixture modeling of cytokine mean abundance and variance separates study participants into three discrete groups (columns). Lines within each panel represent repeated measurements of serum cytokine abundance for one individual over the study period. Rows represent serum cytokines (IL-17A, IL-17F, IL-22). CHEX4 is a measurement of background fluorescence intensity and can be treated as a negative control. (Note: different scales on y-axis for each row.) B: SSPG (mg/dL) measurement by group. P values for pairwise Wilcoxon test are labeled above the bar plot, and the P value for a one-way ANOVA test is labeled under the bar plot. The analysis in A was based on 297, 371, and 112 repeated measurements for HA, IA, and LA subjects, respectively.
Figure 2
Figure 2
Linear mixed model estimates on fixed effects introduced by LA and HA group. Results for full linear mixed models are shown in Supplementary Fig. 9. The comparisons of active vs. inactive groups are presented here. Dashed lines represent the LA group, while regression estimates for the HA group are displayed as horizontal lines. The center of each horizontal line is the β-coefficient of regression, while thick lines represent 50% credible intervals or ±1 SD and thin lines represent 95% credible intervals or ±2 SD. A1C, hemoglobin A1c. This analysis is based on 88 and 229 repeated measurements for HA and LA subjects, respectively.
Figure 3
Figure 3
Differences in the gut microbiome of IL-17/IL-22 LA and HA subjects. A: Shannon diversity estimates for the HA and LA. Mean value of diversity for each participant across the study period is used to generate this plot. The P value from a Wilcoxon test is labeled above the plot. B: Firmicutes-to-Bacteroidetes ratio of HA and LA. Mean value of Firmicutes-to-Bacteroidetes ratio for each participant across the study period is used to generate this plot. The P value from a Wilcoxon test is labeled above the plot. C: Cladogram representing the LEfSe results for comparing taxa abundance between HA and LA groups. Circles on the cladogram represent the phylogenetic relationship of taxa that are tested, with phylum at the center and operational taxonomic unit (OTU) on the edges. Each point represents a taxonomic unit. Red color covering a dot/region indicates the taxa that are more abundant in the HA group, and blue color covering a dot/area indicates the taxa are more abundant in the LA group.
Figure 4
Figure 4
Bacterial genera whose abundance correlates with serum IL-17. Significant correlations between serum IL-17 and bacterial genus abundance are shown for HA subjects (red panels) and LA subjects (blue panel). Distributions show estimated effect sizes from Bayesian Markov chain Monte Carlo draws after parameter convergence. Panels show bacteria for which the estimated effect is significantly greater or less than zero (95% credible interval does not include zero). This analysis was based on 264 and 100 repeated measurements for HA and LA subjects, respectively.

References

    1. Al Khodor S, Reichert B, Shatat IF. The microbiome and blood pressure: can microbes regulate our blood pressure? Front Pediatr 2017;5:138. - PMC - PubMed
    1. Yan Q, Gu Y, Li X, et al. . Alterations of the gut microbiome in hypertension. Front Cell Infect Microbiol 2017;7:381. - PMC - PubMed
    1. Jiao N, Baker SS, Nugent CA, et al. . Gut microbiome may contribute to insulin resistance and systemic inflammation in obese rodents: a meta-analysis. Physiol Genomics 2018;50:244–254 - PubMed
    1. Parekh PJ, Balart LA, Johnson DA. The influence of the gut microbiome on obesity, metabolic syndrome, and gastrointestinal disease. Clin Transl Gastroenterol 2015;6:e91. - PMC - PubMed
    1. Caricilli AM, Saad MJ. The role of gut microbiota on insulin resistance. Nutrients 2013;5:829–851 - PMC - PubMed

Publication types