

doi: 10.1128/AAC.00819-20.
Print 2020 Jun 23.
Identification of Antiviral Drug Candidates against SARS-CoV-2 from FDA-Approved Drugs
Affiliations
- PMID: 32366720
- PMCID: PMC7318052
- DOI: 10.1128/AAC.00819-20
Item in Clipboard
Identification of Antiviral Drug Candidates against SARS-CoV-2 from FDA-Approved Drugs
Antimicrob Agents Chemother.
.
Abstract
Drug repositioning is the only feasible option to immediately address the COVID-19 global challenge. We screened a panel of 48 FDA-approved drugs against severe acute respiratory syndrome coronavirus 2 (SARS-CoV-2) which were preselected by an assay of SARS-CoV. We identified 24 potential antiviral drug candidates against SARS-CoV-2 infection. Some drug candidates showed very low 50% inhibitory concentrations (IC50s), and in particular, two FDA-approved drugs-niclosamide and ciclesonide-were notable in some respects.
Keywords: COVID-19; FDA-approved drug; SARS-CoV-2.
Copyright © 2020 American Society for Microbiology.
Figures
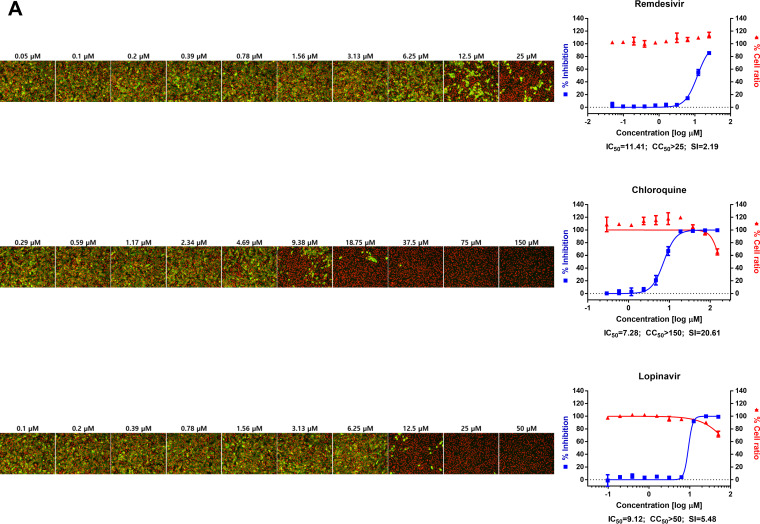
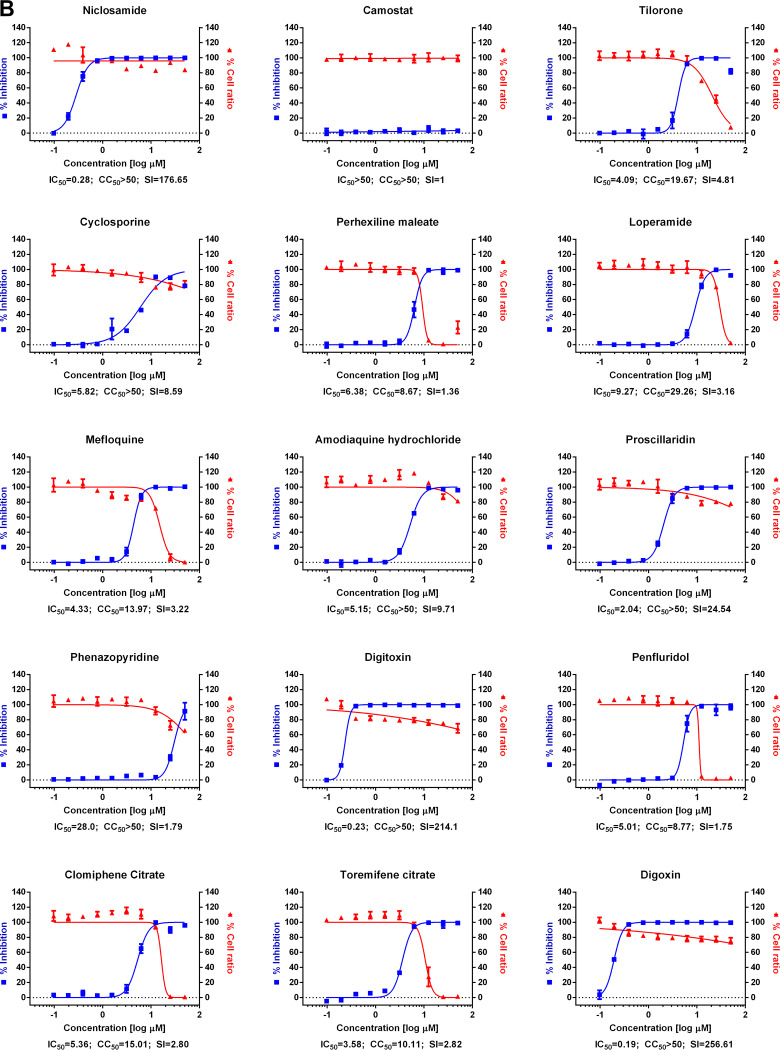
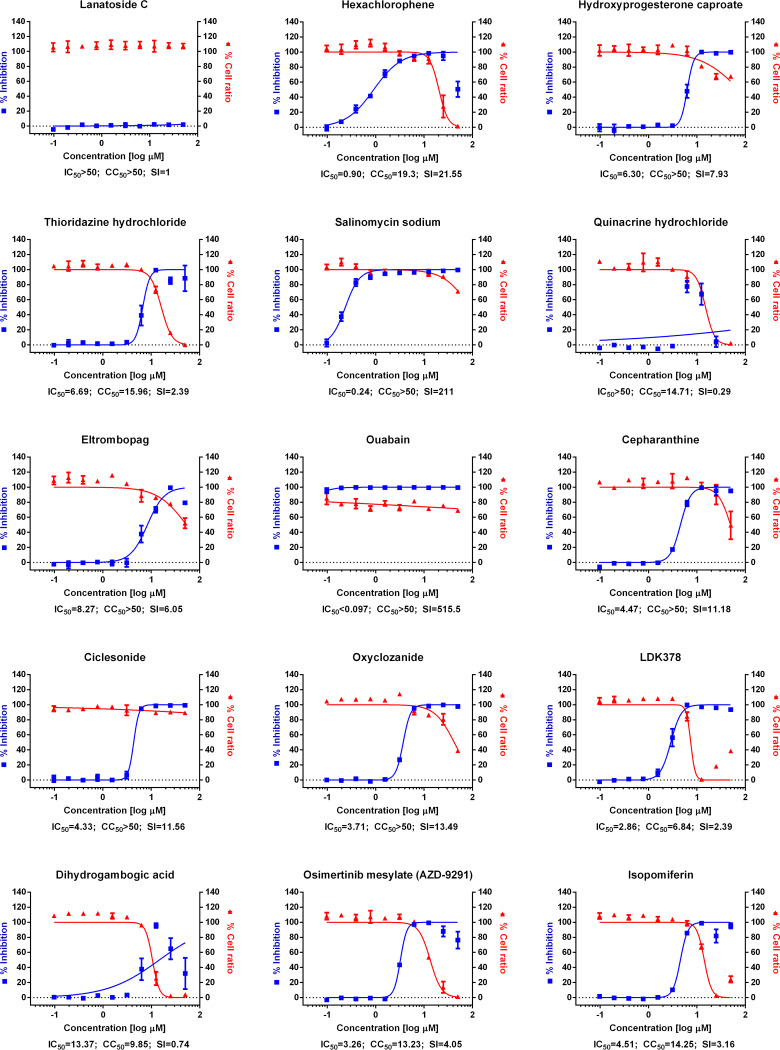
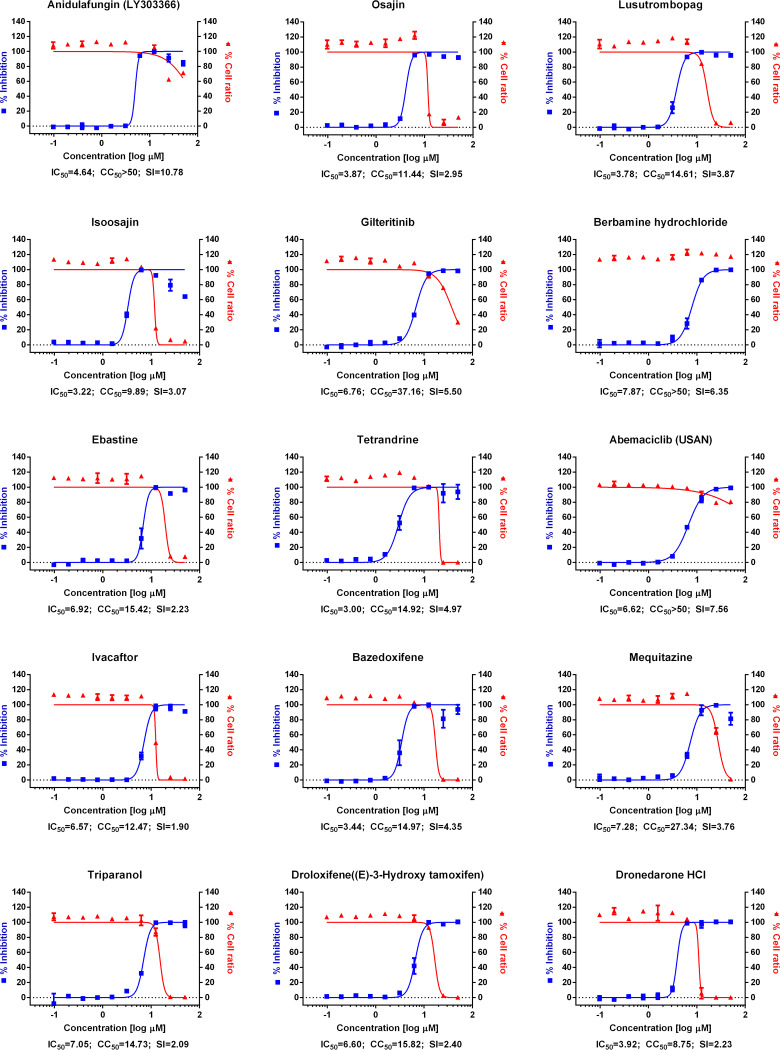
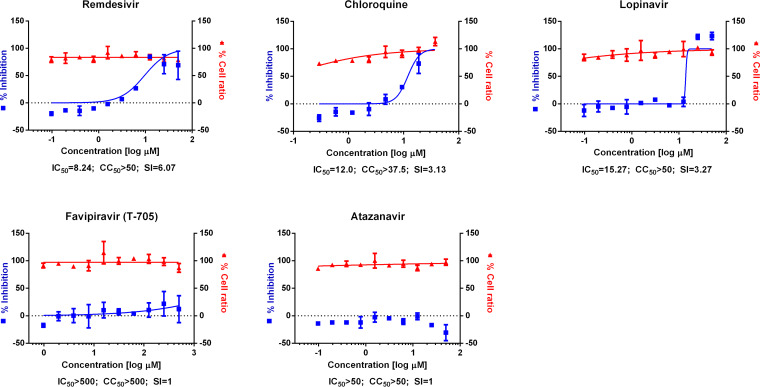
(A) Dose-response curve analysis by immunofluorescence for reference drugs. The blue squares represent inhibition of SARS-CoV-2 infection (%), and the red triangles represent cell viability (%). The confocal microscope images show cell nuclei (red) and viral N protein (green) at each drug concentration. Means ± SD were calculated from duplicate experiments. (B) Dose-response curve analysis by immunofluorescence for 45 drugs that were tested in this study. The blue squares represent inhibition of SARS-CoV-2 infection (%), and the red triangles represent cell viability (%). Means ± SD were calculated from duplicate experiments.
(A) Dose-response curve analysis by immunofluorescence for reference drugs. The blue squares represent inhibition of SARS-CoV-2 infection (%), and the red triangles represent cell viability (%). The confocal microscope images show cell nuclei (red) and viral N protein (green) at each drug concentration. Means ± SD were calculated from duplicate experiments. (B) Dose-response curve analysis by immunofluorescence for 45 drugs that were tested in this study. The blue squares represent inhibition of SARS-CoV-2 infection (%), and the red triangles represent cell viability (%). Means ± SD were calculated from duplicate experiments.
(A) Dose-response curve analysis by immunofluorescence for reference drugs. The blue squares represent inhibition of SARS-CoV-2 infection (%), and the red triangles represent cell viability (%). The confocal microscope images show cell nuclei (red) and viral N protein (green) at each drug concentration. Means ± SD were calculated from duplicate experiments. (B) Dose-response curve analysis by immunofluorescence for 45 drugs that were tested in this study. The blue squares represent inhibition of SARS-CoV-2 infection (%), and the red triangles represent cell viability (%). Means ± SD were calculated from duplicate experiments.
(A) Dose-response curve analysis by immunofluorescence for reference drugs. The blue squares represent inhibition of SARS-CoV-2 infection (%), and the red triangles represent cell viability (%). The confocal microscope images show cell nuclei (red) and viral N protein (green) at each drug concentration. Means ± SD were calculated from duplicate experiments. (B) Dose-response curve analysis by immunofluorescence for 45 drugs that were tested in this study. The blue squares represent inhibition of SARS-CoV-2 infection (%), and the red triangles represent cell viability (%). Means ± SD were calculated from duplicate experiments.
Dose-response curve analysis by cytopathic effect. The blue squares represent inhibition of SARS-CoV-2 infection (%), and the red triangles represent cell viability (%). Means ± SD were calculated from duplicate experiments.
References
-
- Zhou P, Yang X-L, Wang X-G, Hu B, Zhang L, Zhang W, Si H-R, Zhu Y, Li B, Huang C-L, Chen H-D, Chen J, Luo Y, Guo H, Jiang R-D, Liu M-Q, Chen Y, Shen X-R, Wang X, Zheng X-S, Zhao K, Chen Q-J, Deng F, Liu L-L, Yan B, Zhan F-X, Wang Y-Y, Xiao G-F, Shi Z-L. 2020. A pneumonia outbreak associated with a new coronavirus of probable bat origin. Nature 579:270–273. doi: 10.1038/s41586-020-2012-7. - DOI - PMC - PubMed
-
- Mizumoto K, Chowell G. 2020. Estimating the risk of 2019 novel coronavirus death during the course of the outbreak in China, 2020. medRxiv doi: 10.1101/2020.02.19.20025163. - DOI
-
- Li Q, Guan X, Wu P, Wang X, Zhou L, Tong Y, Ren R, Leung KSM, Lau EHY, Wong JY, Xing X, Xiang N, Wu Y, Li C, Chen Q, Li D, Liu T, Zhao J, Liu M, Tu W, Chen C, Jin L, Yang R, Wang Q, Zhou S, Wang R, Liu H, Luo Y, Liu Y, Shao G, Li H, Tao Z, Yang Y, Deng Z, Liu B, Ma Z, Zhang Y, Shi G, Lam TTY, Wu JT, Gao GF, Cowling BJ, Yang B, Leung GM, Feng Z. 2020. Early transmission dynamics in Wuhan, China, of novel coronavirus-infected pneumonia. N Engl J Med 382:1199–1207. doi: 10.1056/NEJMoa2001316. - DOI - PMC - PubMed
Publication types
MeSH terms
Substances
LinkOut - more resources
Full Text Sources
Other Literature Sources
Medical
Miscellaneous
