. 2020 May 4;11(1):2200.
doi: 10.1038/s41467-020-15966-7.

Intracellular Staphylococcus aureus persisters upon antibiotic exposure

Affiliations

Intracellular Staphylococcus aureus persisters upon antibiotic exposure

Frédéric Peyrusson et al. Nat Commun. .

Abstract

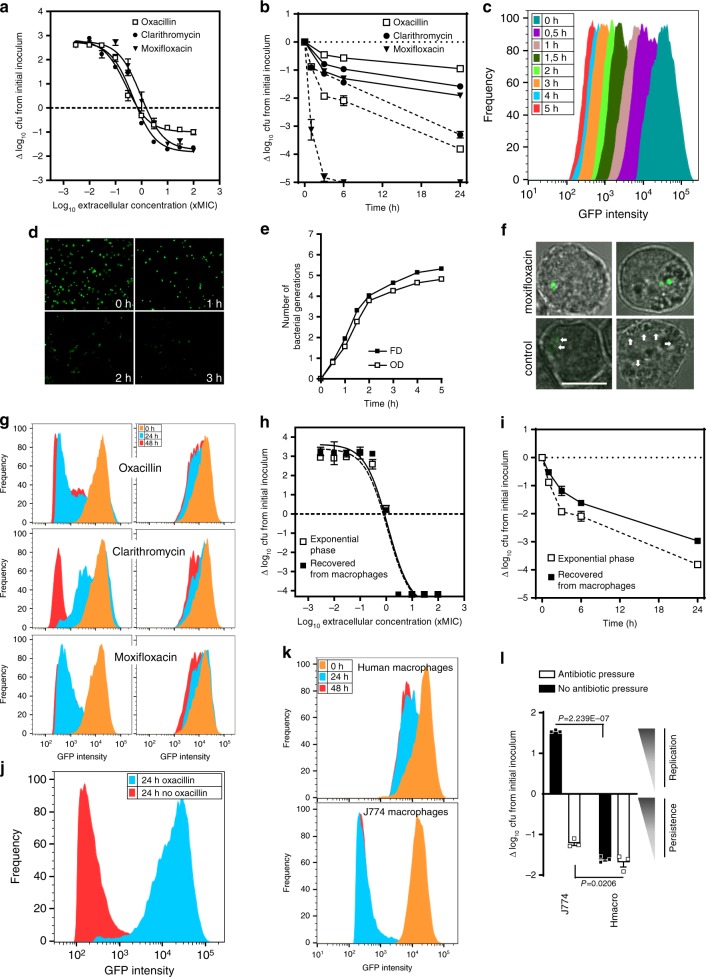
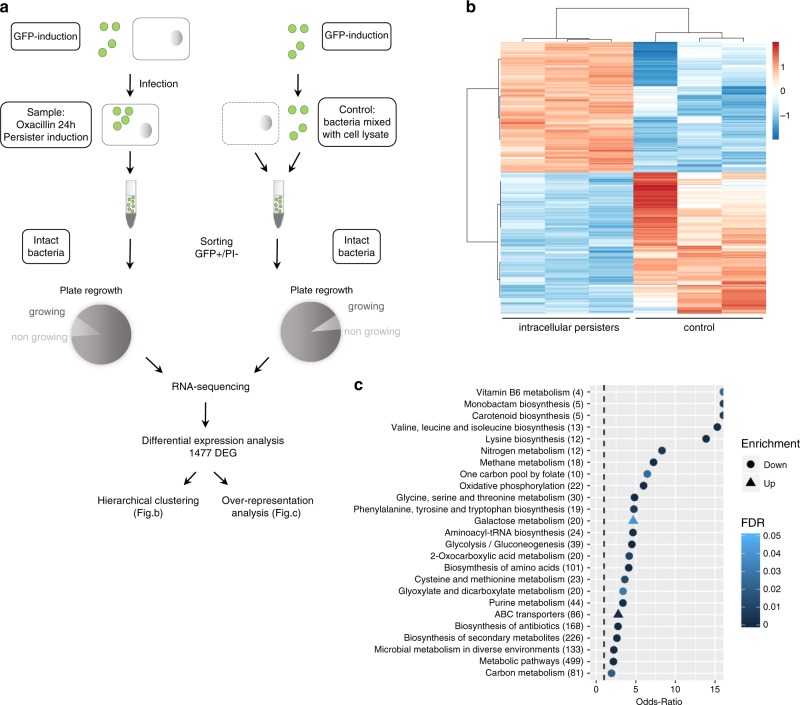
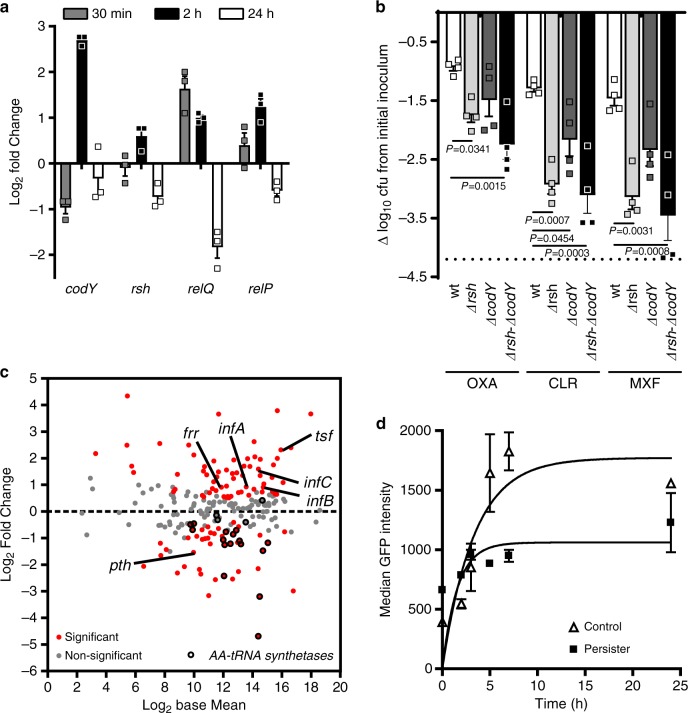
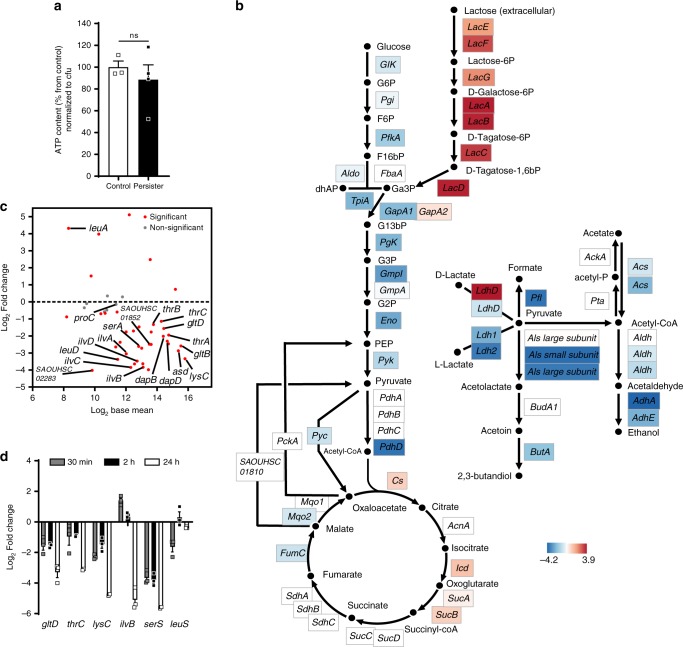
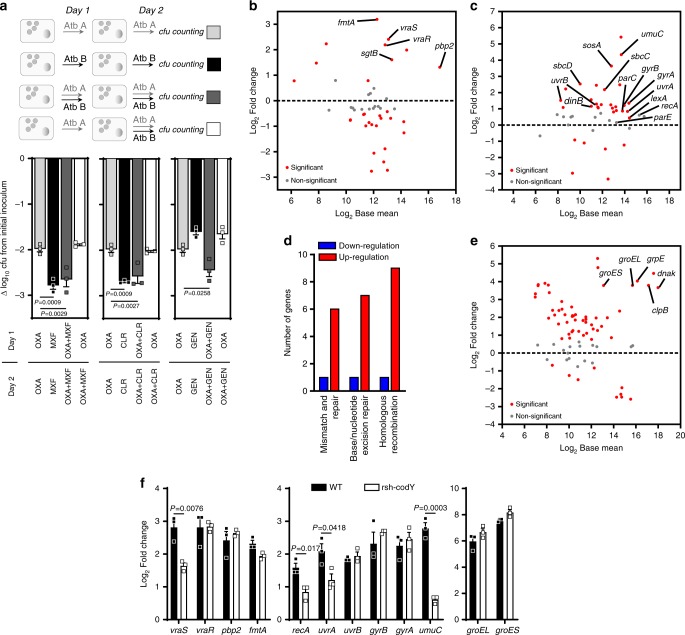
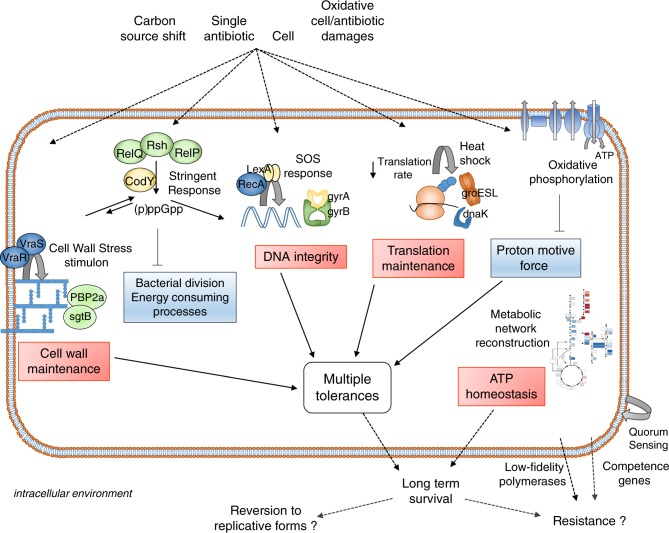
Bacterial persister cells are phenotypic variants that exhibit a transient non-growing state and antibiotic tolerance. Here, we provide in vitro evidence of Staphylococcus aureus persisters within infected host cells. We show that the bacteria surviving antibiotic treatment within host cells are persisters, displaying biphasic killing and reaching a uniformly non-responsive, non-dividing state when followed at the single-cell level. This phenotype is stable but reversible upon antibiotic removal. Intracellular S. aureus persisters remain metabolically active but display an altered transcriptomic profile consistent with activation of stress responses, including the stringent response as well as cell wall stress, SOS and heat shock responses. These changes are associated with multidrug tolerance after exposure to a single antibiotic. We hypothesize that intracellular S. aureus persisters may constitute a reservoir for relapsing infection and could contribute to therapeutic failures.


Conflict of interest statement

The authors declare no competing interests.

Figures

Fig. 1
Fig. 1. Evidence and dynamics of intracellular persisters of S. aureus.
a Antibiotic activity against S. aureus infecting J774 macrophages exposed to increasing concentrations of antibiotics for 24 h (data expressed as log10 cfu reduction from postphagocytosis inoculum). b Time-kill curves against S. aureus infecting J774 macrophages (solid lines) or in exponential phase culture (dotted lines) exposed to 50x MIC of antibiotics for the indicated periods. c Fluorescence dilution (FD) experiment with S. aureus expressing inducible GFP. Bacteria washed from inducer at the entry of exponential phase were grown in fresh broth. The graph shows flow cytometric profiles of the frequency of events as a function of GFP intensity over time. d Corresponding images in epifluorescence microscopy. e Corresponding bacterial replication curves determined by FD and OD620nm (OD), which displayed similar doubling times (e.g., 27 min and 28.7 min between 1 h and 2 h, respectively; N [number of generations]). f Confocal microscopy of infected J774 macrophages exposed to 50x MIC moxifloxacin or under control conditions (2x MIC gentamicin) for 24 h. Arrows: bacteria with diluted signal (bar: 10 μm). g Flow cytometric profiles of bacteria recovered from macrophages exposed to 2×(left) or 50x MIC (right) of each antibiotic for the indicated periods. h, i Activity of oxacillin (h, concentration-effect at 24 h; i, time-kill curve with 50x MIC oxacillin) in broth, against an exponential phase culture (open symbols) or bacteria recovered from macrophages exposed to 50x MIC oxacillin for 24 h (closed symbols). j Flow cytometric profiles of bacteria recovered from macrophages exposed to 50x MIC oxacillin for 24 h (blue), then washed from oxacillin and reincubated in control conditions (2× MIC gentamicin) for an additional period of 24 h (red). k Flow cytometric profiles of bacteria recovered from control (2x MIC gentamicin) J774 and human macrophages for the indicated periods. l Intracellular inoculum in infected J774 and human macrophages incubated for 24 h with 50× MIC oxacillin or in control conditions (2× MIC gentamicin). Statistical significance was determined by two-tailed Student’s t-test. Data are means ± SEM (a, b, h, i, l) or representatives results (c, d, e, f, g, j, k) of three independent experiments. a, b, e, h, i, l, Source data are provided as a Source Data file.
Fig. 2
Fig. 2. Intracellular antibiotic-induced persisters exhibit a profoundly altered transcriptomic profile.
a Experimental procedure for sorting and RNA-sequencing of S. aureus persisters of SH1000. Cells infected by GFP-expressing bacteria were exposed to 50x MIC oxacillin to allow for the induction of a homogeneous population of persisters. The subset of intact persisters and control samples were collected and sorted by fluorescence-activated cell sorting (FACS) by gating GFP positive (GFP+) and propidium iodide negative signals (PI−), and processed for RNA sequencing (three replicates per condition). 89% and 92% of sorted bacteria from samples and control were able to form colonies, respectively. Differentially expressed genes (DEG) were then analyzed by hierarchical clustering and over-representation analysis. b Heatmap displaying hierarchical clustering of DEGs between intracellular persisters and control samples from three biological replicates (color code is function of a Variance Stabilizing Transformation [VST]). c Over-representation analysis of DEGs. The graph displays over-represented up- and downregulated KEGG gene-sets (EnrichmentBrowser R package), using the Fisher’s Exact Test and evaluated through Odds-Ratio. Only gene-sets with a false discovery rate (FDR) lower than 0.05 were considered significantly enriched. Numbers in brackets represent the number of genes in the gene-set.
Fig. 3
Fig. 3. A transitory boost of stringent response contributes to initiate the switch to intracellular persistence.
a Quantitative real-time PCR of transcripts of stringent response regulators in intracellular persisters exposed to 50× MIC oxacillin for the indicated times. Data, expressed in fold change vs control samples (extracellular bacteria mixed with J774 cells lysate), are means ± SEM of three independent experiments. b Cfus recovered from macrophages infected by HG001 (WT) and its isogenic mutants and exposed to 50× MIC oxacillin, clarithromycin or moxifloxacin for 24 h. Data (expressed as reduction from the original inoculum) are means ± SEM of four independent experiments. The dotted line indicates the limit of detection. Statistical significance was determined by one-way ANOVA with Dunnett’s post-test. Oxacillin [OXA], clarithromycin [CLR], moxifloxacin [MXF]. c MA-plot of genes related to translation. The graph displays the log2 Fold Change expression as a function of log2 Base Mean (mean expression signal across all samples). Typical members of the function are pointed and aminoacyl-tRNA synthetases are shown in black. The dotted line indicates the basal expression level in control samples. Statistical significance is based on adjusted P-value. d Rate of GFP synthesis in intracellular S. aureus. Macrophages were infected by non-induced bacteria for 24 h, with (persisters) or without (control) 50× MIC oxacillin, and then induced for GFP expression for the indicated periods. Data are means ± SEM of GFP signal from flow cytometric profiles from three independent experiments. a, b, d, Source data are provided as a Source Data file.
Fig. 4
Fig. 4. Intracellular persister formation is not triggered by amino acid limitation nor ATP depletion.
a Intrabacterial ATP concentration in intracellular persisters (exposed to 50× MIC oxacillin for 24 h) and control samples (extracellular bacteria mixed with J774 cells lysate). Appropriate controls were performed to ensure the absence of contamination by eukaryotic ATP. Data are means ± SEM of three independent experiments. Statistical significance was determined by two-tailed Student’s t-test. ns non-statistically significant. b Schematic pathway of genes related to central carbon metabolism, annotated according to KEGG orthology and Genbank database and their log2 Fold Change expression levels. c MA-plot of genes related to amino acid metabolism within the stringent response stimulon (Supplementary Fig. 4; see reference). The graph displays the log2 Fold Change expression as a function of log2 Base Mean (mean expression signal across all samples). Genes prominently activated after amino acid depletion are pointed. The dotted line indicates the basal expression level in control samples. Statistical significance is based on adjusted P-value. d Quantitative real-time PCR of transcripts of genes related to amino acid synthesis in intracellular persisters exposed to 50x MIC oxacillin for the indicated periods. Data are means ± SEM of three independent experiments. a, d Source data are provided as a Source Data file.
Fig. 5
Fig. 5. A mosaic of redundant adaptive responses leads to multidrug tolerance.
a Activity of antibiotic combinations added simultaneously or in succession against intracellular persisters. Intracellular persisters were challenged to 50× MIC of antibiotics alone or in combination, and recovered from macrophages and proceeded for cfu counting after 48 h, following the experimental procedure described above. For combinations, antibiotics were added either at the same time as oxacillin or 24 h after oxacillin. Data (expressed as cfu reduction from the original inoculum) are means ± SEM of three independent experiments. Statistical significance was determined by one-way ANOVA with Dunnett’s post-test. Oxacillin [OXA], moxifloxacin [MXF], clarithromycin [CLR], gentamicin [GEN]. b, c MA-plots of genes related to peptidoglycan biosynthesis (extended to vraS/R and cell-envelope biogenesis genes from the cell wall stress stimulon) and SOS response stimulon,, respectively. The graphs display the log2 Fold Change expression as a function of log2 Base Mean (mean expression signal across all samples). Typical members of the stimulons are pointed. The dotted lines indicate the basal expression level in control samples. Statistical significance is based on adjusted P-value. d Number of up- or downregulated DEGs related to DNA repair. e MA-plot of genes related to heat shock stimulon. f Quantitative real-time PCR of transcripts of determinants of CWSS, SOS response, and heat shock stimulon, from left to right, in HG001 (WT) or HG001 rsh-codY double mutants (ΔrshcodY) exposed to 50× MIC oxacillin for 2 h of infection. Data are means ± SEM of three independent experiments. Statistical significance was determined by two-tailed Student’s t-test. a, f Source data are provided as a Source Data file.
Fig. 6
Fig. 6. Overview of intracellular persistence regulation of S. aureus.
In vacuolar nutrient-rich compartments, persisters are metabolically active cells shielding cell wall, DNA and translation products. Under pressure of the environmental factors from the host cell, including a carbon source shift and antibiotic pressure, persisters promote a network of stress or adaptive responses displaying multiple entries. Stringent response does not show signs of activity for prolonged periods but rather contributes partly to initiate the switch to a persister phenotype through (i) post-translational modifications, contributing to an almost immediate blockade of bacterial division, and (ii) transcriptional regulation, silencing energy-consuming processes. Regulation circuits also include the cell wall stress stimulon, the SOS response, and the heat shock response. These active responses, together with a decrease in oxidative phosphorylation and in translation levels, lead to multidrug tolerance upon exposure to a single antibiotic. This stable phenotype allows bacteria to maximize the chances of long-term survival. Finally, depending on the level of stress, this state could either revert to replicative forms, or promote the evolution to resistant forms, through increased probability of mutations and horizontal gene transfer.

References

    1. Bigger J. Treatment of staphylococcal infections with penicillin by intermittent sterilisation. Lancet. 1944;244:497–500. doi: 10.1016/S0140-6736(00)74210-3. - DOI
    1. Brauner A, et al. Distinguishing between resistance, tolerance and persistence to antibiotic treatment. Nat. Rev. Microbiol. 2016;14:320–330. doi: 10.1038/nrmicro.2016.34. - DOI - PubMed
    1. Balaban NQ, et al. Bacterial persistence as a phenotypic switch. Science. 2004;305:1622–1625. doi: 10.1126/science.1099390. - DOI - PubMed
    1. Fauvart M, De Groote VN, Michiels J. Role of persister cells in chronic infections: clinical relevance and perspectives on anti-persister therapies. J. Med. Microbiol. 2011;60:699–709. doi: 10.1099/jmm.0.030932-0. - DOI - PubMed
    1. Svenningsen MS, et al. Birth and resuscitation of (p)ppGpp induced antibiotic tolerant persister cells. Sci. Rep. 2019;9:6056. doi: 10.1038/s41598-019-42403-7. - DOI - PMC - PubMed

Publication types

MeSH terms

Substances