. 2020 May 4;11(5):315.
doi: 10.1038/s41419-020-2543-8.

The circular RNA FAM169A functions as a competitive endogenous RNA and regulates intervertebral disc degeneration by targeting miR-583 and BTRC

Affiliations

The circular RNA FAM169A functions as a competitive endogenous RNA and regulates intervertebral disc degeneration by targeting miR-583 and BTRC

Wei Guo et al. Cell Death Dis. .

Abstract

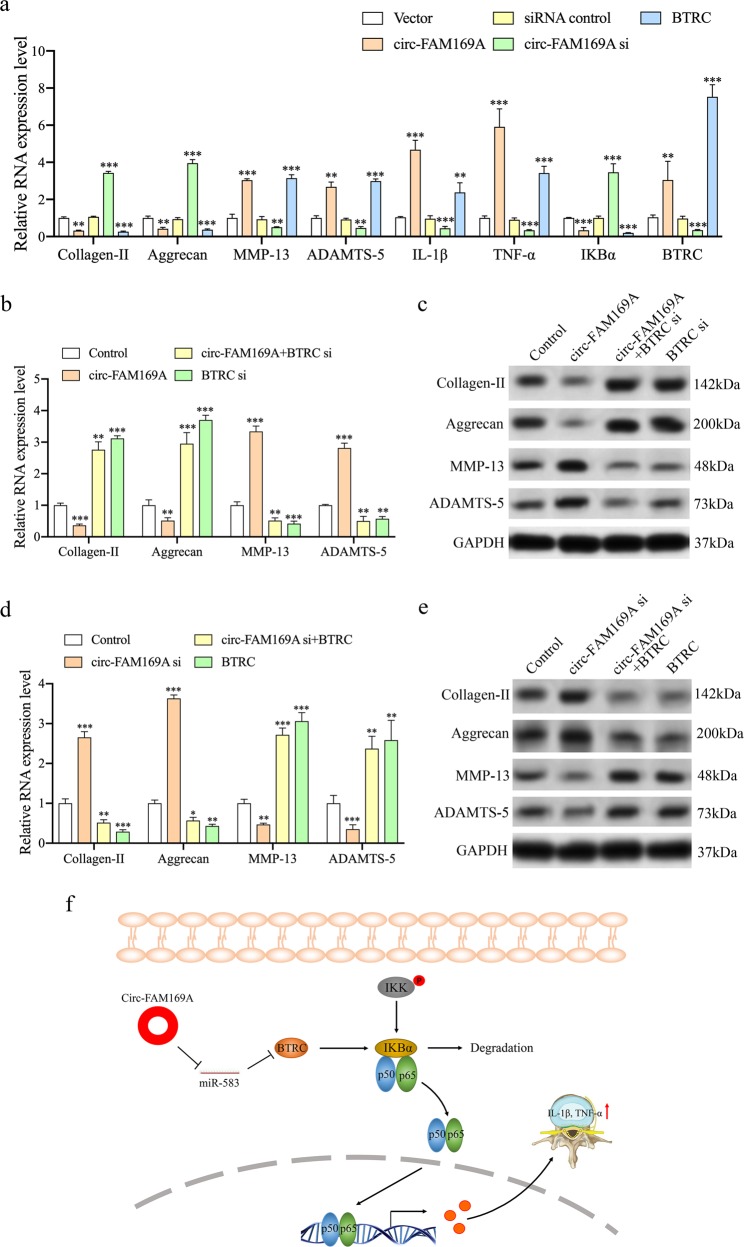
Intervertebral disc degeneration (IDD) is an important factor leading to low back pain, although the underlying mechanisms remain poorly understood. In this study we examined the role of circular RNA FAM169A (circ-FAM169A) in degenerative nucleus pulposus (NP) tissues, and validated its function in cultured human NP cells. Overexpression of circ-FAM169A in NP cells markedly enhanced extracellular matrix (ECM) catabolism and suppressed ECM anabolism in NP cells. Furthermore, circ-FAM169A sequestered miR-583, which could potentially upregulate BTRC, an inducer of the NF-κB signaling pathway. In conclusion, the present study revealed that circ-FAM169A promotes IDD development via miR-583/BTRC signaling. These findings provide a potential therapeutic option for the treatment of IDD.


Conflict of interest statement

The authors declare that they have no conflict of interest.

Figures

Fig. 1
Fig. 1. Identification of differentially expressed circRNAs.
a Amount of variance captured by PCA. b PCA score plot. c A Volcano plots were used for visualizing differential expression between two different conditions. The horizontal lines correspond to 2.0-fold (log2 scaled) up- and down-regulations, respectively; the vertical line represents an adjusted P value of 0.05 (−log10 scaled). The red and green points represent the upregulated- and downregulated circRNAs, with statistical significance. d Hierarchical cluster analysis of the significantly upregulated and downregulated-circRNAs. Each column represents a sample, and each row a circRNA. Red, upregulation; green, downregulation. e qRT-PCR analysis showing the expression levels of indicated circRNAs and linear isoforms between IDD and normal NP samples. f CircFAM169A configuration on chromosome 5 (upper part) showing exons 1–7 that form the precursor (FAM169A pre-mRNA). Its mature, circular form is shown in the lower part of the panel, and includes exons 2–6.
Fig. 2
Fig. 2. Circ-FAM169A is upregulated in degenerative NP tissues and regulates the synthesis of ECM components.
a The expression levels of circ-FAM169A in NP tissues were measured in 10 patients and 10 controls using qRT-PCR (***P < 0.001). b Circ-FAM169A expression had a significant positive correlation with IDD grade. c NP cells were transfected with circ-FAM169A siRNA or circ-FAM169A siRNA control. The levels of circ-FAM169A and its linear counterpart in NP cells were analyzed by qRT-PCR (***P < 0.001). d The expression levels of collagen-II, aggrecan, MMP13 and ADAMTS-5 were detected by qRT-PCR (***P < 0.001). e–h collagen-II, aggrecan, MMP-13, ADAMTS-5 expression levels were analyzed in circ-FAM169A siRNA transfected cultured human NP cells by immunofluorescence. The corresponding bar graphs show quantitative analysis of the relative fluorescent value of each group. Scale bar = 100 μm. i The corresponding bar graphs show quantitative analysis of the relative fluorescent value of each group (**P < 0.01, ***P < 0.001). j qRT-PCR analysis of cytoplasmic-to-nuclear expression ratios of circ-FAM169A, GAPDH, and U6 in NP cells. k RIP analysis of circ-FAM169A in NP cells using antibodies against AGO2. The RIP enrichment of the AGO2-associated circ-FAM169A was measured by qRT-PCR (***P < 0.001). l Circ-FAM169A and its 27 target miRNAs.
Fig. 3
Fig. 3. Circ-FAM169A acts as a miR-583 sponge.
a A Volcano plots were used for visualizing differential expression between two different conditions. The horizontal lines correspond to 1.5-fold (log2 scaled) up- and down-regulations, respectively; the vertical line represents an adjusted P value of 0.05 (−log10 scaled). The red and green points represent upregulated- and downregulated-expressed miRNAs, with statistical significance. b Hierarchical cluster analysis of the significantly upregulated and downregulated miRNAs. Each column represents a sample, and each row a miRNA. Red, upregulation; green, downregulation. c Venn diagram demonstrating the intersection of downregulated miRNAs and predicted target miRNAs. d The expression levels of miR-583 in NP tissues were measured in 10 patients and 10 controls by qRT-PCR (***P < 0.001). e MiR-583 expression showed a significant negative correlation with IDD grade. f MiR-583 expression had a significant negative correlation with circ-FAM169A expression. g Schematic illustration showing the 3′ UTR of luciferase reporters containing the complete circ-FAM169A sequence (Luc-circ-FAM169A) and circ-FAM169A sequence with deletions of miR-583 (Luc-circ-FAM169A-mut1, Luc-circ-FAM169A-mut2 and Luc-circ-FAM169A-mut3) binding sites, respectively. h Reporter assays showing the luciferase activities of Luc-circ-FAM169A and Luc-circ-FAM169A-mut1-3 in NP cells co-transfected with miR-583 mimics, or a scrambled oligonucleotide (control) (**P < 0.01, ***P < 0.001). i qRT-PCR analysis of circ-FAM169A pulled-down by biotinylated miR-583 mimics in NP cells (*P < 0.05, ***P < 0.001). j FISH detection of the subcellular localizations of circ-FAM169A and miR-583. Both molecules were co-localized and both cytoplasmic.
Fig. 4
Fig. 4. Function of miR-583 in NP cells.
a NP cells were transfected with miR-583 mimics, miR-NC, miR-583 siRNA, or miR-si NC. Then, miR-583 levels in NP cells were analyzed by qRT-PCR (**P < 0.01, ***P < 0.001). b, c Western blotting and qRT-PCR were performed to analyze collagen-II, aggrecan, MMP-13, ADAMTS-5 protein and mRNA expression levels, respectively, in NP cells after transfection with miR-583 mimics (**P < 0.01, ***P < 0.001). d, e Western blotting and qRT-PCR were performed to analyze the collagen-II, aggrecan, MMP-13, ADAMTS-5 protein, and mRNA expression levels, respectively, in NP cells after transfection with miR-583 siRNA. (**P < 0.01, ***P < 0.001).
Fig. 5
Fig. 5. Identification of BTRC as a target gene of miR-583.
a Volcano plots were used for visualizing differential expression between two different conditions. The horizontal lines correspond to 2.0-fold (log2 scaled) up- and down-regulations, respectively; the vertical line represents an adjusted P value of 0.05 (−log10 scaled). The red and green points represent upregulated- and downregulated-expressed mRNAs, with statistical significance. b Hierarchical cluster analysis of the significantly upregulated and downregulated mRNAs. Each column represents a sample and each row represents an mRNA. Red, upregulation; green, downregulation. c The Venn diagram indicates the intersection of upregulated mRNAs and target mRNA predicted by the miRWalk and TargetScan databases. d Sequence alignment of human miR-583 and the 3′-UTR region of BTRC mRNA. Bottom, mutations in the 3′-UTR region of BTRC to create mutant luciferase reporter constructs. e Luciferase reporter assay in NP cells after transfection with miR-NC or miR-583 mimics (***P < 0.001). f BTRC expression had a significant negative correlation with miR-583 expression. g NP cells were transfected with miR-583 mimics, miR-NC, miR-583 siRNA, or miR-si NC. Western blot analysis showed that BTRC expression was suppressed by miR-583 upregulation and elevated by miR-583 knockdown. h, i The expression of BTRC levels in NP tissues were measured in 10 patients and 10 controls by qRT-PCR and Western blot (***P < 0.001). j BTRC expression had a significant positive correlation with IDD grade.
Fig. 6
Fig. 6. Circ-FAM169A regulates IDD by modulating the BTRC/NF-κB signaling pathway.
a Cultured NP cells were transfected with circ-FAM169A, circ-FAM169A siRNA, their negative controls, or BTRC for 72 h, and the levels of collagen-II, aggrecan, MMP-13, ADAMTS-5, IL-1β, TNF-α, IKBα and BTRC were measured by qRT-PCR (**P < 0.01, ***P < 0.001). b, c The rescue experiment was established in cultured NP cells to validate the relationship between circ-FAM169A and BTRC. qRT-PCR and Western blotting demonstrated that reduced collagen-II and aggrecan amounts as well as increased MMP13 and ADAMTS-5 expression levels by circ-FAM169A were blunted by knockdown of BTRC (**P < 0.01, ***P < 0.001). de qRT-PCR and Western blotting showed that upregulation of collagen-II and aggrecan by circ-FAM169A siRNA was abolished by BTRC overexpression. Conversely, downregulation of MMP-13 and ADAMT-5 by circ-FAM169A silencing was abolished by BTRC overexpression (**P < 0.01, ***P < 0.001). f Schematic representation of the mechanisms by which circ-FAM169A mediates IDD development. Based on the findings described in the manuscript, circ-FAM169A upregulates BTRC in NP cells, leading to the degradation of IKBα. In turn, this leads to increased levels of multiple proinflammatory cytokines (IL-1β and TNF-α), decreased collagen-II and aggrecan levels, and increased levels of MMP-13 and ADAMTS-5, inducing an imbalance between anabolic and catabolic activities of NP cells. These adverse factors initiate or accelerate IDD.
Fig. 7
Fig. 7. Circ-GRB10 attenuates IDD development in vivo.
a Overview of the experimental set-up with injections of circ-FAM169A siRNA, or negative control at 1, and 7 days after surgery. b CT scans of the indicated groups were obtained 9 weeks after needle puncture. c A significant increase in DHI% was noted at 9 weeks post surgery in rats treated with circ-FAM169A siRNA. d MRI of the indicated groups were obtained 9 weeks after needle puncture (***P < 0.001). e MRI grades in the indicated groups at 9 weeks after needle puncture. The degree of disc degeneration assessed by MRI grade was significantly lower in the circ-FAM169A siRNA group compared with the non-injection group (***P < 0.001). f qRT-PCR showed that high circ-FAM169A levels in the punctured intervertebral discs were decreased by the injection of circ-FAM169A siRNA (***P < 0.001). g qRT-PCR showed that the decreased levels of miR-583 in the punctured intervertebral discs were rescued by the injection of circ-FAM169A siRNA (***P < 0.001). h H&E (top) and safranin-O/fast green (bottom) staining of intervertebral discs in the indicated groups at 9 weeks after needle puncture. Scale bar = 500 μm. i A significant decrease in intervertebral disc grade was noted in the circ-FAM169A knockdown group compared with the non-injection group (***P < 0.001). j Immunostaining for collagen-II, aggrecan, MMP-13 and ADAMTS-5 in the IDD model treated with circ-FAM169A siRNA at 9 weeks. Scale bar = 100 µm.

References

    1. Buckwalter JA. Aging and degeneration of the human intervertebral disc. Spine. 1995;20:1307–1314. doi: 10.1097/00007632-199506000-00022. - DOI - PubMed
    1. Costi JJ, Stokes IA, Gardner-Morse MG, Iatridis JC. Frequency-dependent behavior of the intervertebral disc in response to each of six degree of freedom dynamic loading: solid phase and fluid phase contributions. Spine. 2008;33:1731–1738. doi: 10.1097/BRS.0b013e31817bb116. - DOI - PMC - PubMed
    1. Kalichman L, Hunter DJ. The genetics of intervertebral disc degeneration. Familial predisposition and heritability estimation. Joint Bone Spine. 2008;75:383–387. doi: 10.1016/j.jbspin.2007.11.003. - DOI - PubMed
    1. Samartzis D, et al. A population-based study of juvenile disc degeneration and its association with overweight and obesity, low back pain, and diminished functional status. J. Bone Jt. Surg. Am. 2011;93:662–670. doi: 10.2106/JBJS.I.01568. - DOI - PubMed
    1. Friedman BW, et al. One-week and 3-month outcomes after an emergency department visit for undifferentiated musculoskeletal low back pain. Ann. Emerg. Med. 2012;59:128–133 e123. doi: 10.1016/j.annemergmed.2011.09.012. - DOI - PubMed

Publication types

MeSH terms