. 2020 Jun;16(6):644-652.
doi: 10.1038/s41589-020-0529-6. Epub 2020 May 4.

Plasma membranes are asymmetric in lipid unsaturation, packing and protein shape

Affiliations

Plasma membranes are asymmetric in lipid unsaturation, packing and protein shape

J H Lorent et al. Nat Chem Biol. 2020 Jun.

Erratum in

Abstract

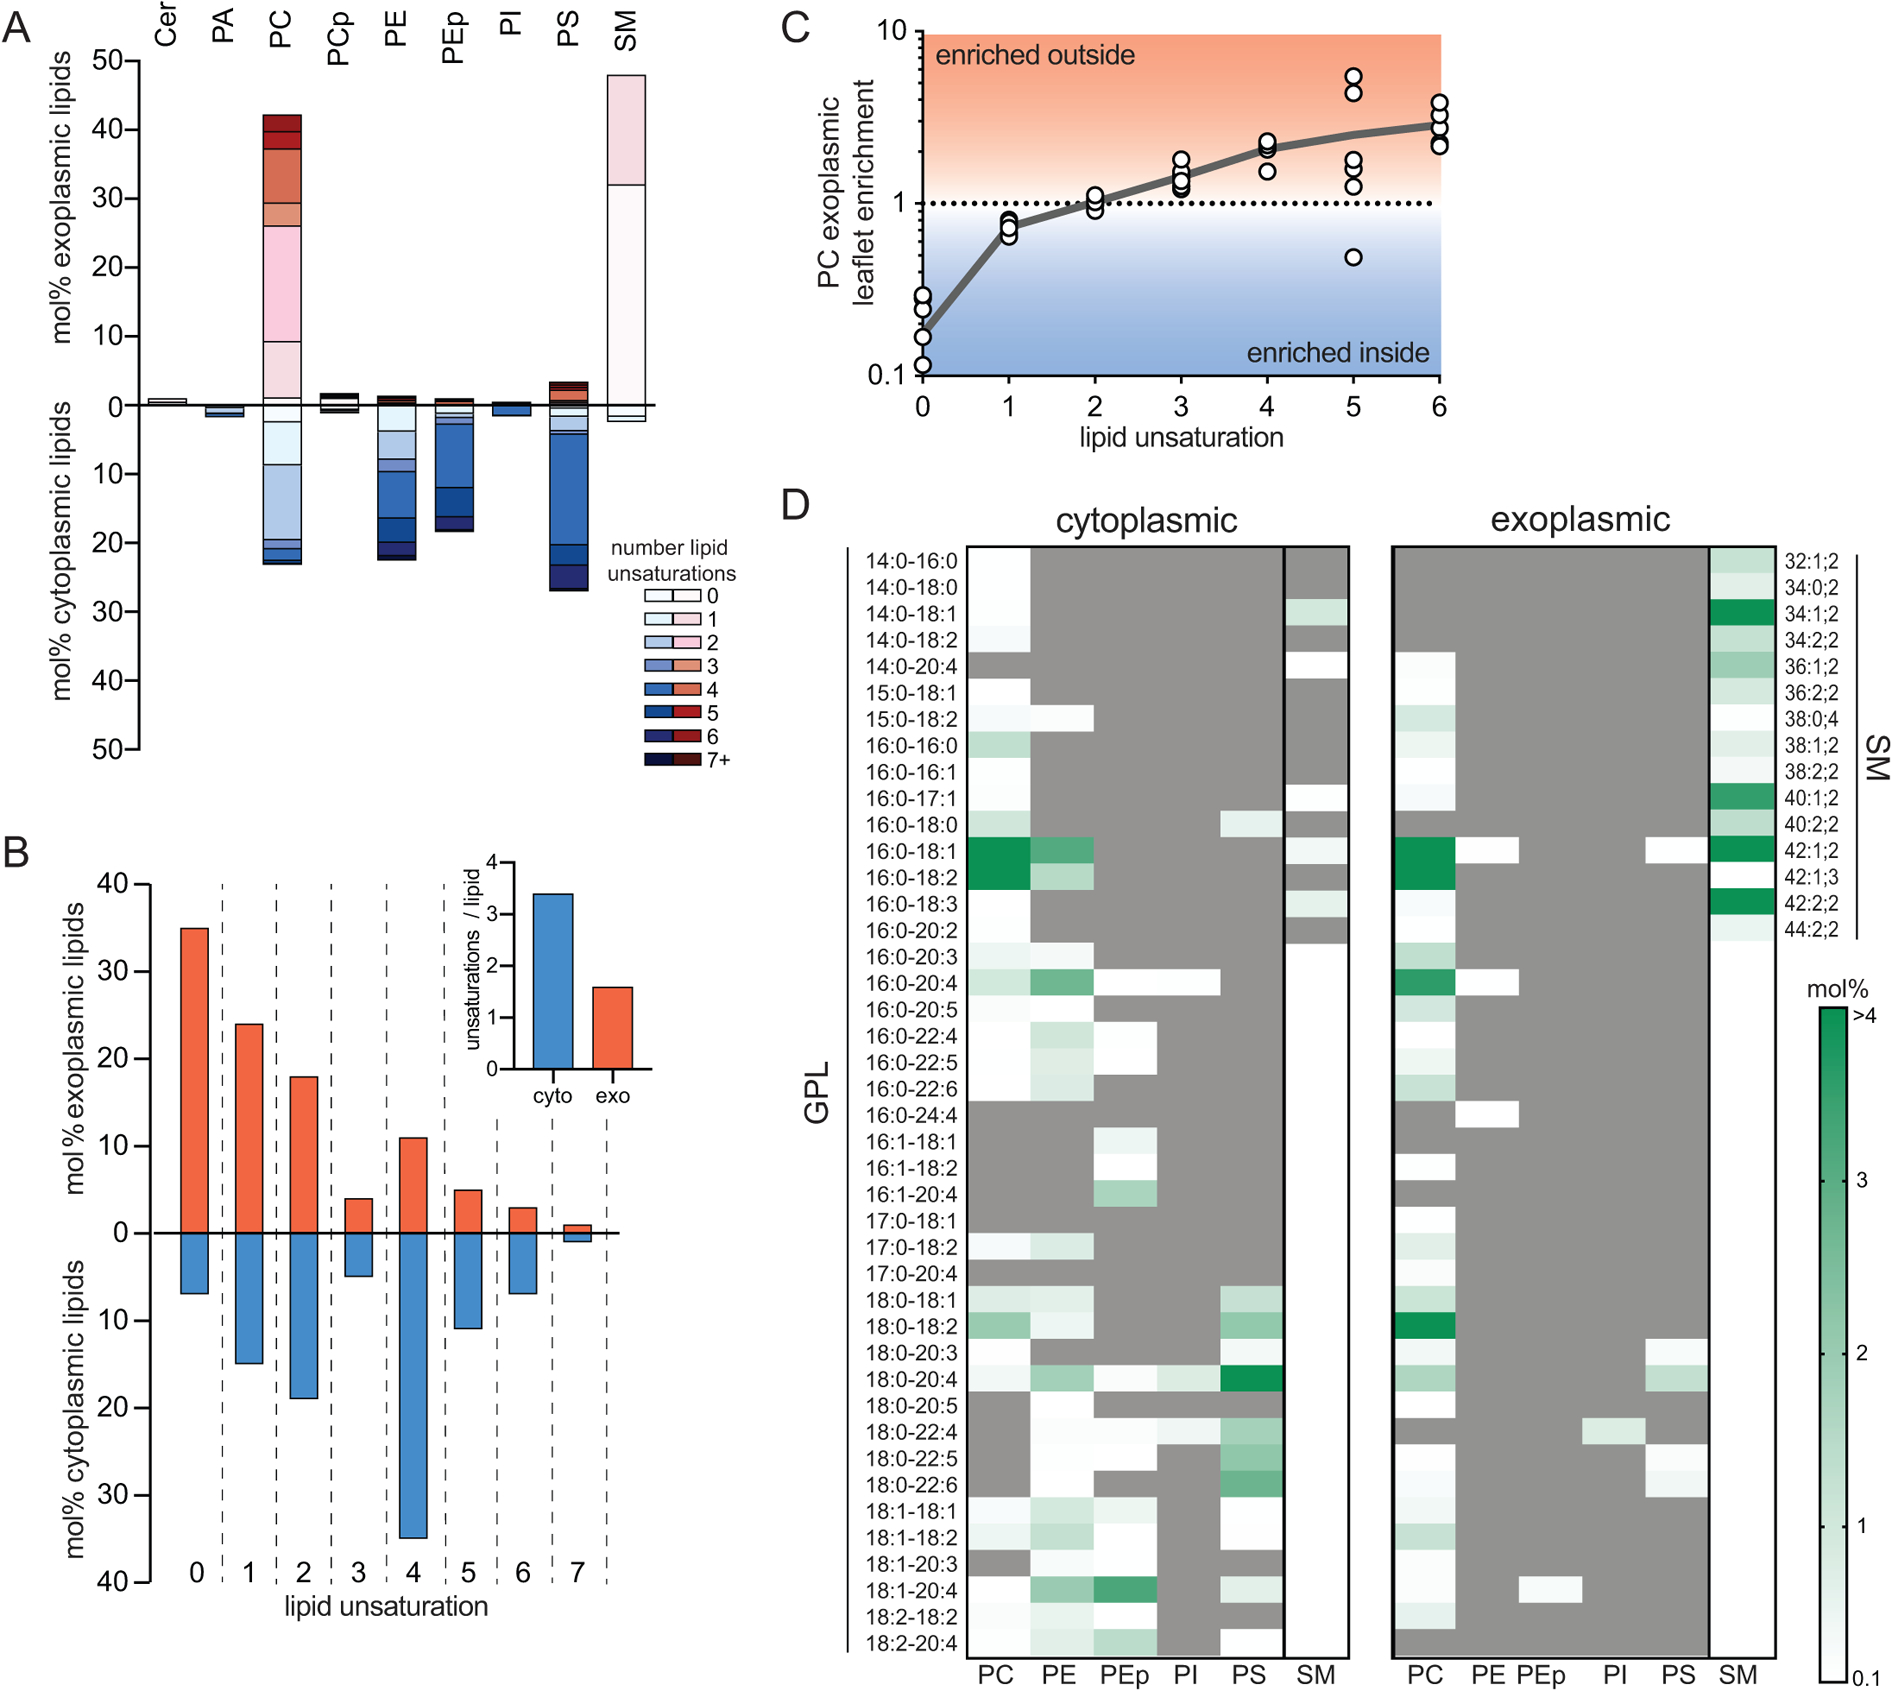
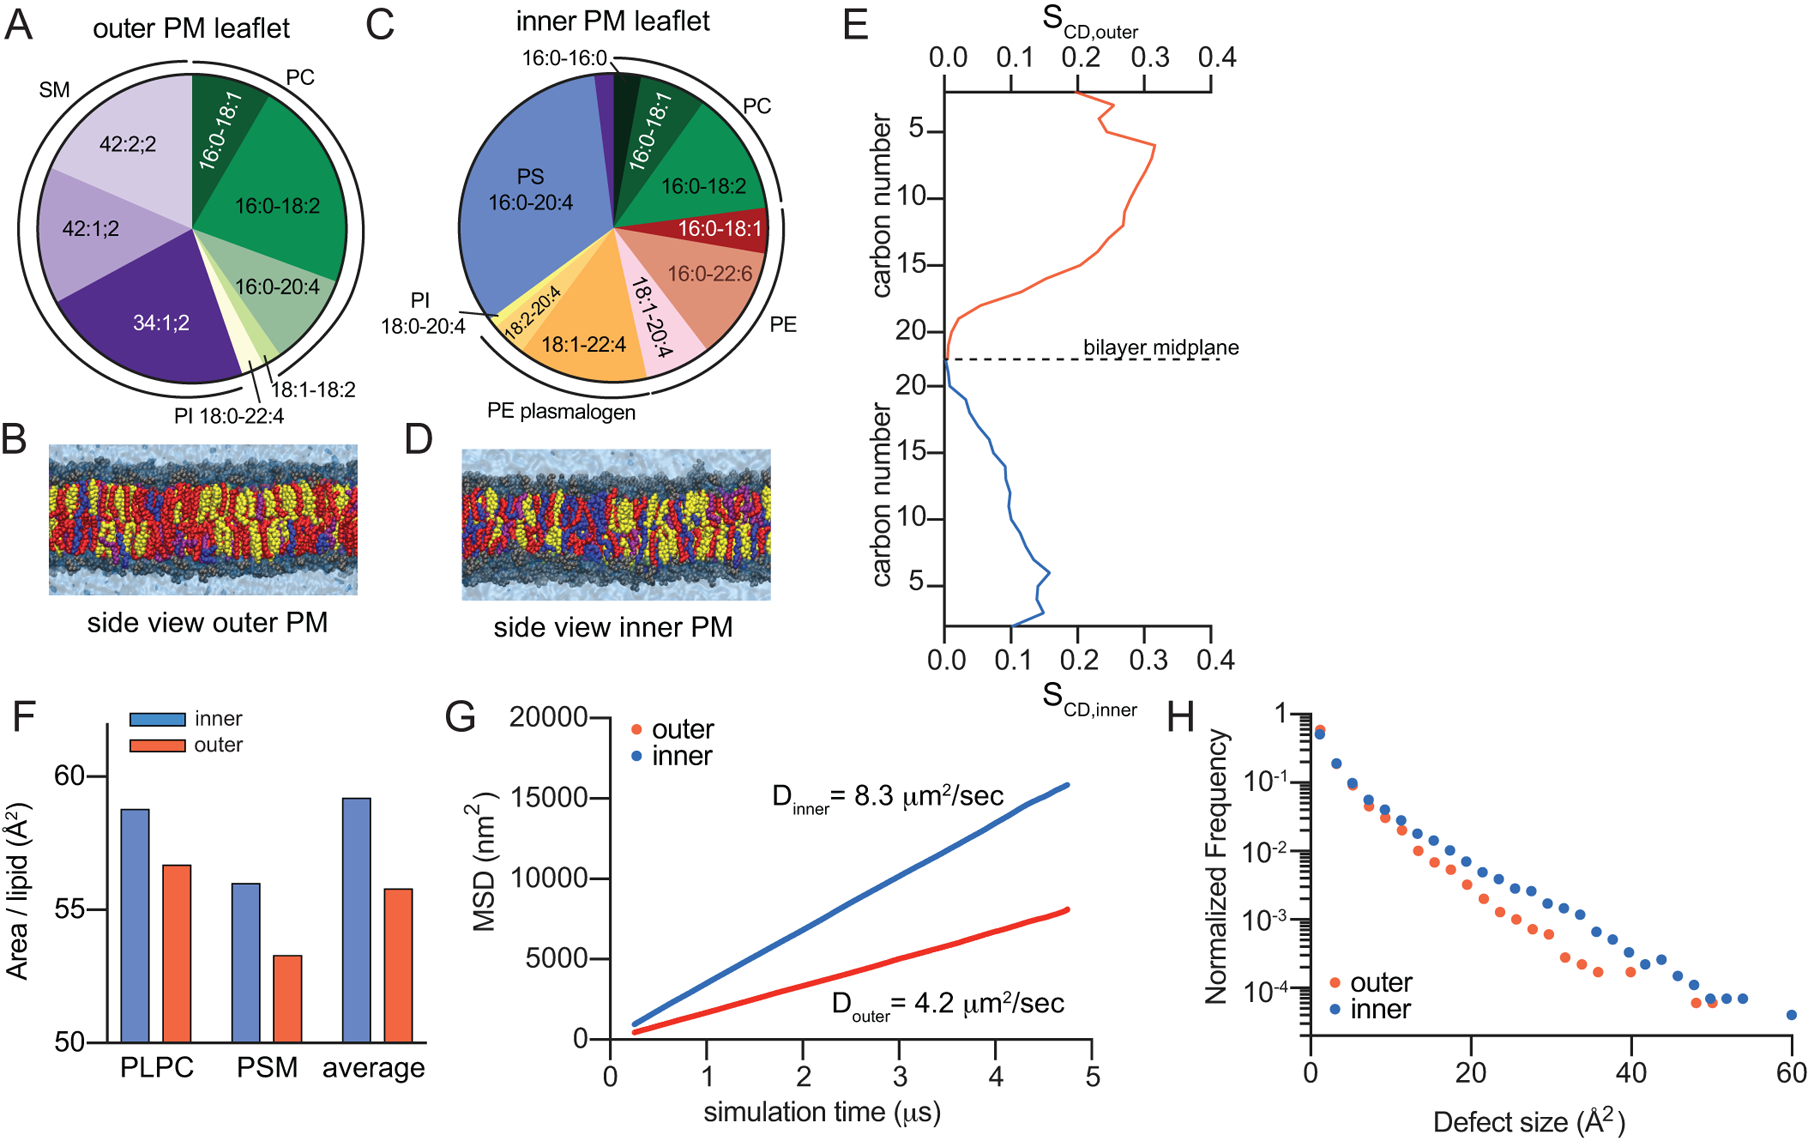
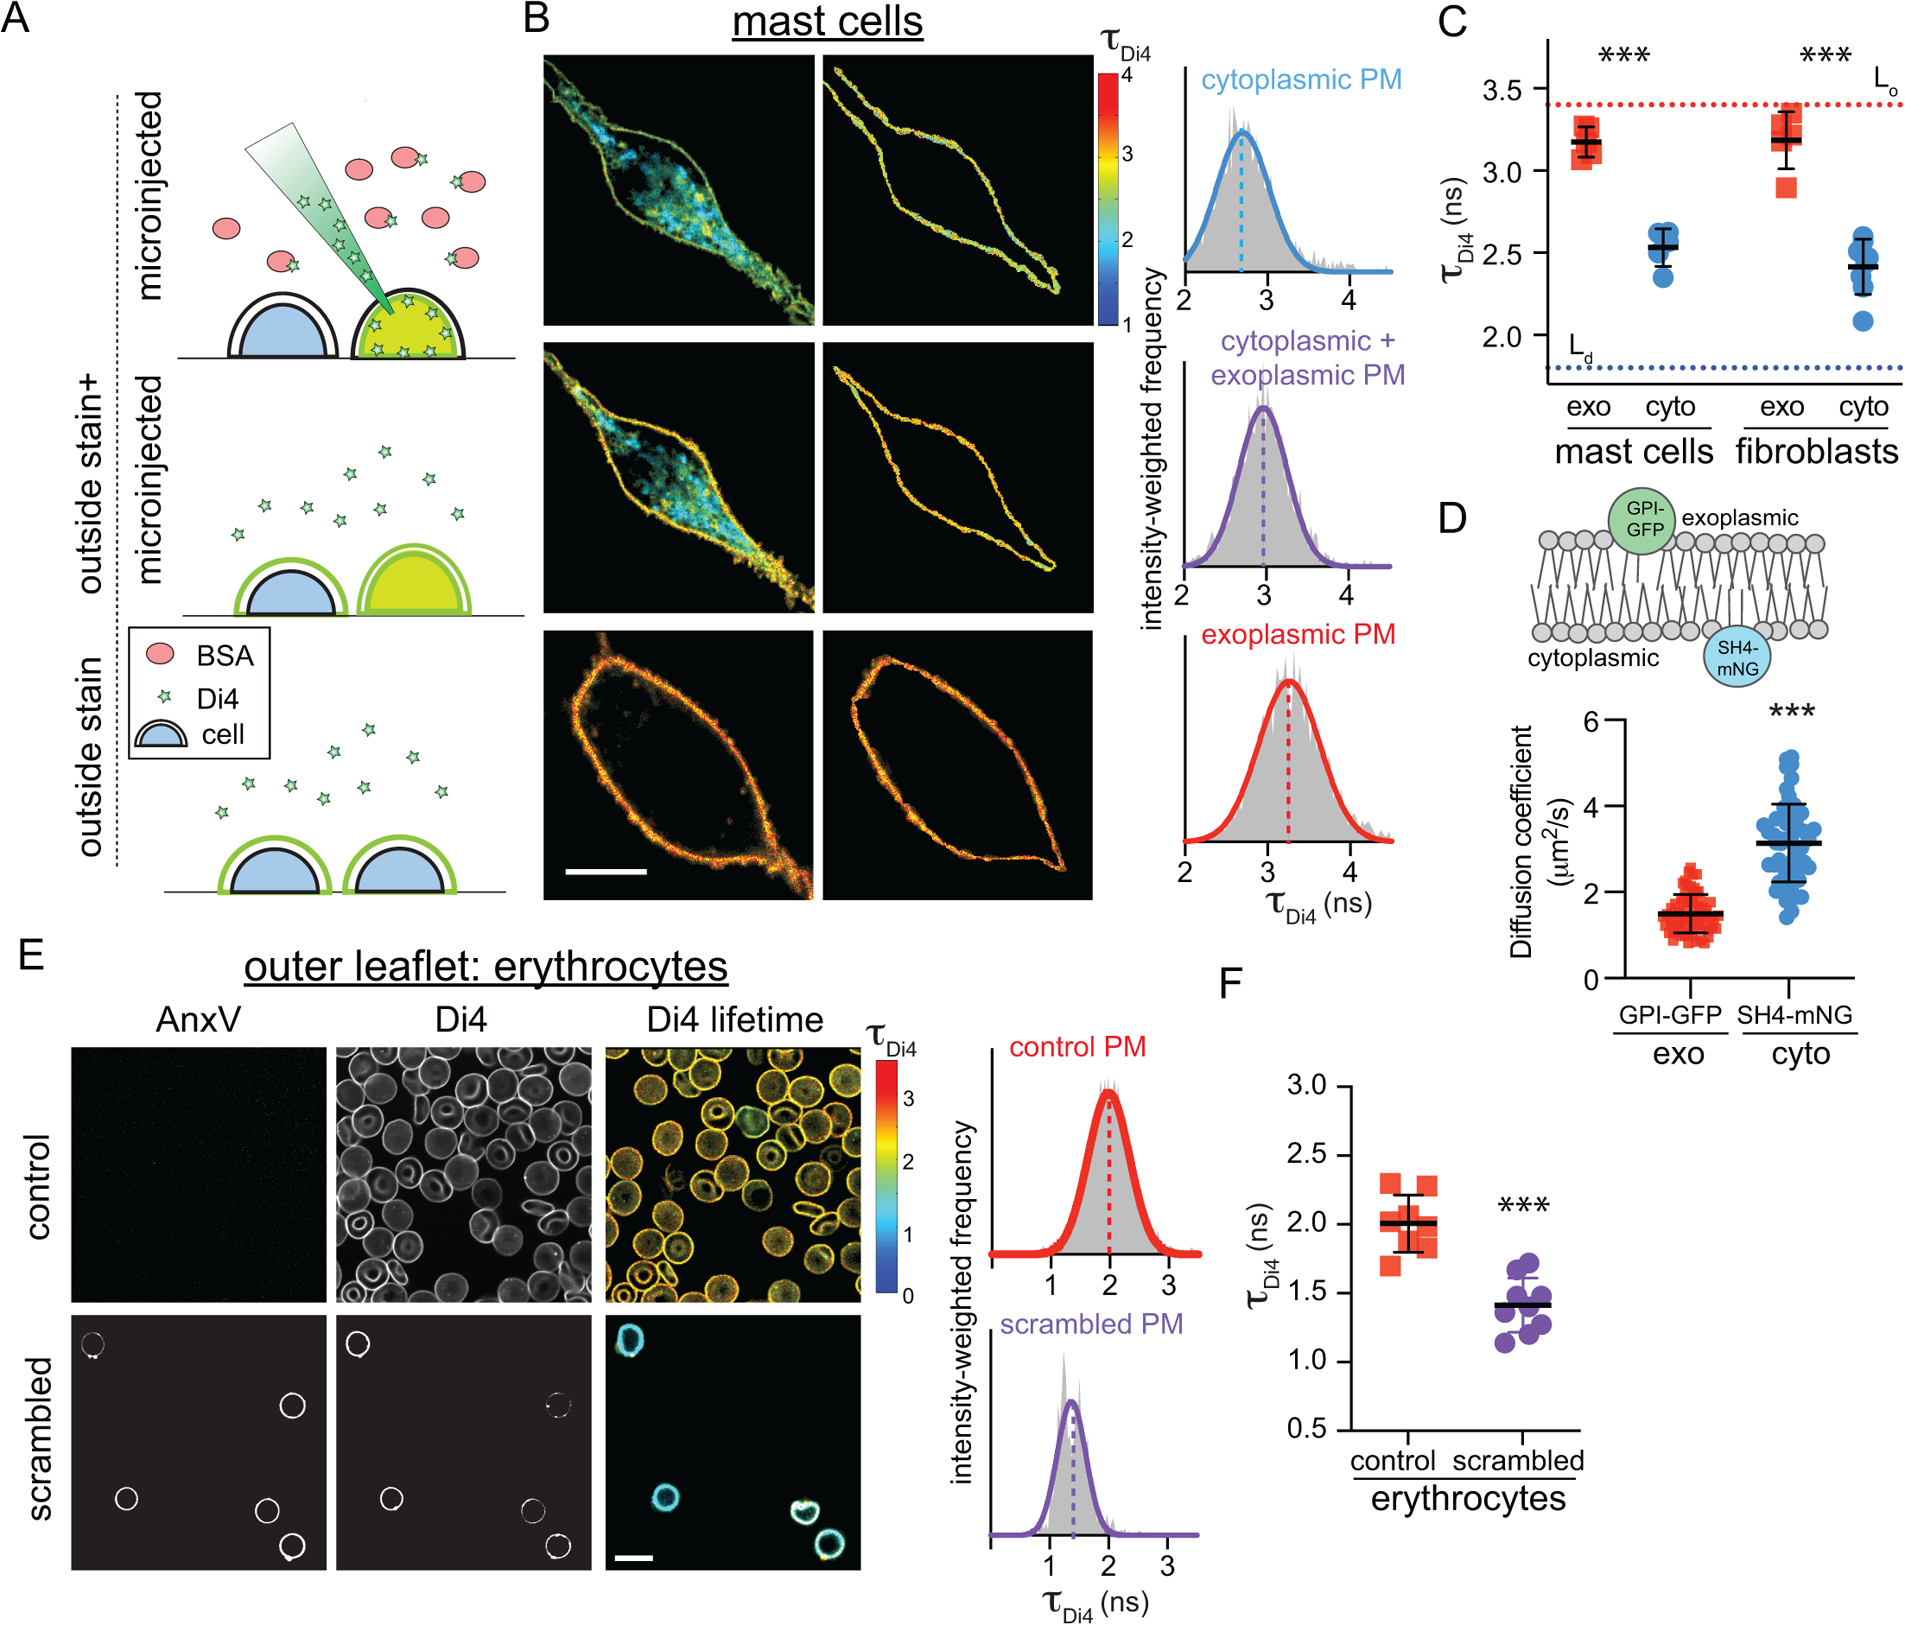
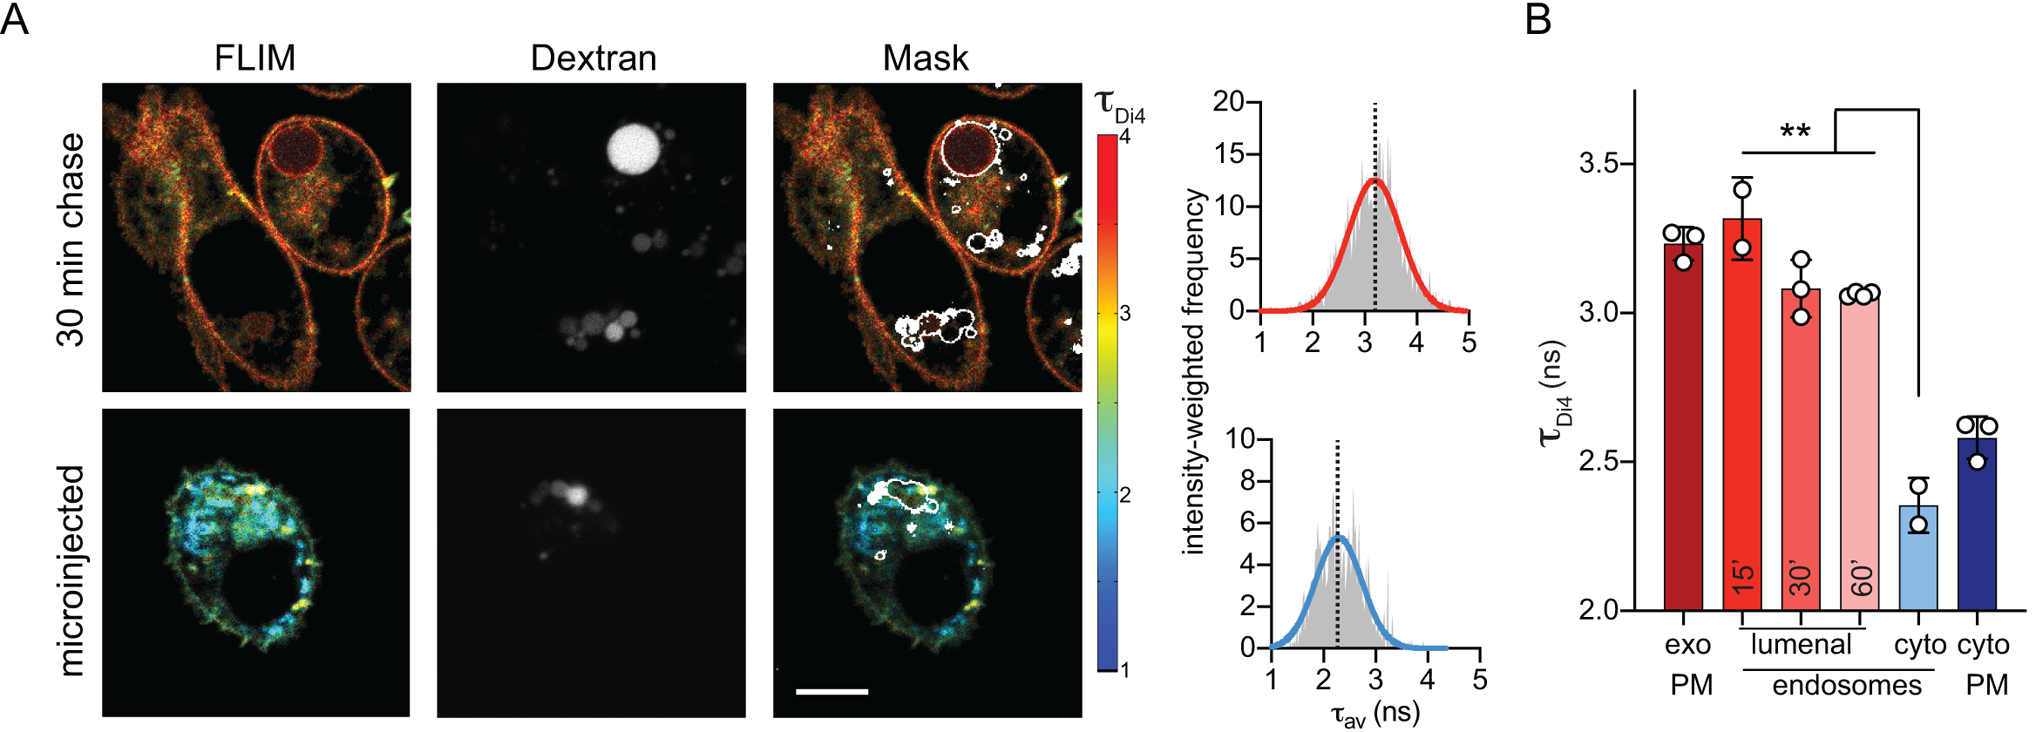
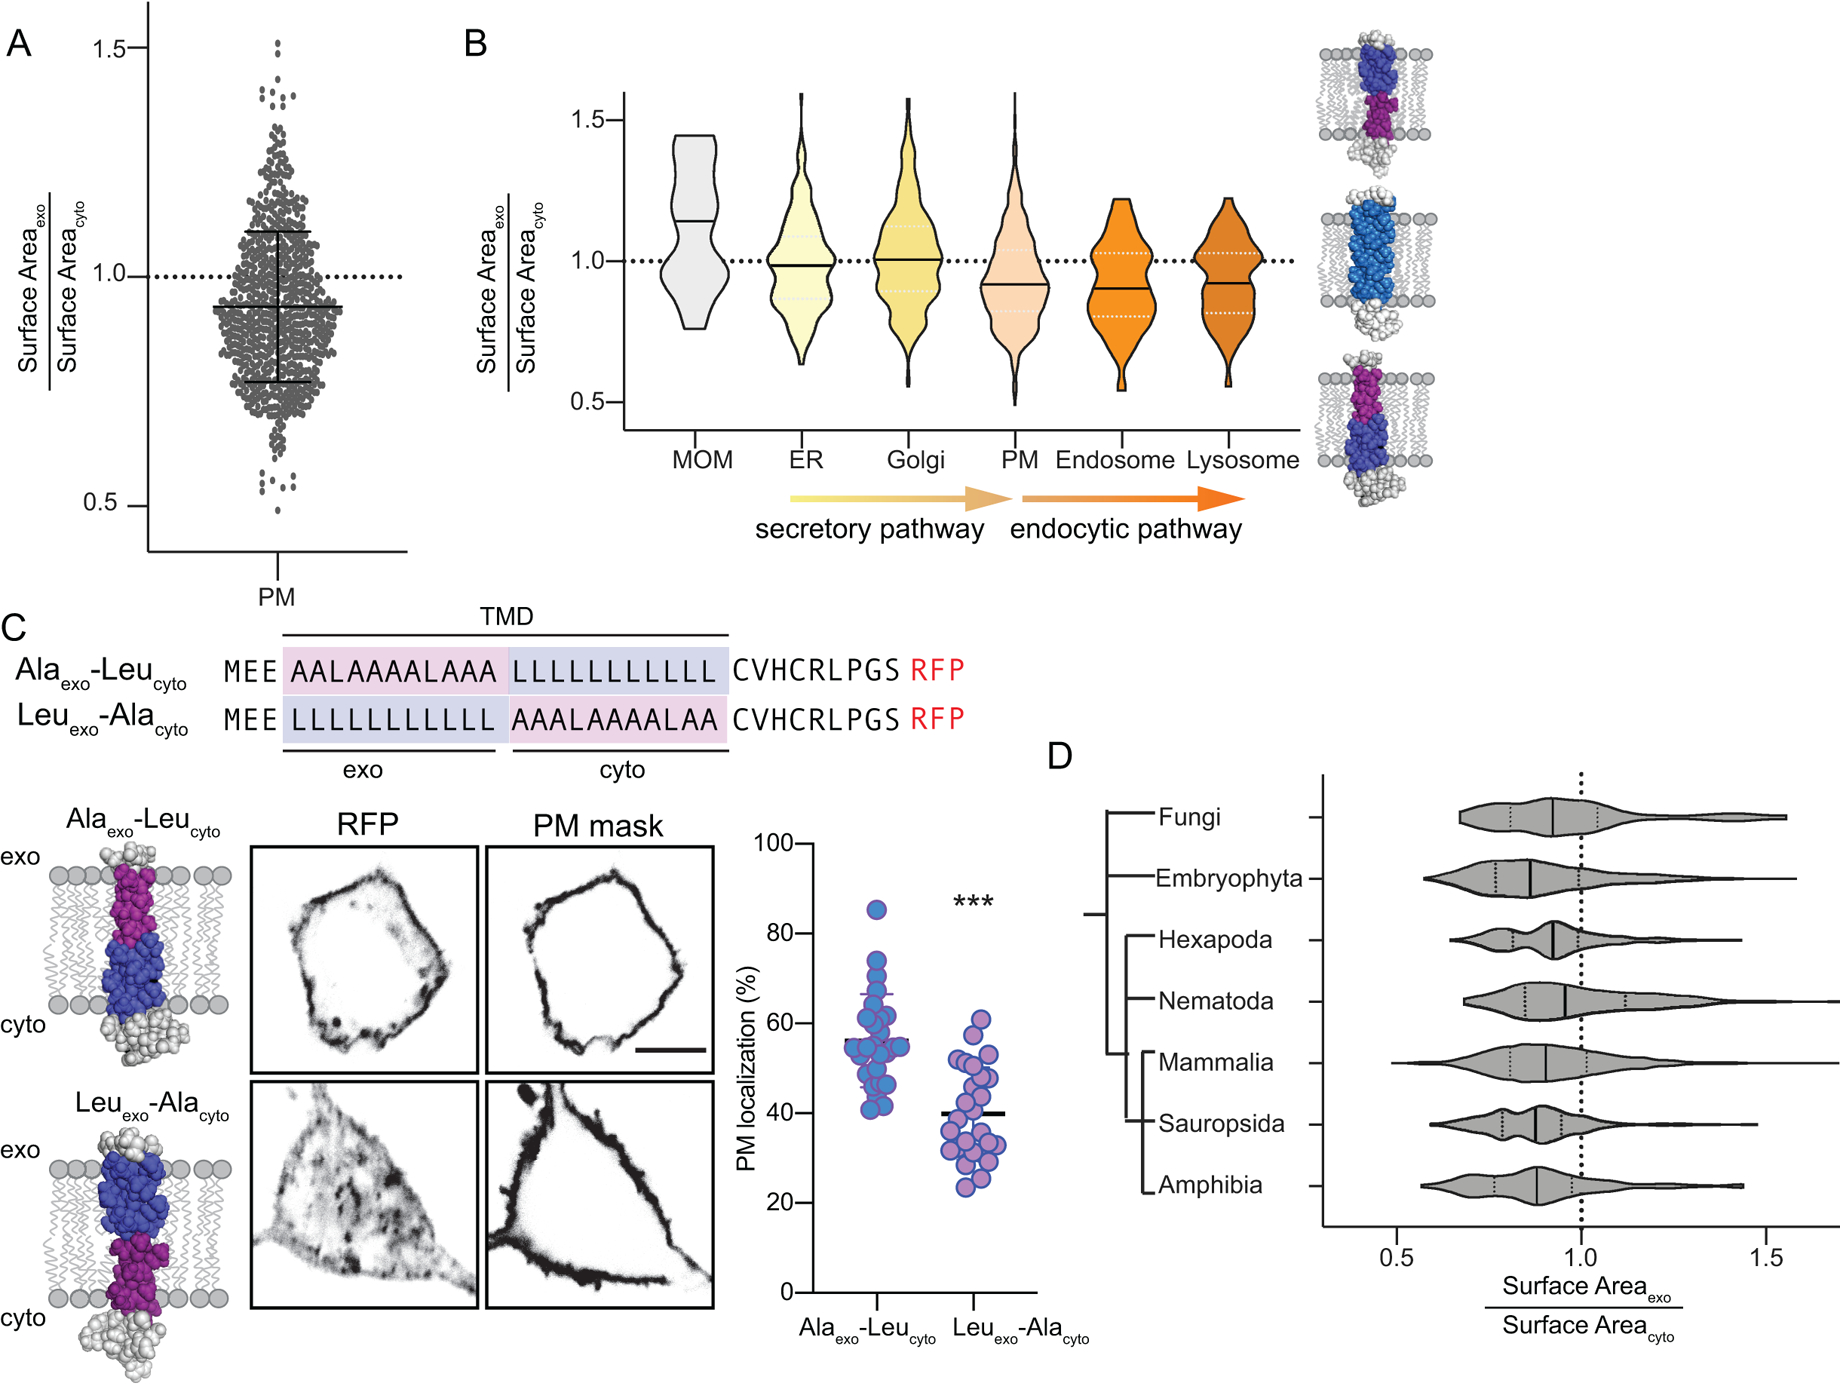
A fundamental feature of cellular plasma membranes (PMs) is an asymmetric lipid distribution between the bilayer leaflets. However, neither the detailed, comprehensive compositions of individual PM leaflets nor how these contribute to structural membrane asymmetries have been defined. We report the distinct lipidomes and biophysical properties of both monolayers in living mammalian PMs. Phospholipid unsaturation is dramatically asymmetric, with the cytoplasmic leaflet being approximately twofold more unsaturated than the exoplasmic leaflet. Atomistic simulations and spectroscopy of leaflet-selective fluorescent probes reveal that the outer PM leaflet is more packed and less diffusive than the inner leaflet, with this biophysical asymmetry maintained in the endocytic system. The structural asymmetry of the PM is reflected in the asymmetric structures of protein transmembrane domains. These structural asymmetries are conserved throughout Eukaryota, suggesting fundamental cellular design principles.


Conflict of interest statement

COMPETING FINANCIAL INTERESTS

None of the authors have competing interests.

Figures

Fig 1 -
Fig 1 -. Lipidomic asymmetry of erythrocyte PMs.
(A) Phospholipid compositions of exo- (red) and cytoplasmic (blue) PM leaflets as defined by enzymatic digestion and mass spectrometry. The exoplasmic leaflet is almost exclusively composed of PC and SM; the inner leaflet is approximately equimolar between PC, PE, PS, and PEp (plasmalogen). (B) Leaflet asymmetry of acyl chain unsaturation. The plurality of phospholipids in the outer leaflet are fully saturated, whereas the majority of the cytoplasmic leaflet is polyunsaturated. (inset) Abundance-weighted average unsaturation is ~2-fold greater for inner leaflet phospholipids. (C) Asymmetry of acyl chain saturation for PC species. Fully saturated acyl chains are highly enriched in the inner leaflet PC, and there is a general correlation between outer leaflet enrichment of PC species and the extent of unsaturation. Data in D are mean ± SD of 7 independent samples. Pearson correlation calculated to be r=0.997 for unsaturation compared to exoplasmic leaflet enrichment. (D) Lipidomic bar codes of the inner and outer PM leaflets. Shown in white-green scale are all lipid species (GPL = glycerophospholipid, SM = sphingomyelin) comprising <0.1 mol% of lipids with mol% encoded in green intensity (darkest = most abundant). Gray are species below the 0.1 mol% threshold (including not detected).
Fig 2 –
Fig 2 –. Atomistic simulation of biophysical asymmetry of erythrocytes PM.
(A&C) Compiled compositions of outer (exoplasmic; A) and inner (cytoplasmic; C) PM leaflets from lipidomics. Below are final snapshots of outer-leaflet (B) and inner-PM leaflet (D) mimetic simulations (yellow = cholesterol, red = saturated acyl chains, purple = mono- and di-unsaturated, blue = polyunsaturated). (E) Concentration-weighted average order parameters for lipids in the outer versus inner leaflet simulation suggest a more ordered outer leaflet. (F) Slope of average MSD over time reveals ~2-fold slower diffusivity of the simulated outer leaflet. (G) Histogram of hydrophobic defects reveals more abundant large defects in the simulated inner leaflet. (H) Area/phospholipid for PLPC and PSM (the two lipids shared between both simulations) and the abundance-weighted average phospholipid.
Figure 3 –
Figure 3 –. Biophysical asymmetry of the PM.
(A) Microinjection of Di4 in presence of BSA stains only the cytoplasmic PM leaflet (microinjected). Subsequent addition of Di4 to the outside stains both membrane leaflets (outside stain + microinjected). Staining from the outside labels only the outer PM monolayer (outside stain). Exemplary FLIM images of (B) RBL mast cells showing (left) whole cells, (middle) PM masks, and (right) intensity-weighted histograms of the PM mask from n ≥ 3 independent experiments. (C) Average Di4 lifetime in exoplasmic (red) versus cytoplasmic (blue) PM leaflets. Dotted lines represent Di4 lifetime in Lo and Ld phases in GUVs. Corroborating measurements of Di4 emission wavelength shifts are shown in Supplementary Fig 11. (D) Diffusion coefficients measured by FCS of exoplasmically anchored GPI-GFP (red) versus cytoplasmically anchored SH4-mNG (blue) (E) AnxV staining for exoplasmic PS (left), Di4 intensity and lifetime (middle), and lifetime histogram (right), in control versus PMA-scrambled erythrocytes stained from the outside with Di4. PMA-induced scrambling induces PS exposure (AnxV binding) and reduces the packing of the outer leaflet. (F) Average Di4 lifetime in untreated (red) versus scrambled (purple) PM outer leaflets in erythrocytes. Data points in C and F represent averages of individual experiments, with 5–10 cells/experiment. Mean ± SD shown; ***p<0.001 for Sidak’s multiple comparison test. Points in E represent individual cells, with the mean ± SD shown; ***p<0.001 for unpaired two-tailed t-test. All data are representative of >3 independent experiments.
Figure 4 –
Figure 4 –. Asymmetry of membrane packing through the endocytic pathway.
(A) Exemplary FLIM images of Di4 lifetime and dextran fluorescence in RBL cells following 30 min incubation to “chase” stains into endosomes. The accumulation of dextran (middle) is used to create an endosomal membrane mask (right images) to derive intensity-weighted histograms of τDi4 (right). (B) The high lifetime (i.e. lipid packing) of the exoplasmic PM leaflet is maintained in the lumenal leaflets of endosomes, even up to 60 min after endocytosis. Images and quantifications of 3T3 cells are shown in Supplementary Fig. 12. Mean ± SD of >10 individual cells; ***p<0.001 for unpaired t-test. Representative of at least 3 independent experiments.
Fig 5 –
Fig 5 –. Structural asymmetry in PM protein TMDs is related to subcellular localization.
(A) Asymmetry of single-pass transmembrane domain surface area between exoplasmic and cytoplasmic halves of human PM proteins. Shown are all annotated PM-resident, single-pass proteins in the human proteome (mean ± SD overlaid). (B) Violin plots demonstrating the distributions of relative exoplasmic / cytoplasmic surface areas for single-pass TMDs in various organelles. PM, endosomal, and lysosomal proteins are asymmetric with smaller exoplasmic halves, whereas ER and Golgi proteins are on average symmetric (MOM = mitochondrial outer membrane). Median and quartiles are shown. (C) Subcellular localization of model TMDs that match (Alaexo-Leucyto) or counter (Leuexo-Alacyto) the biophysical asymmetry of the PM. The matching TMD localizes efficiently at the PM, whereas the countering TMD is largely intracellular. Mean ± SD of individual cells expressing the TMD construct; ***p<0.001 unpaired two-tailed t-test. (D) Bias towards asymmetric TMDs is observed throughout eukaryote PMs. The phylogenetic dendrogram is intended to show only general evolutionary relationships. Median and quartiles are shown.

Comment in

  • Asymmetry across the membrane.
    Makarova M, Owen DM. Makarova M, et al. Nat Chem Biol. 2020 Jun;16(6):605-606. doi: 10.1038/s41589-020-0545-6. Nat Chem Biol. 2020. PMID: 32367016 No abstract available.

References

    1. Devaux PF Static and dynamic lipid asymmetry in cell membranes. Biochemistry 30, 1163–1173 (1991). - PubMed
    1. Op den Kamp JA Lipid asymmetry in membranes. Annu Rev Biochem 48, 47–71, doi: 10.1146/annurev.bi.48.070179.000403 (1979). - DOI - PubMed
    1. Verkleij AJ et al. The asymmetric distribution of phospholipids in the human red cell membrane. A combined study using phospholipases and freeze-etch electron microscopy. Biochim Biophys Acta 323, 178–193 (1973). - PubMed
    1. Schick PK, Kurica KB & Chacko GK Location of phosphatidylethanolamine and phosphatidylserine in the human platelet plasma membrane. The Journal of clinical investigation 57, 1221–1226, doi: 10.1172/JCI108390 (1976). - DOI - PMC - PubMed
    1. Sandra A & Pagano RE Phospholipid asymmetry in LM cell plasma membrane derivatives: polar head group and acyl chain distributions. Biochemistry 17, 332–338 (1978). - PubMed

Publication types