. 2020 Jul;21(7):736-745.
doi: 10.1038/s41590-020-0669-6. Epub 2020 May 4.

FDA-approved disulfiram inhibits pyroptosis by blocking gasdermin D pore formation

Affiliations

FDA-approved disulfiram inhibits pyroptosis by blocking gasdermin D pore formation

Jun Jacob Hu et al. Nat Immunol. 2020 Jul.

Abstract

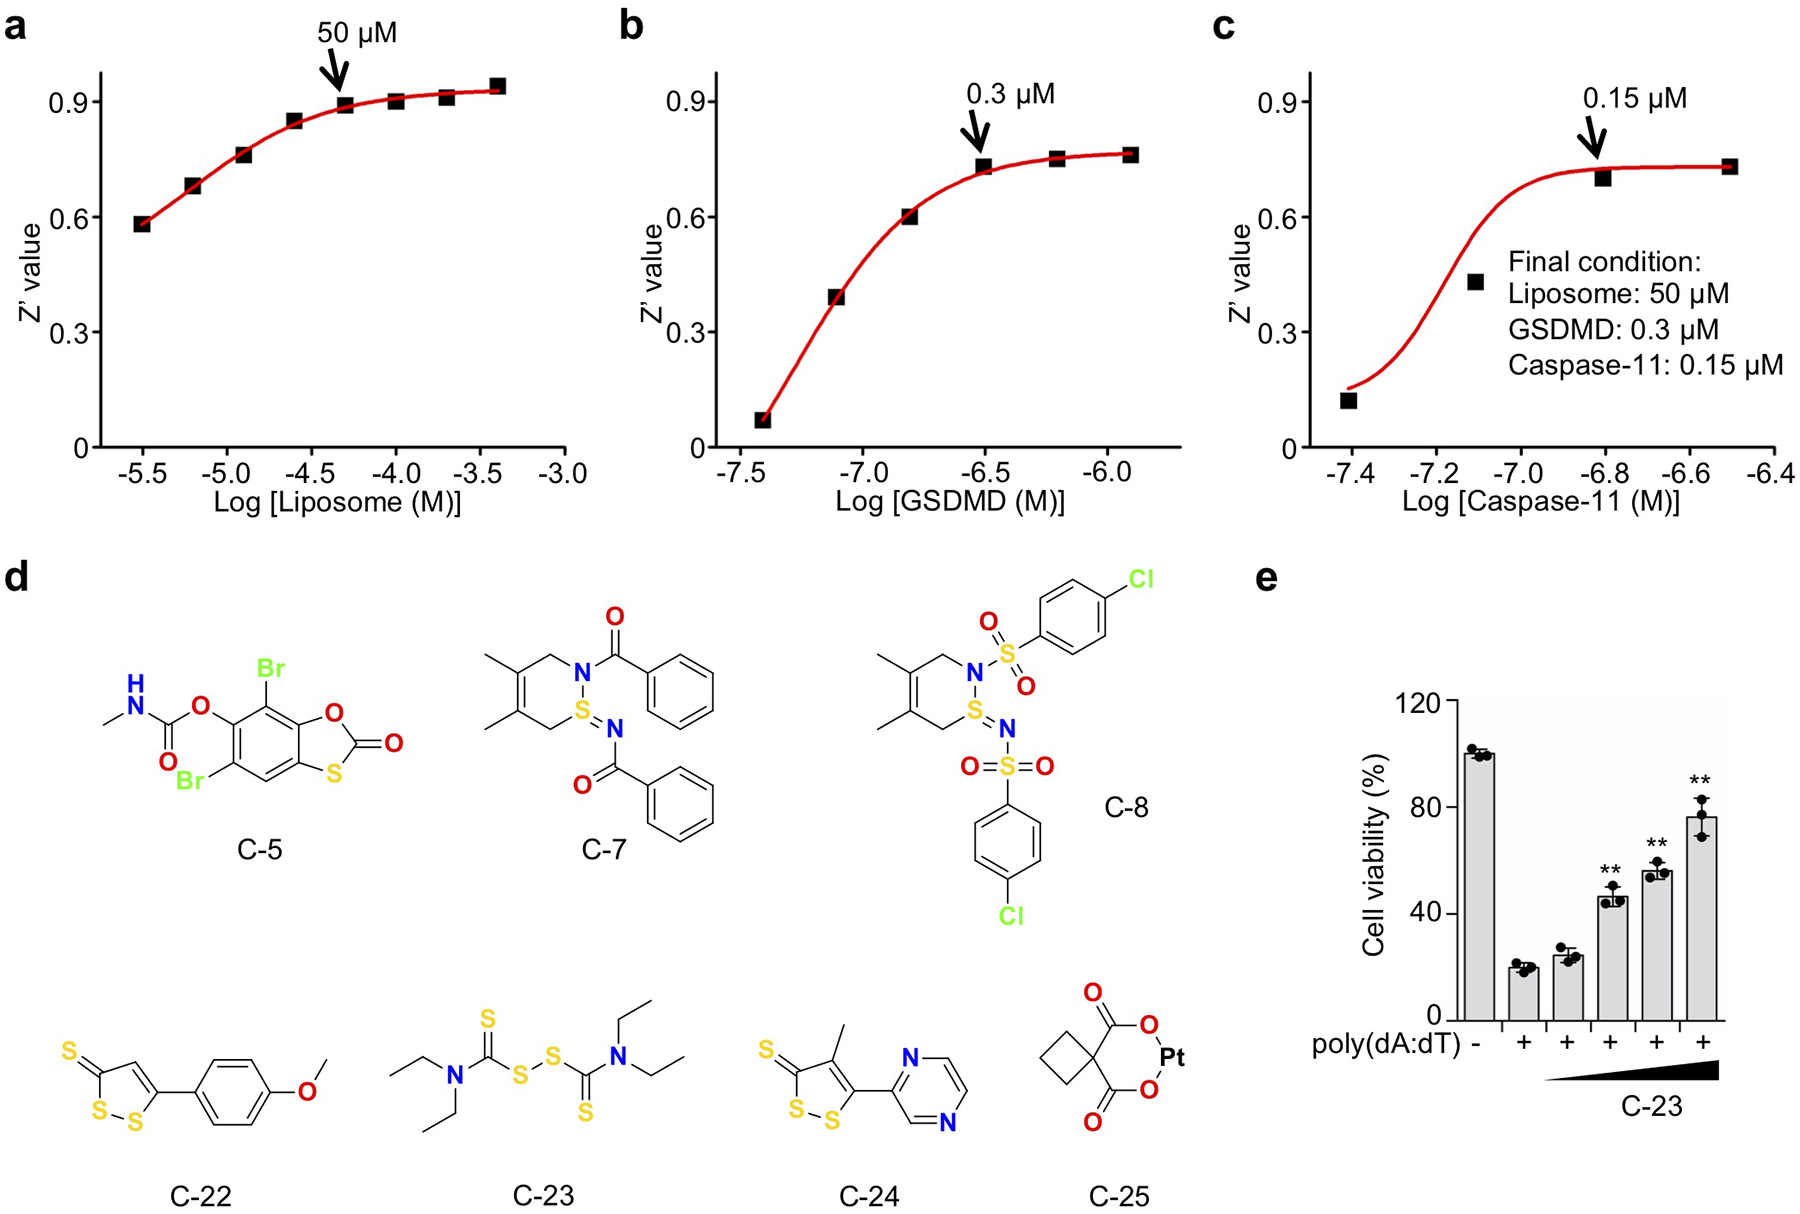
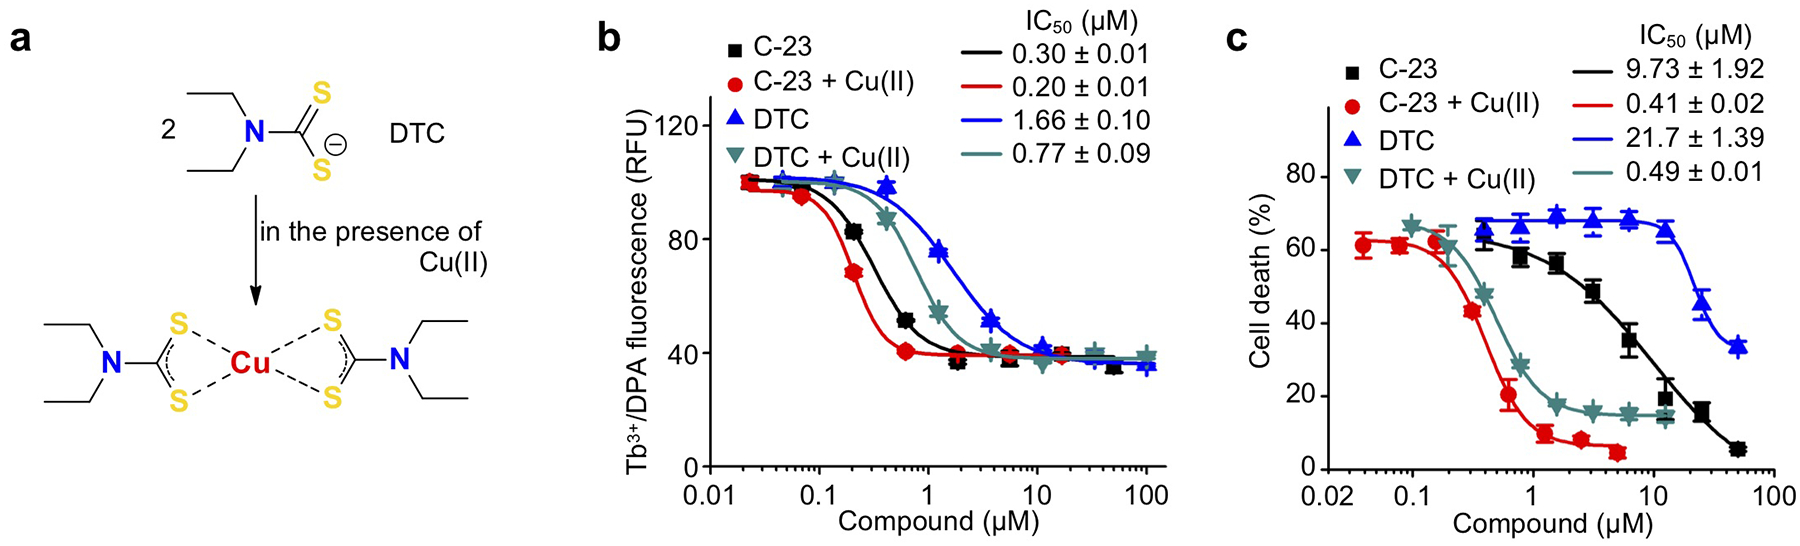
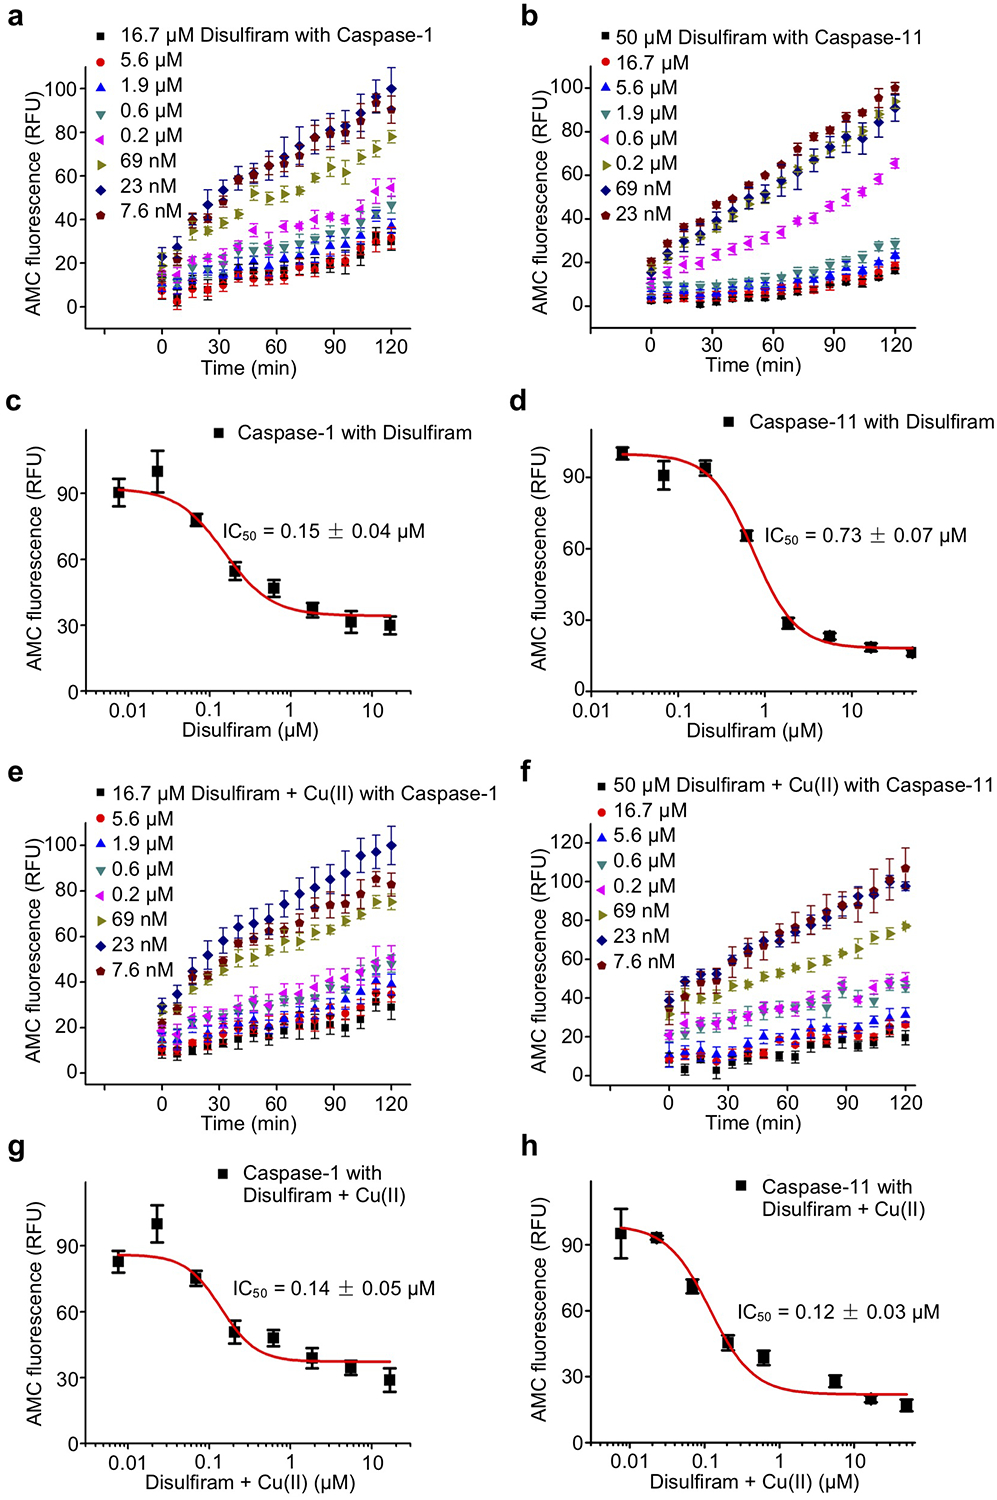
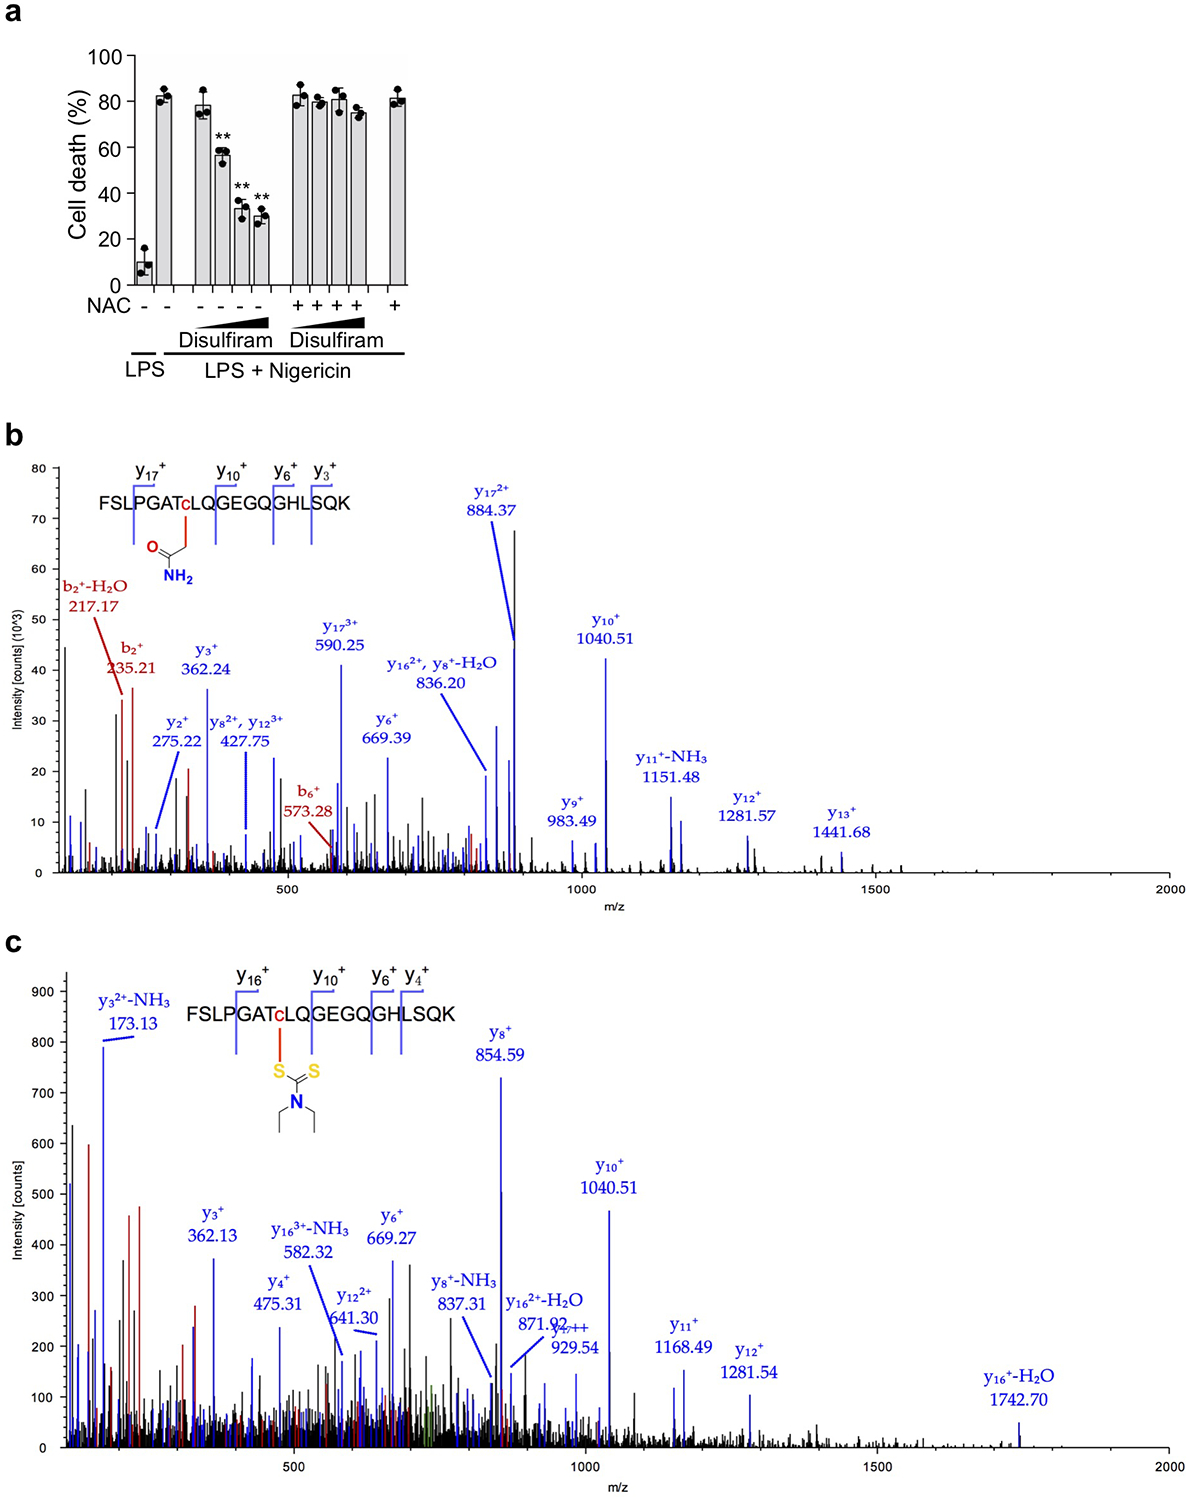
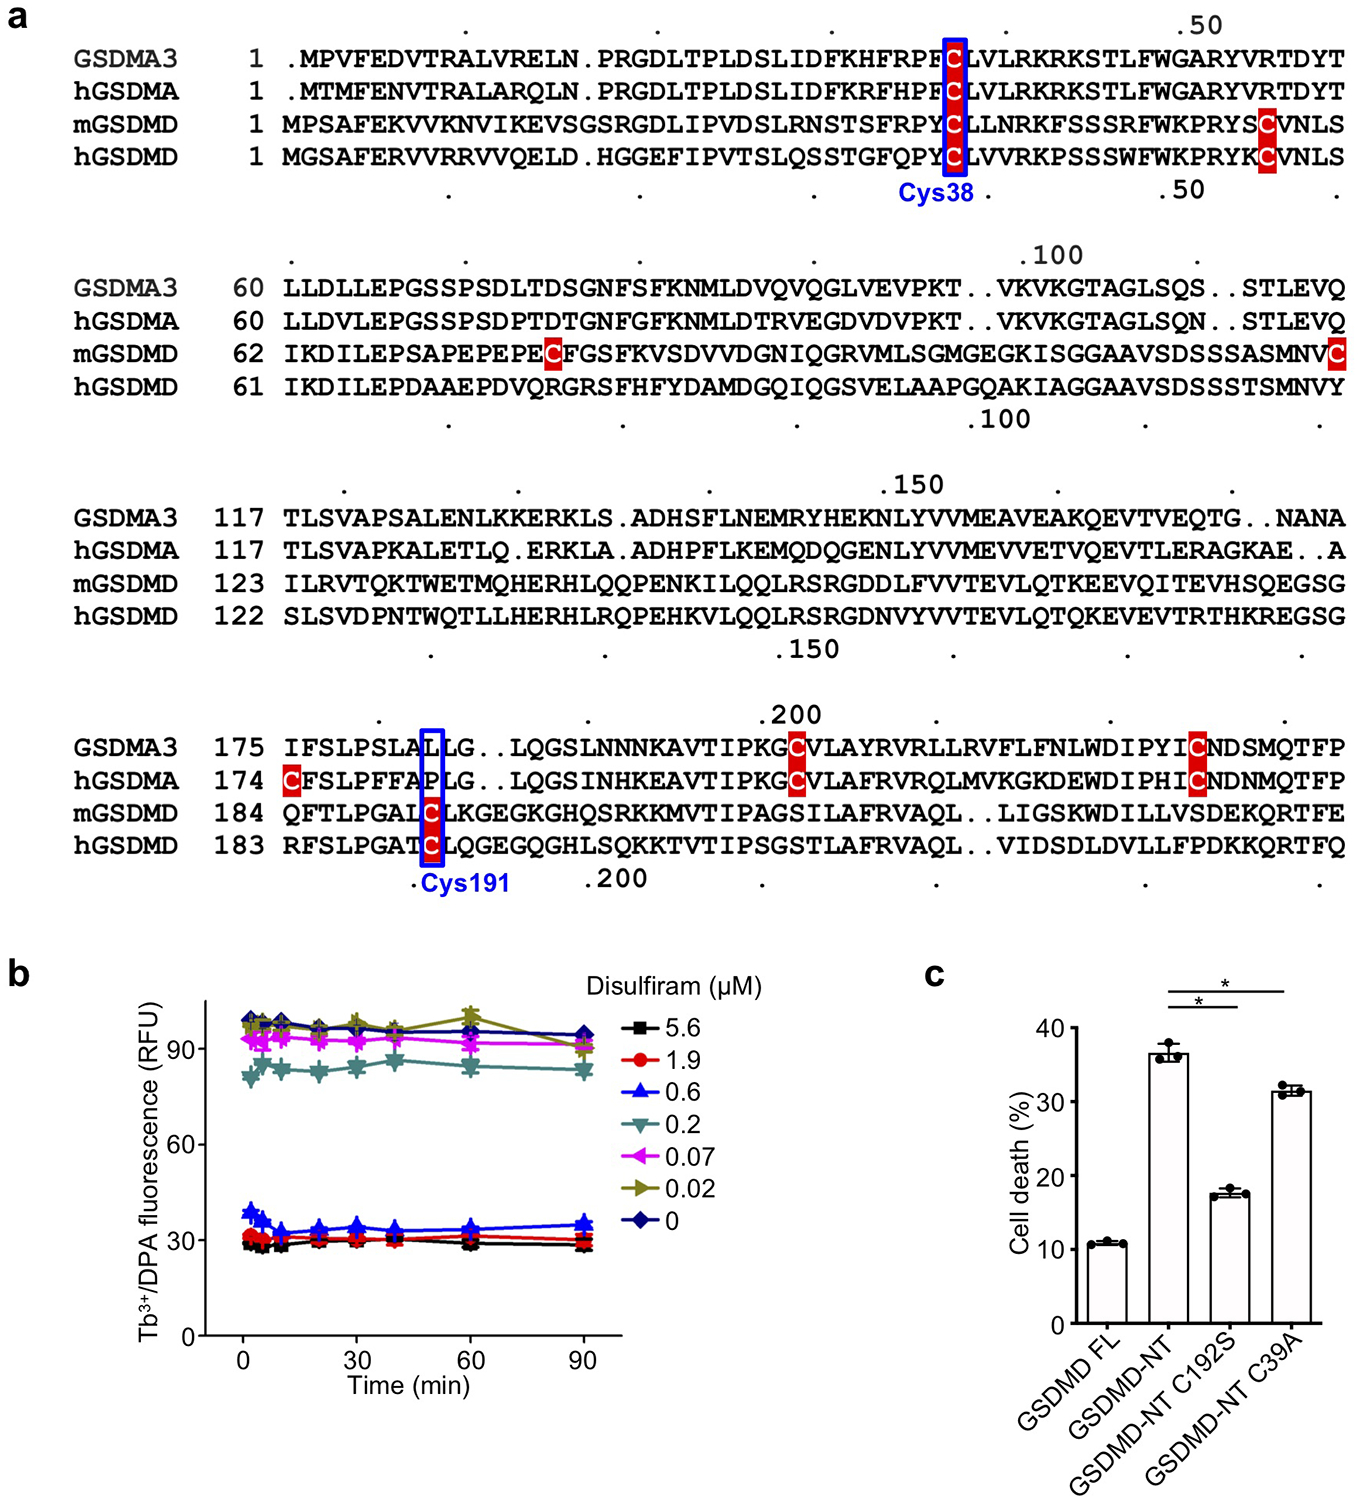
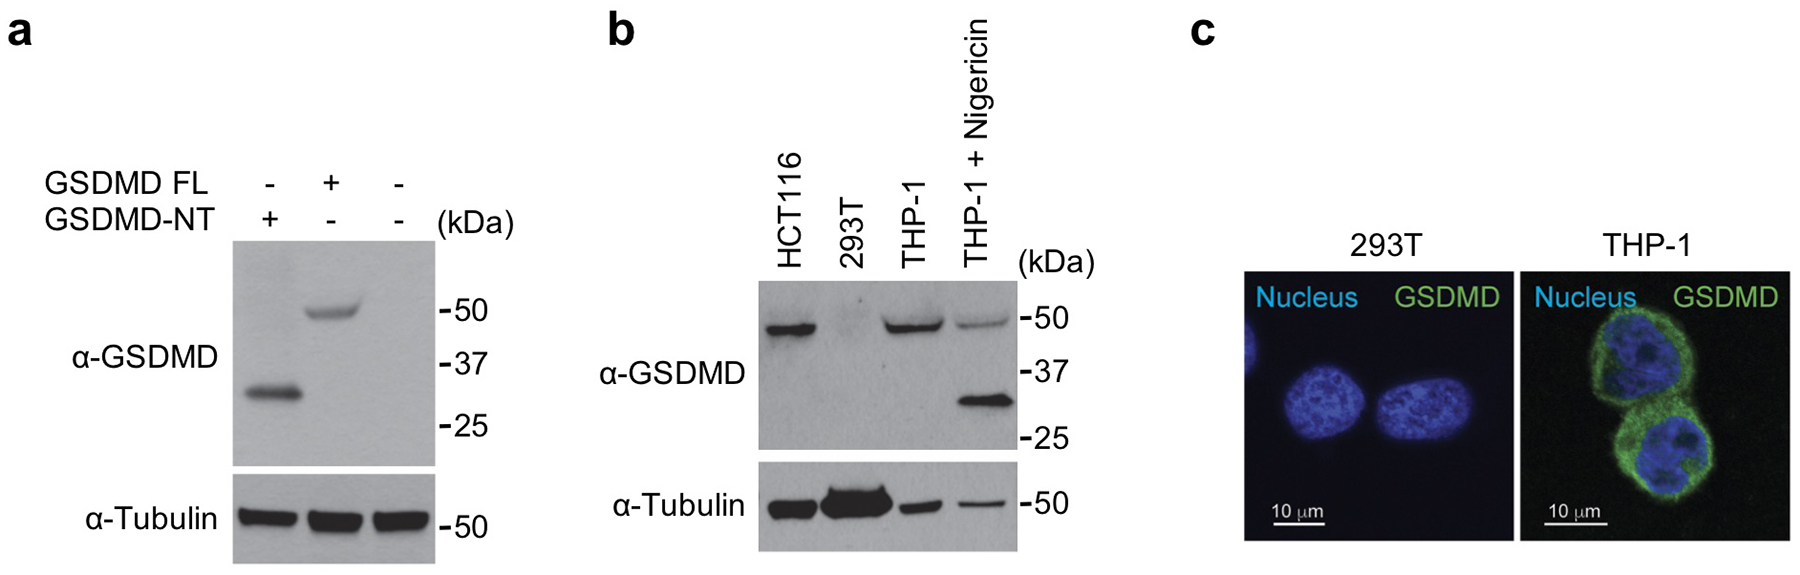
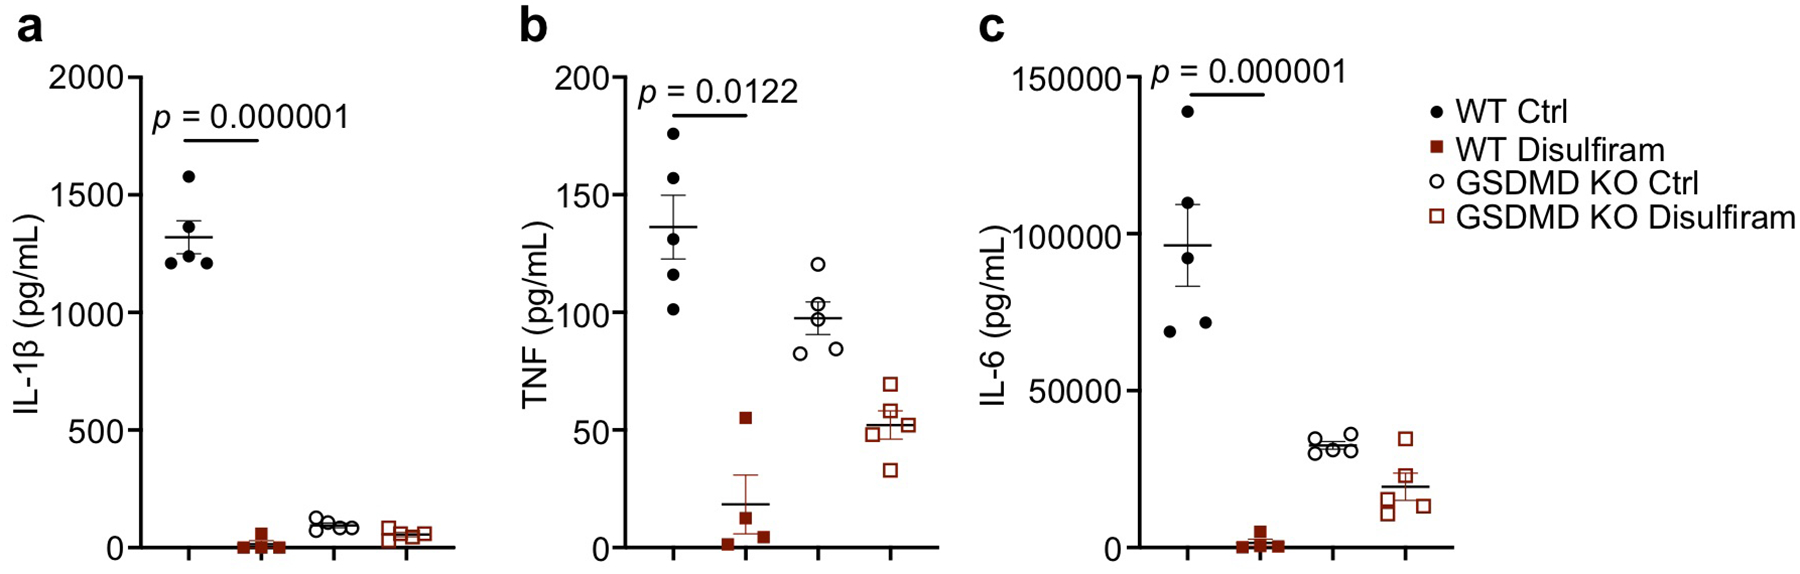
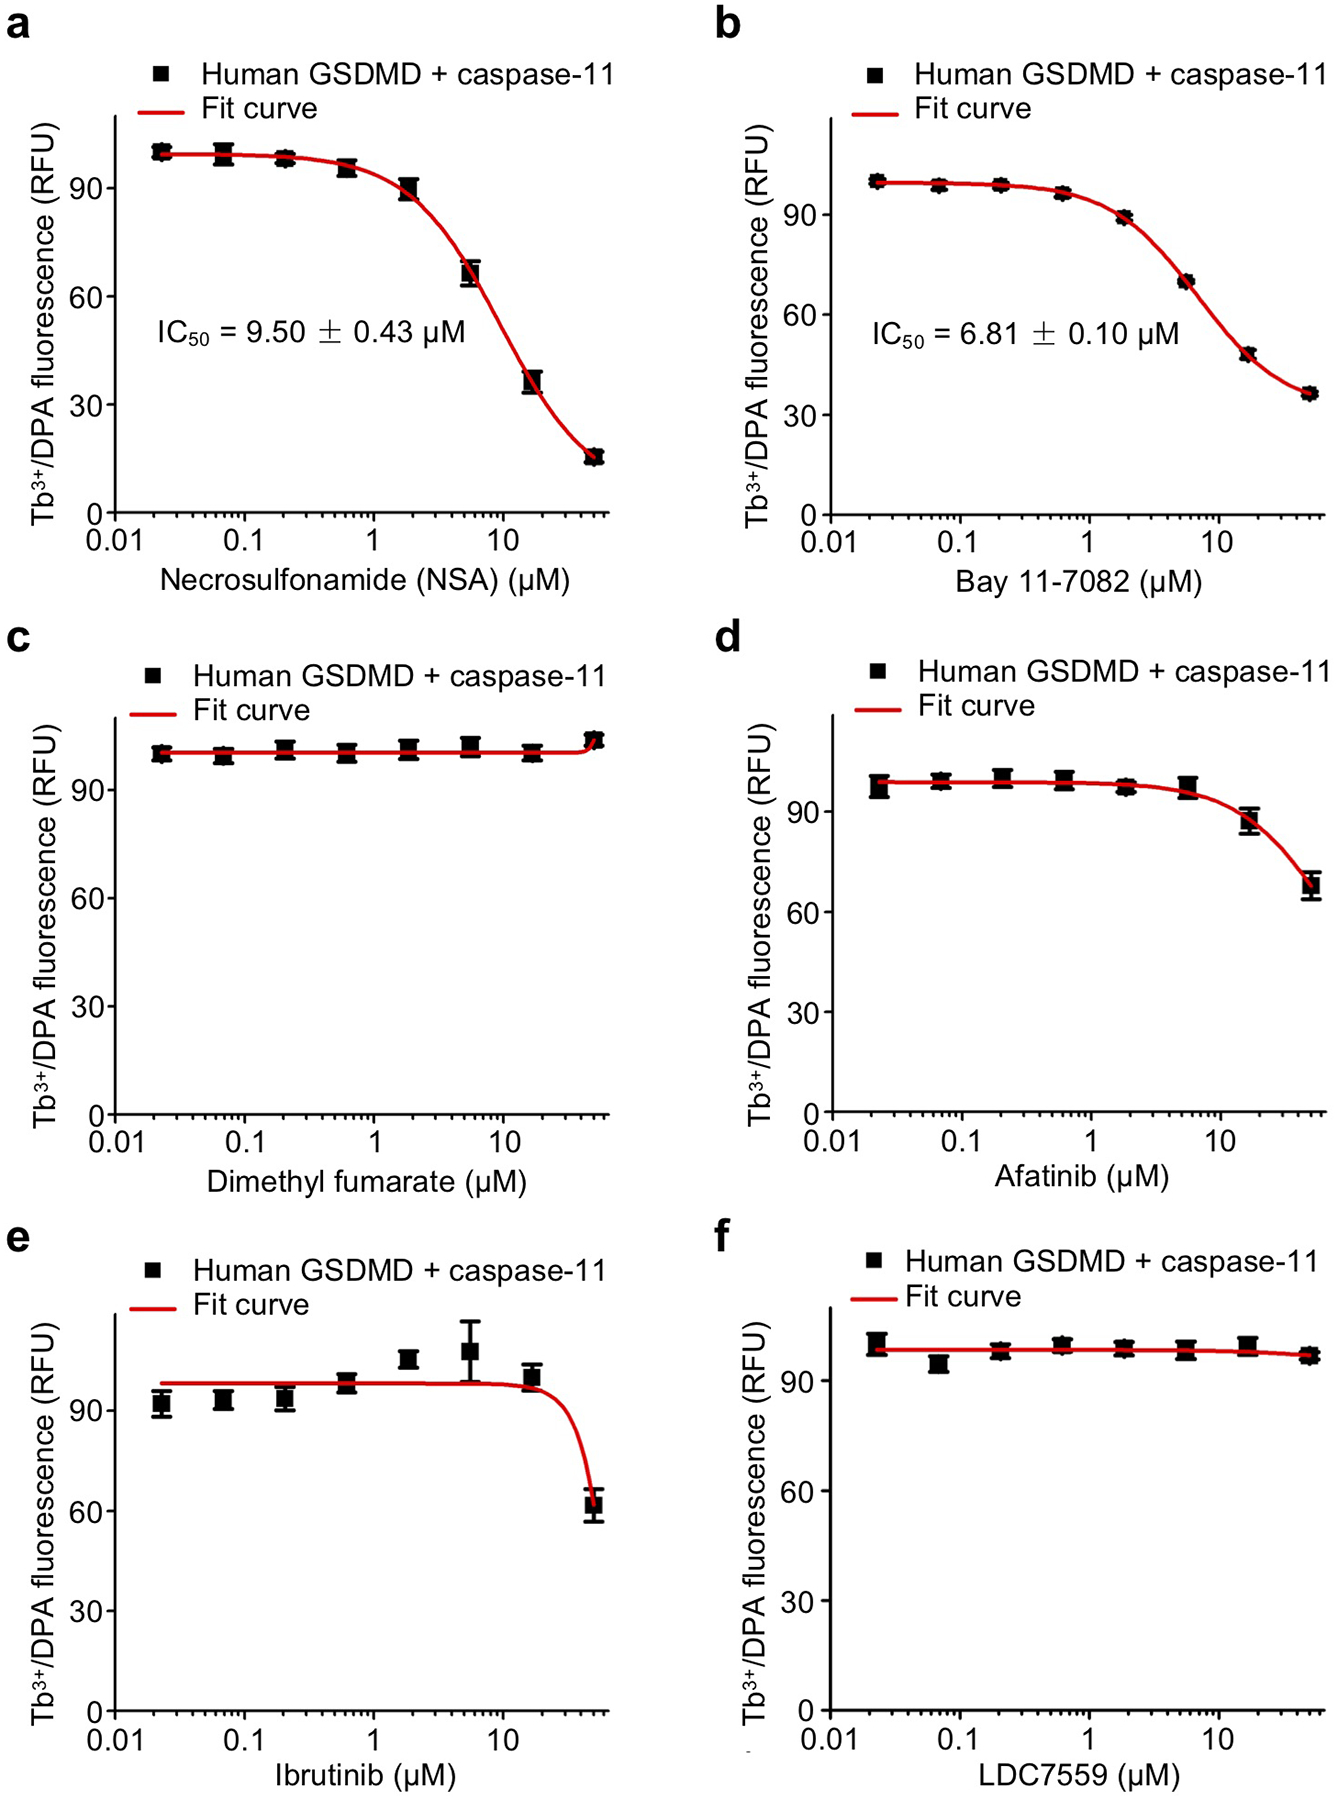
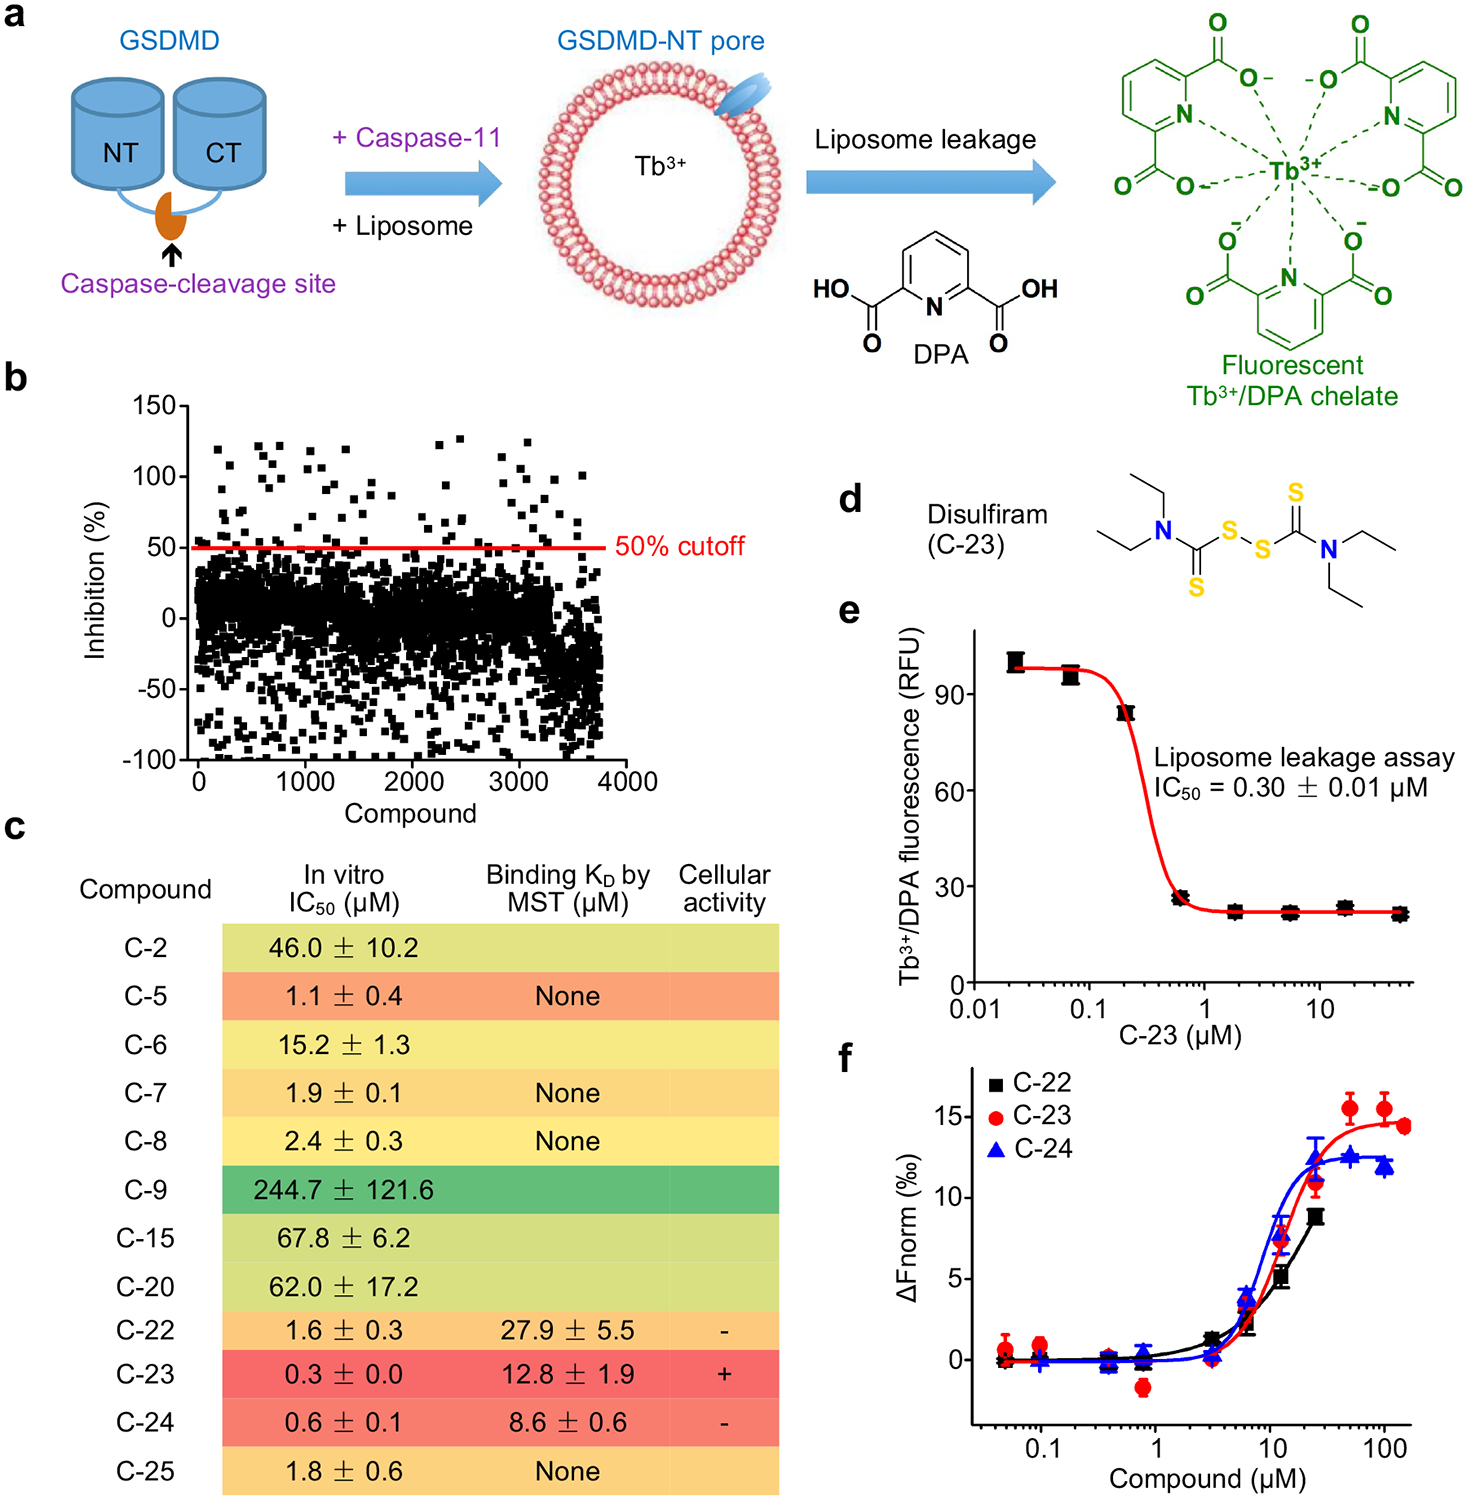
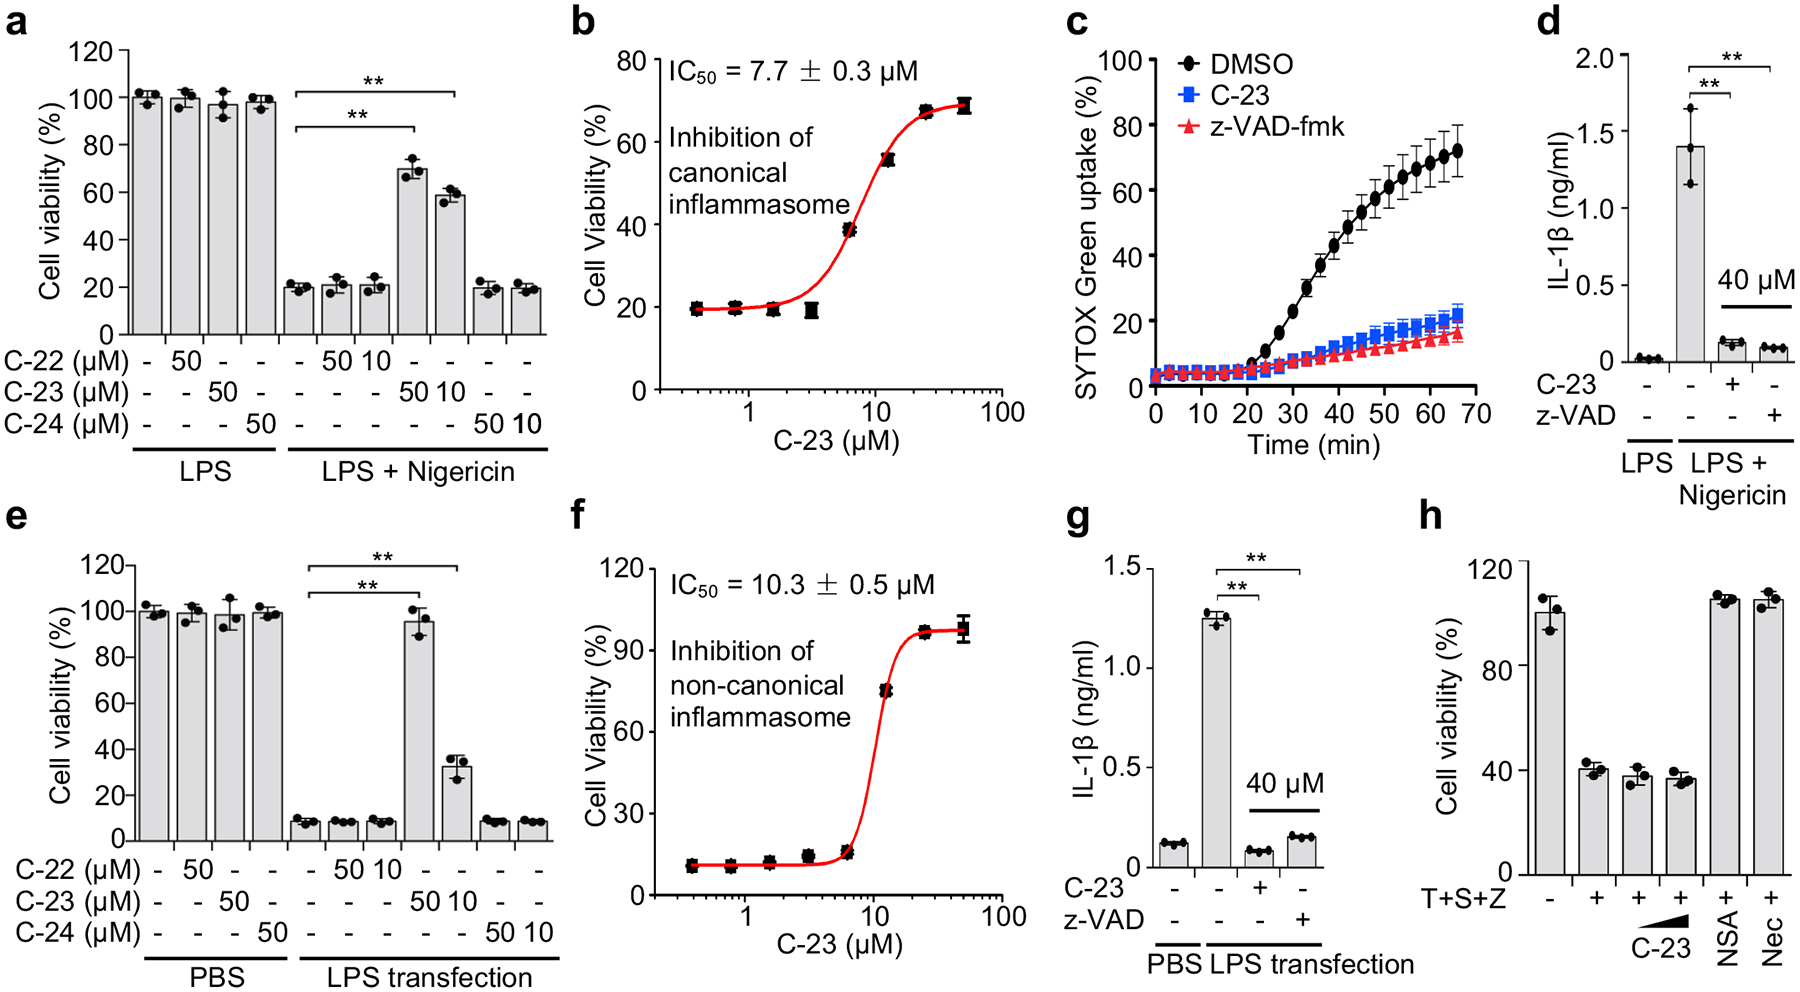
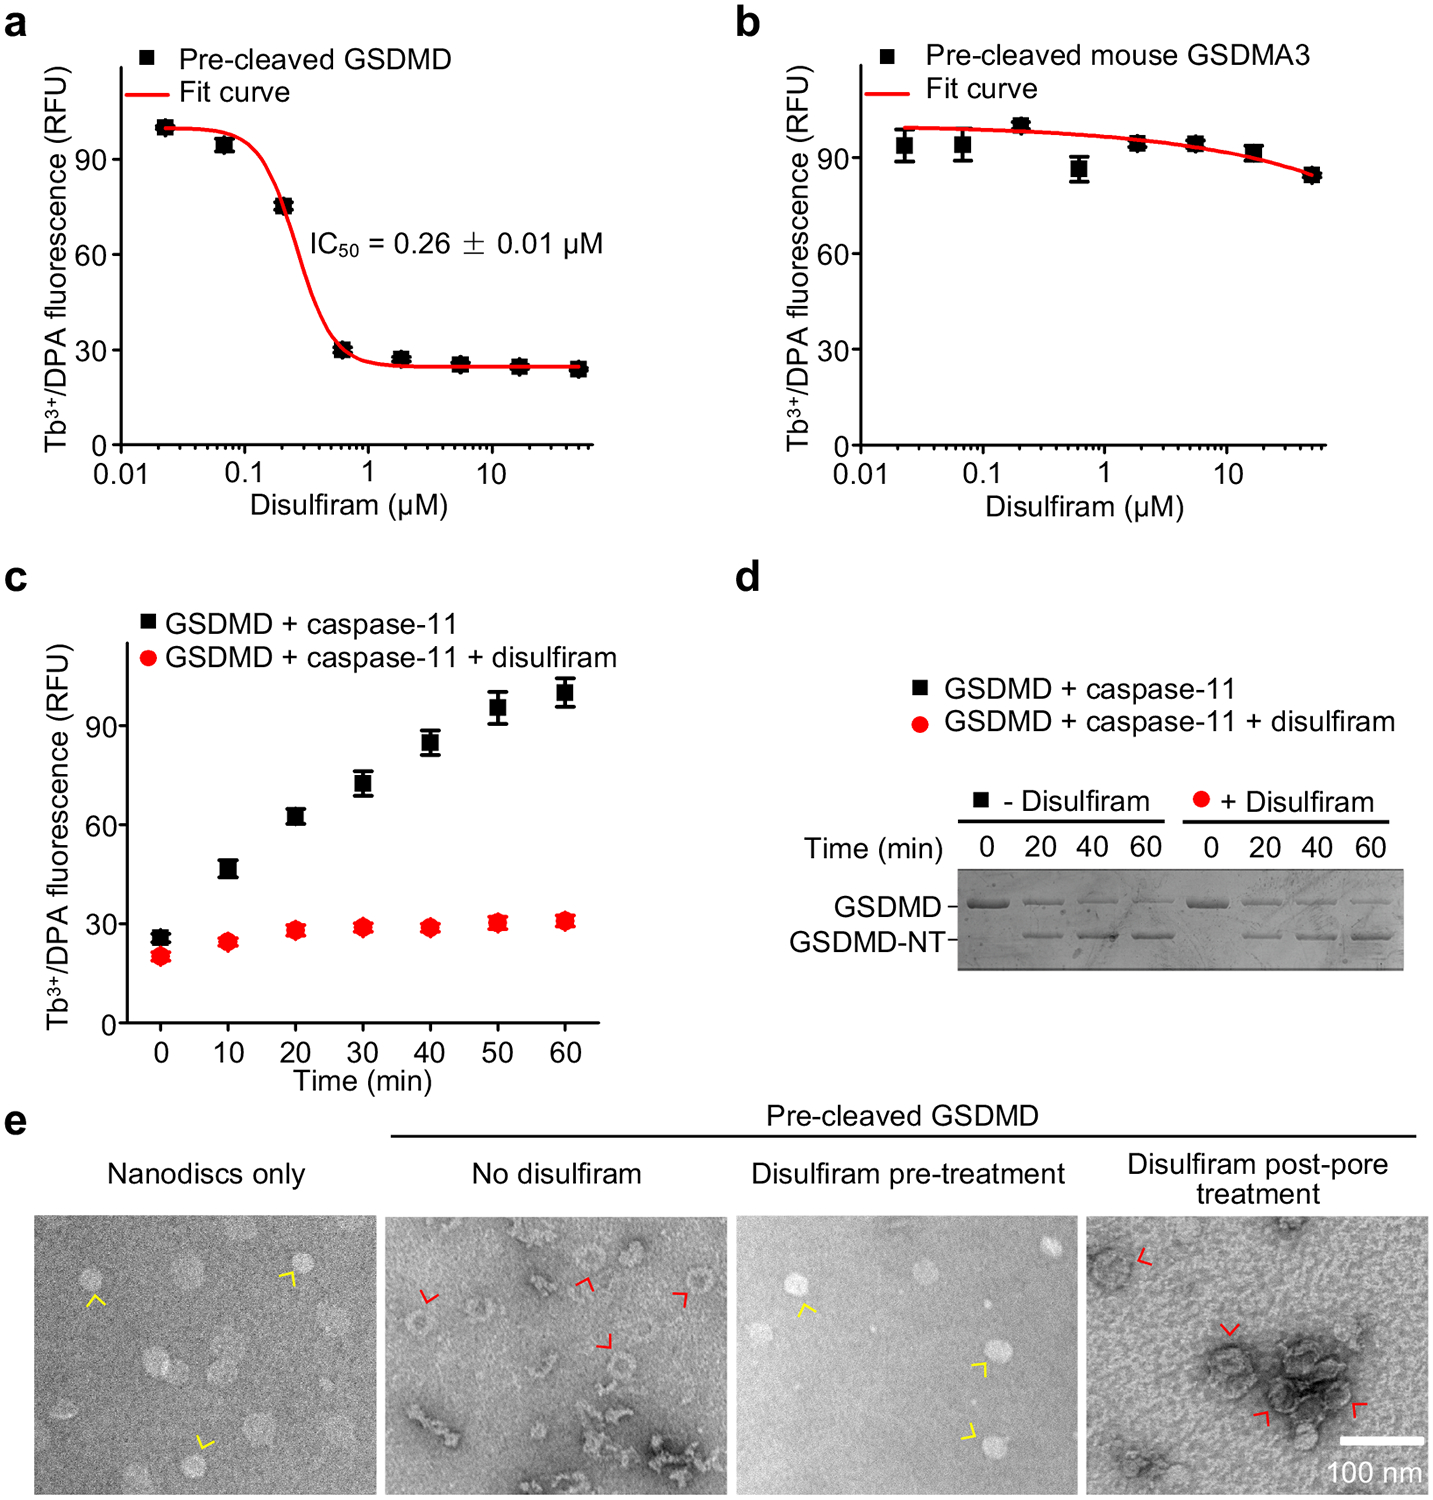
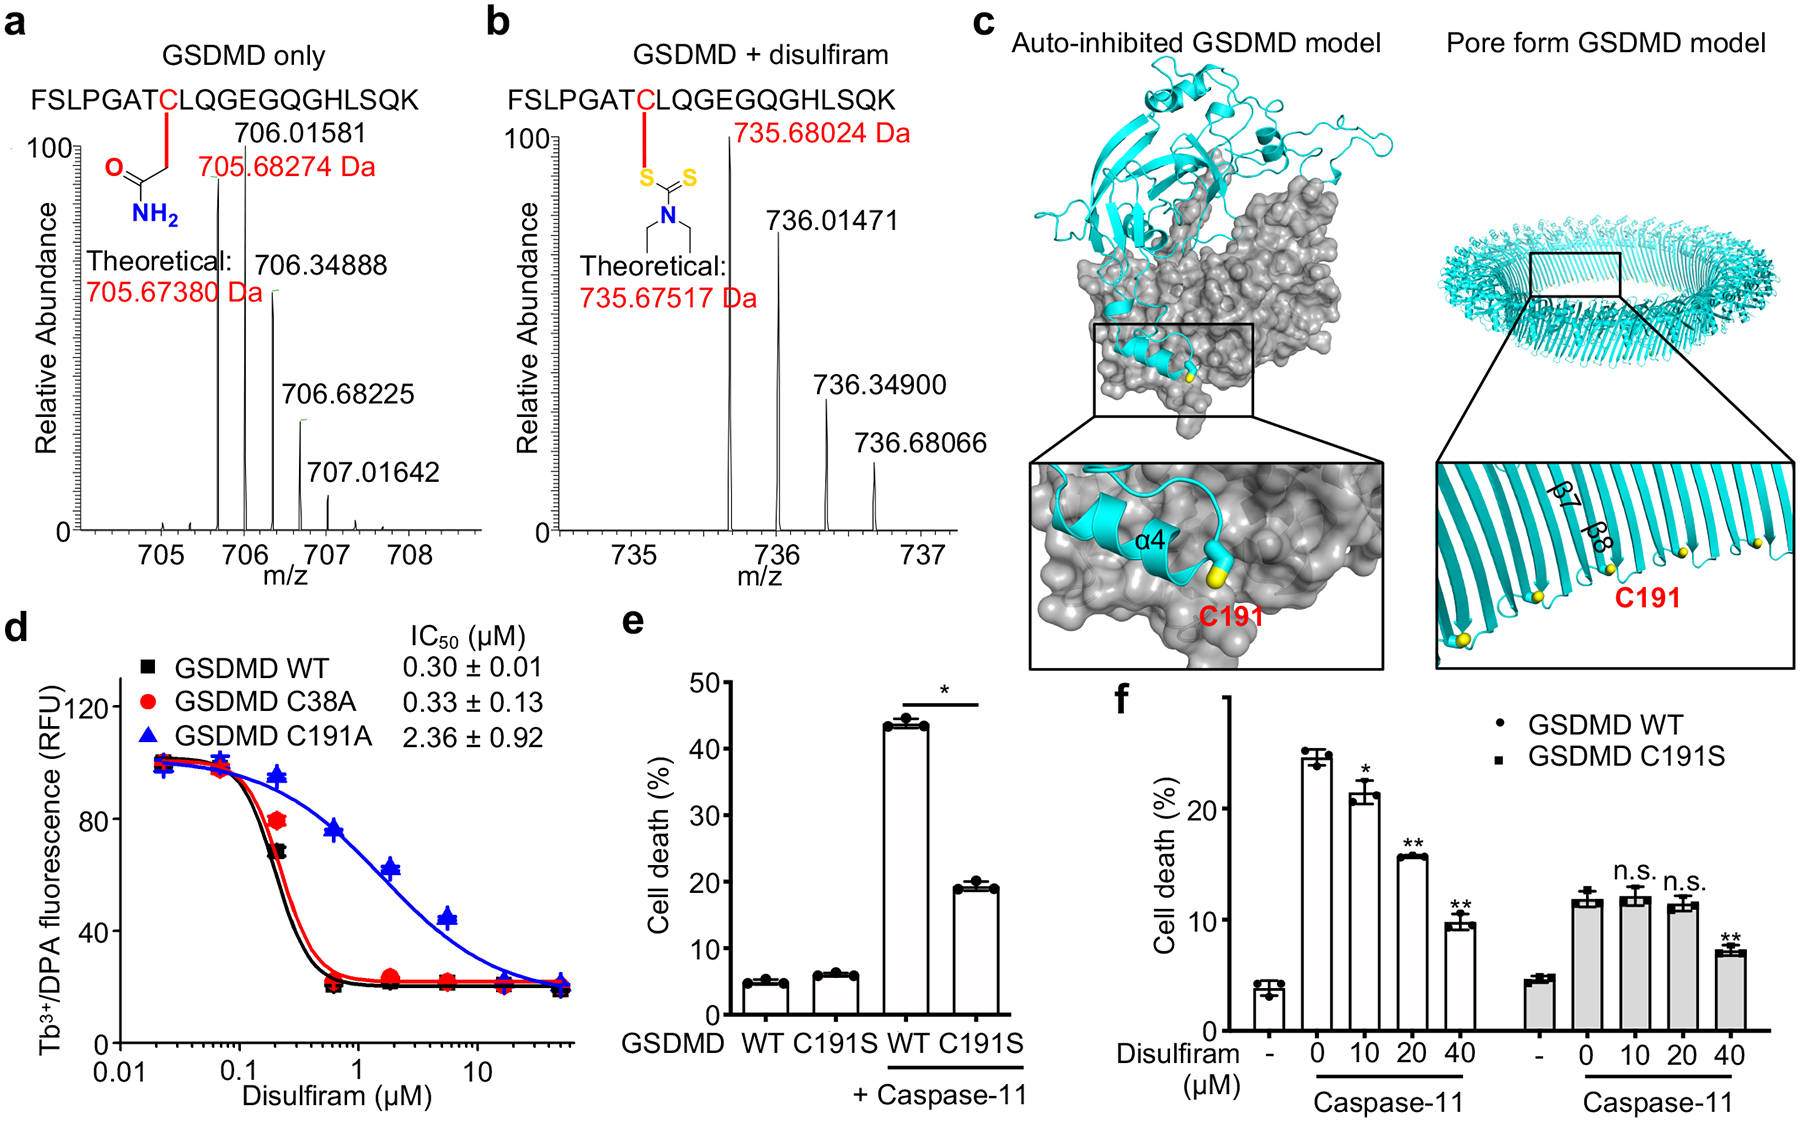
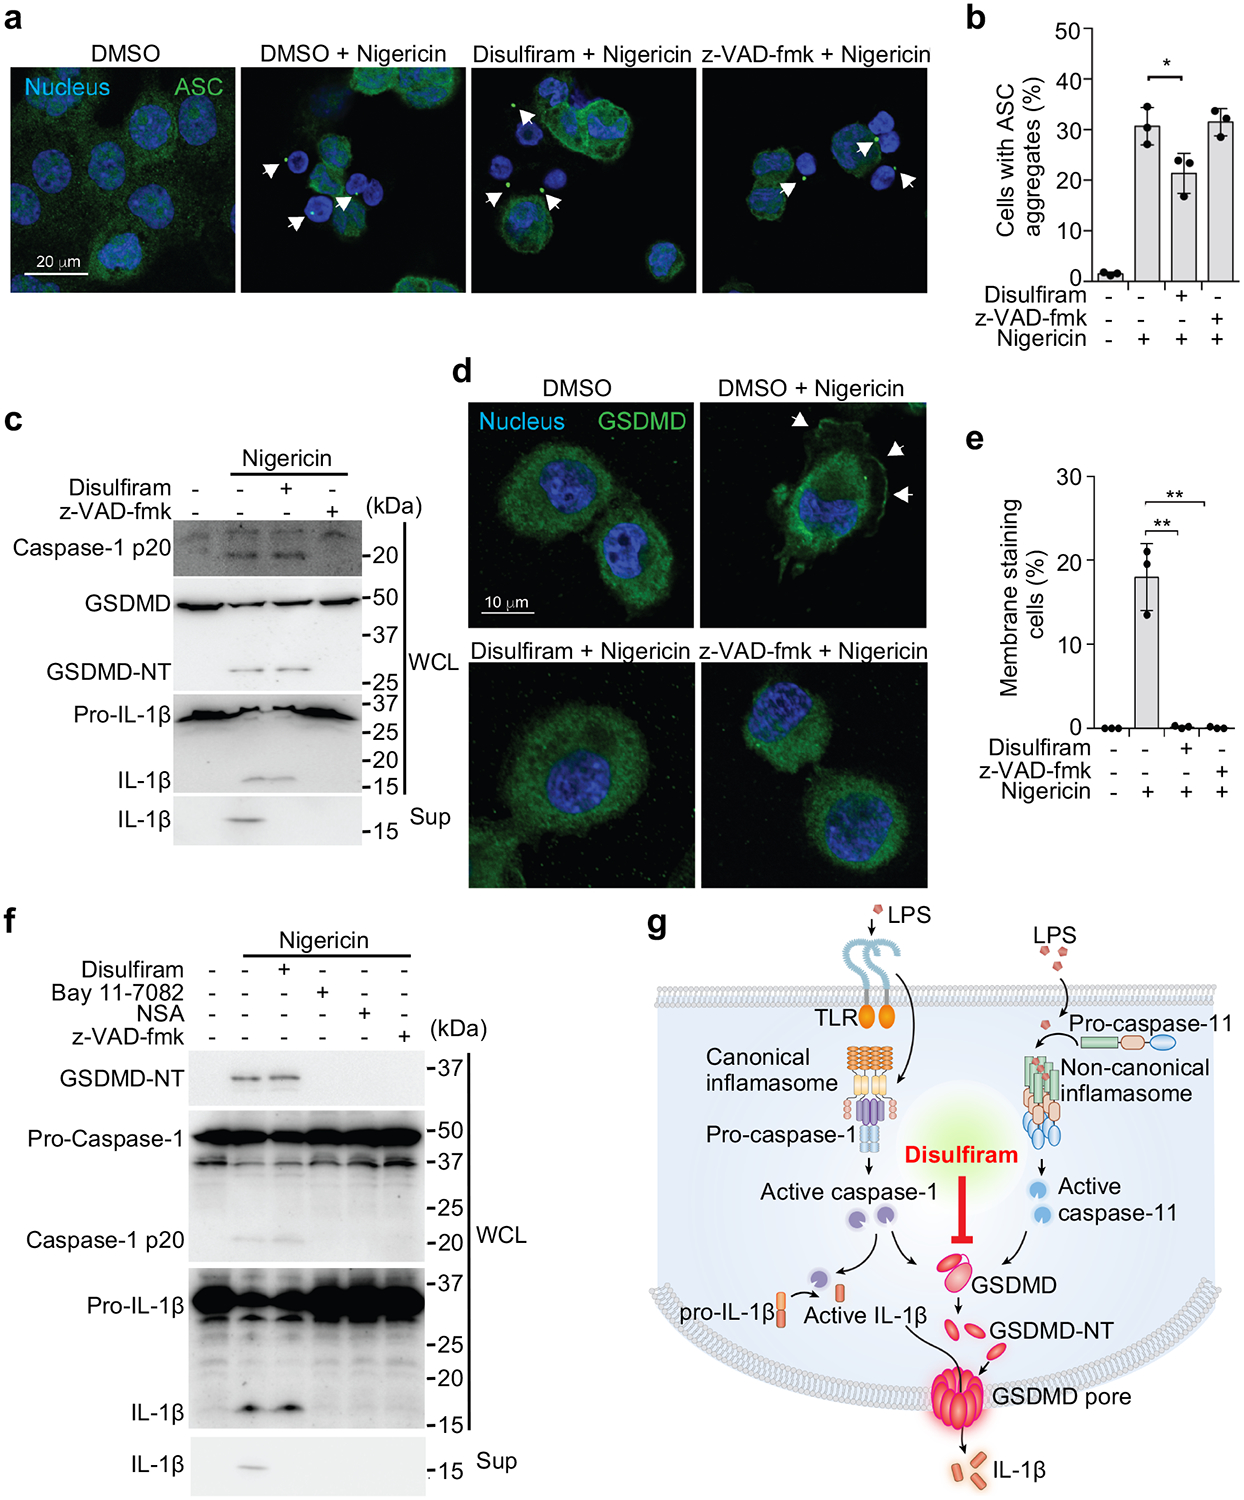
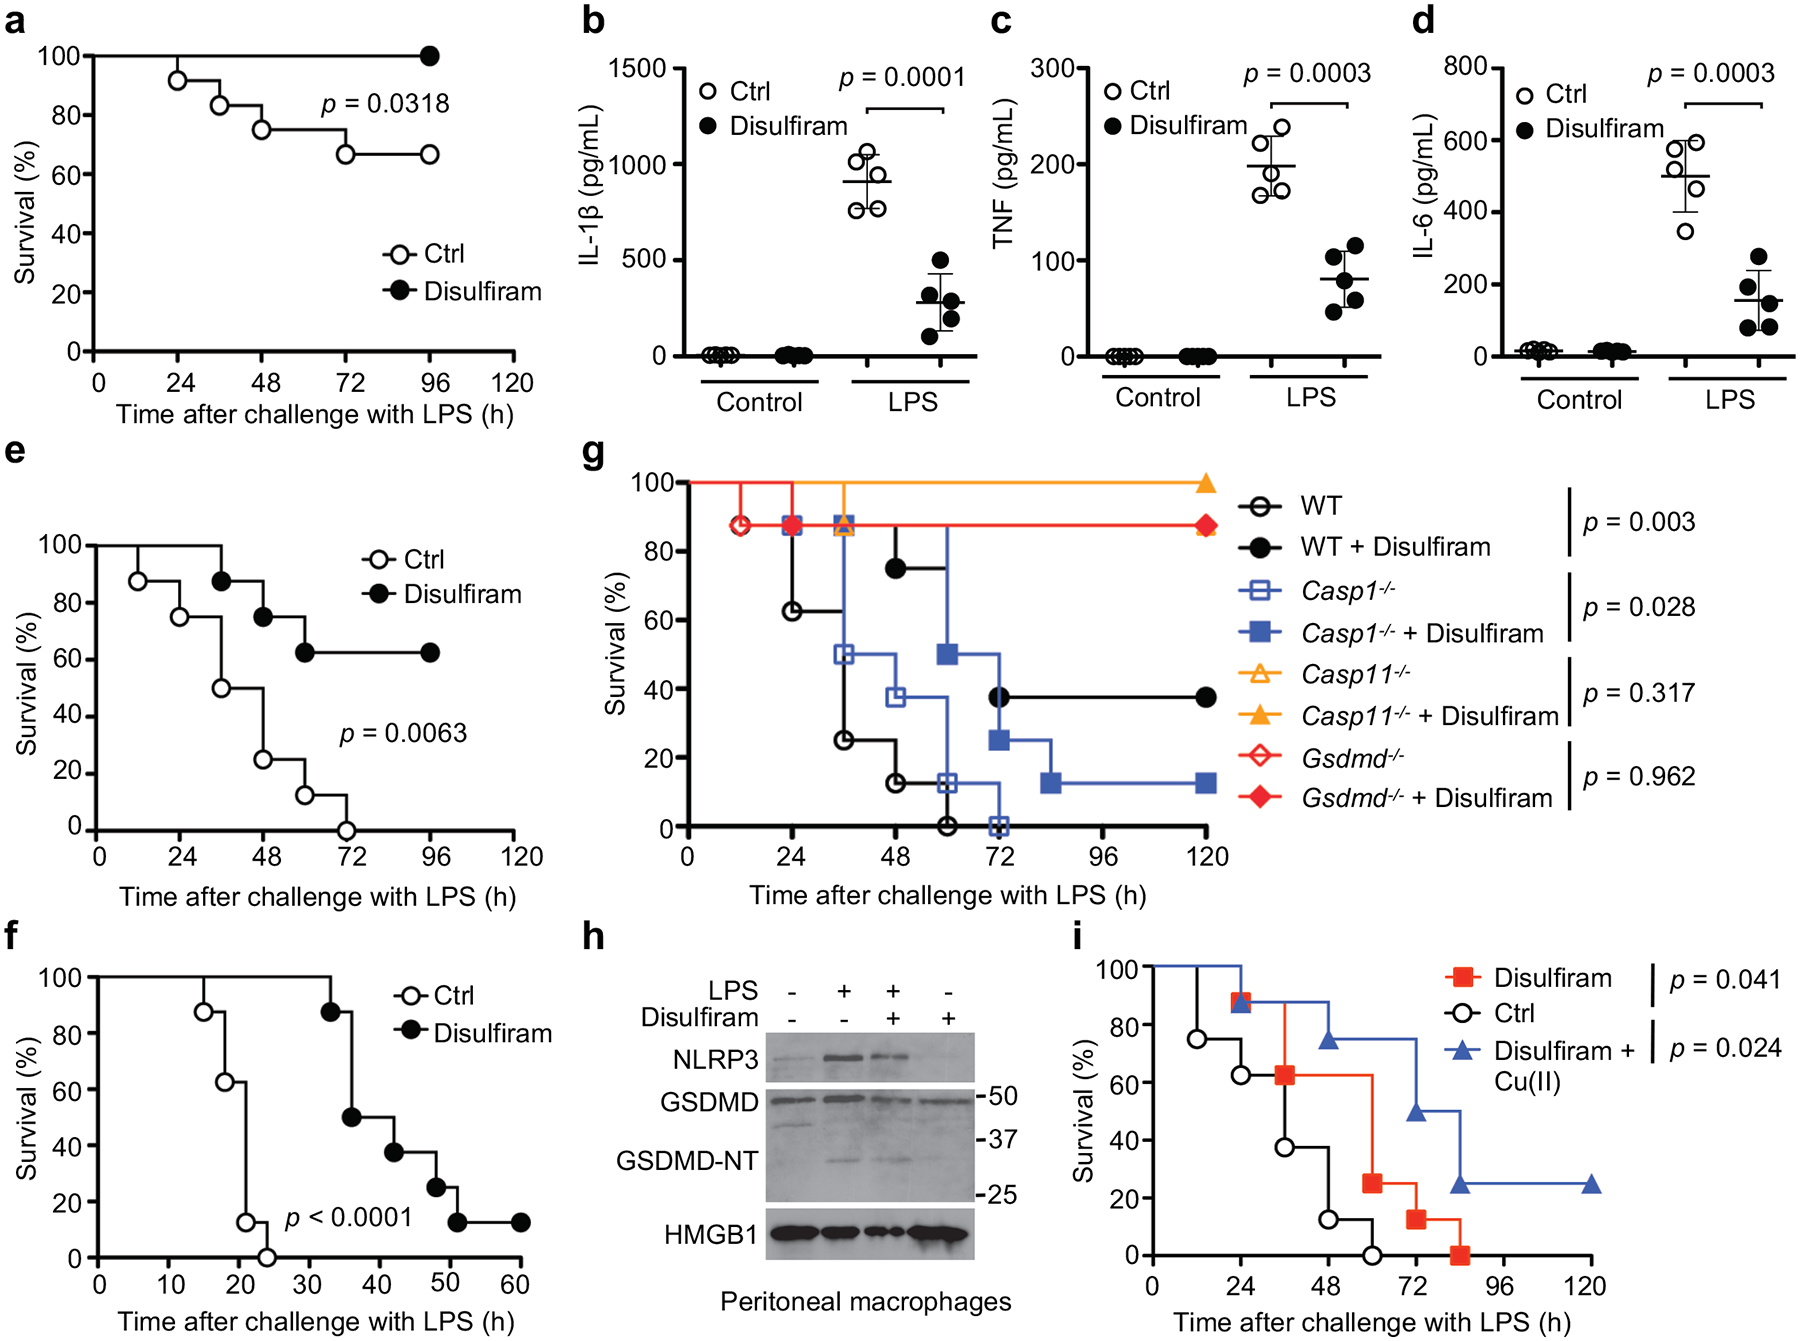
Cytosolic sensing of pathogens and damage by myeloid and barrier epithelial cells assembles large complexes called inflammasomes, which activate inflammatory caspases to process cytokines (IL-1β) and gasdermin D (GSDMD). Cleaved GSDMD forms membrane pores, leading to cytokine release and inflammatory cell death (pyroptosis). Inhibiting GSDMD is an attractive strategy to curb inflammation. Here we identify disulfiram, a drug for treating alcohol addiction, as an inhibitor of pore formation by GSDMD but not other members of the GSDM family. Disulfiram blocks pyroptosis and cytokine release in cells and lipopolysaccharide-induced septic death in mice. At nanomolar concentration, disulfiram covalently modifies human/mouse Cys191/Cys192 in GSDMD to block pore formation. Disulfiram still allows IL-1β and GSDMD processing, but abrogates pore formation, thereby preventing IL-1β release and pyroptosis. The role of disulfiram in inhibiting GSDMD provides new therapeutic indications for repurposing this safe drug to counteract inflammation, which contributes to many human diseases.


Conflict of interest statement

Competing Interests Statement. J. L. and H.W. are co-founders of Ventus Therapeutics. The other authors declare no competing interests.

Figures

Extended Data Fig. 1
Extended Data Fig. 1. Optimization and hits from the liposome leakage assay screen.
(a-c) Optimization of the Tb3+/DPA assay. (a) GSDMD (2.5 μM) and caspase-11 (2.5 μM) were incubated in liposome solutions at various concentrations in 20 mM HEPES buffer (150 mM NaCl) for 1 hr. The concentration of liposome lipids for the screen was set at 50 μM. n = 3 independent experiments. The mean ± s.e.m. is shown. (b) Different concentrations of GSDMD and caspase-11 (1:1 ratio) were incubated in liposome (50 μM) solutions for 1 hr. The concentration of GSDMD used in the screen was set at 0.3 μM. n = 3 independent experiments. The mean ± s.e.m. is shown. (c) Different concentrations of caspase-11 and GSDMD (0.3 μM) were incubated in liposome (50 μM) solutions for 1 hr. The concentration of caspase-11 used in the screen was set at 0.15 μM. n = 3 independent experiments. The mean ± s.e.m. is shown.The fluorescence intensity at 545 nm was measured after excitation at 276 nm. (d) Hit compounds evaluated in binding and/or cell-based assays. (e) Mouse iBMDMs were pretreated or not with disulfiram (C-23) ranging from 5–40 μM for 1 hr before transfection with PBS or poly(dA:dT) and analyzed for cell viability by CellTiter-Glo assay 4 hrs later. Graphs show mean ± s.d; data are representative of three independent experiments with replicates (n= 3) and similar results. Data were analyzed using two-tailed Student’s t-test. **P < 0.01.
Extended Data Fig. 2
Extended Data Fig. 2. The activity of disulfiram in cells is greatly increased by Cu(II).
(a) DTC–copper complex formation of disulfiram metabolite diethyldithiocarbamate (DTC) with Cu(II). (b) Dose response curves of inhibition of liposome leakage by disulfiram (C-23) or DTC in the presence or absence of Cu(II). n = 3 independent experiments. The mean ± s.e.m. is shown. (c) LPS-primed THP-1 were pretreated with C-23 or DTC in the presence or absence of Cu(II) for 1 hr before adding nigericin or medium for 2 hrs. Cell death was determined by CytoTox96 assay. n = 3 independent experiments. The mean ± s.e.m. is shown.
Extended Data Fig. 3
Extended Data Fig. 3. Effect of disulfiram on caspase-1 and caspase-11.
(a,b) Time course of caspase-1 (a) and caspase-11 (b) activity in the presence of indicated concentrations of disulfiram. Caspases (0.5 U) were incubated with disulfiram (at indicated concentrations for 1 hr before adding Ac-YVAD-AMC (40 μM)). (c,d) Dose response curve of disulfiram in the caspase-1 (a) and caspase-11 (b) activity assay. (e,f) Time course of caspase-1 (e) and caspase-11 (f) activity in the presence of indicated concentrations of disulfiram + Cu(II). Caspases (0.5 U) were incubated with disulfiram + Cu(II) (at indicated concentrations for 1 hr before adding Ac-YVAD-AMC (40 μM)). (g,h) Dose response curve of disulfiram + Cu(II) in the caspase-1 (e) and caspase-11 (f) activity assay. (a-h) n = 3 independent experiments. The mean ± s.e.m. is shown. Fluorescence intensity at 460 nm was measured after excitation at 350 nm.
Extended Data Fig. 4
Extended Data Fig. 4. Disulfiram covalently modifies human GSDMD on Cys 191.
(a) Disulfiram was preincubated for 1 hr with N-acetylcysteine (NAC, 500 μM) or medium before evaluating whether it inhibited pyroptosis of LPS + nigericin treated THP-1 cells. Disulfiram 2-fold dilutions ranged from 5–40 μM. Graphs show mean ± s.d; data are representative of three independent experiments with replicates (n= 3) and similar results. Data were analyzed using two-tailed Student’s t-test. Graphs show the mean ± s.d. and data shown are representative of three independent experiments. **P < 0.01. (b,c) nano-LC-MS/MS spectrum for the peptide containing C191 in human GSDMD. Data are representative of three independent experiments. (b) MS/MS spectrum for peptide FSLPGATCLQGEGQGHLSQK modified on cysteine (red) by carbamidomethyl. Protein coverage was 73%. (c) MS/MS spectrum for peptide FSLPGATCLQGEGQGHLSQK modified on cysteine (red) by disulfiram. Protein coverage was 72%.
Extended Data Fig. 5
Extended Data Fig. 5. Disulfiram covalently modifies GSDMD Cys191.
(a) Sequence alignment of GSDMA3, hGSDMA, mGSDMD and hGSDMD showing Cys residues (highlighted in red). (b) GSDMD (0.3 μM) was preincubated with the indicated concentrations of disulfiram (0–5.6 μM) for indicated times (2–90 min) before caspase-11 (0.15 μM) and liposomes (50 μM) were added. n = 3 independent experiments. The mean ± s.e.m. is shown. (c) FL mouse GSDMD or wildtype, C192S or C39A GSDMD-NT were transiently expressed in HEK293T cells. Cell death was determined by CytoTox96 cytotoxicity assay 20 hrs after transfection. (c) shows the mean ± s.d. of 1 representative experiment of three independent experiments performed. Comparison in (c) was calculated by two-tailed Student’s t-test. *P < 0.05.
Extended Data Fig. 6
Extended Data Fig. 6. Mouse monoclonal antibody recognizes full-length human GSDMD and the GSDMD-NT pore form on immunoblots and by immunofluorescence microscopy.
The monoclonal antibody against GSDMD was generated by immunizing mice with recombinant human GSDMD and boosting with recombinant human GSDMD-NT as described in Methods. (a) HEK293T cells were transfected with the indicated plasmids and cell lysates were analysed by immunoblot of reducing gels probed with the indicated antibodies. (b) Cell lysates of HCT116, 293T and THP-1 cells, treated or not with nigericin, were immunoblotted with the indicated antibodies. 293T cells do not express endogenous GSDMD. (c) 293T and THP-1 cells were stained with the anti-GSDMD monoclonal antibody and co-stained with DAPI (blue). 293T cells show no background staining. Data are representative of at least three independent experiments.
Extended Data Fig. 7
Extended Data Fig. 7. Disulfiram protects against LPS-induced sepsis.
(a-c) Mice were pretreated with disulfiram (50 mg/kg) or vehicle (Ctrl) by intraperitoneal injection 24 and 4 hrs before intraperitoneal challenge with 15 mg/kg LPS and followed for survival. Serum IL-1β (a), TNF (b) and IL-6 (c) were measured by multiplex luminex assay (n= 5/group) 12 hrs post LPS challenge. Shown are mean ± s.e.m. Statistical differences between the groups were calculated by multiple t-test. Type I error was corrected by the Holm-Sidak method.
Extended Data Fig. 8
Extended Data Fig. 8. Dose response curve of other compounds in GSDMD-mediated liposome leakage assay.
Dose response curve of necrosulfonamide (a), Bay 11–7082 (b), dimethyl fumarate (DMF) (c), afatinib (d), ibrutinib (e), and LDC7559 (f) in liposome leakage induced by 0.3 μM GSDMD plus 0.15 μM caspase-11. (a-f) n = 3 independent experiments. The mean ± s.e.m. is shown.
Figure 1
Figure 1
High throughput screen identifies disulfiram as an inhibitor of GSDMD pore formation. (a) Terbium (Tb3+)/dipicolinic acid (DPA) fluorescence liposome leakage assay. (b) Percentage inhibition of liposome leakage by each compound, assayed at 25 μg/mL (~50 μM for most compounds). Cutoff was 50% inhibition. (c) IC50s of the 12 screening hits after excluding Tb3+/DPA assay quenchers and hits without saturatable IC50 curve. n = 3 independent experiments. The top 7 hits were assessed for GSDMD binding by microscale thermophoresis (MST). n = 3 independent experiments. (d) Chemical structure of compound C-23 (disulfiram). (e) Dose response curve of disulfiram in liposome leakage assay. n = 3 independent experiments. The mean ± s.e.m. is shown. (f) MST measurement of the binding of Alexa 488-labeled His-MBP-GSDMD (80 nM) with C-22, C-23 or C-24. n = 3 independent experiments. The mean ± s.e.m. is shown.
Figure 2
Figure 2
Disulfiram inhibits pyroptosis and IL-1β secretion. (a-d) PMA-differentiated LPS-primed human THP-1 were pretreated with indicated concentrations of each compound for 1 hr before adding nigericin or medium. The number of surviving cells was determined by CellTiter-Glo assay (a, b), pyroptosis was measured by SYTOX Green uptake in the presence of no inhibitor or 30 μM C-23 or z-VAD-fmk (c), and IL-1β in culture supernatants was assessed by ELISA (d) 2 hrs later. (e-g) Mouse iBMDMs were pretreated with each compound for 1 hr before electroporation with PBS or LPS. The number of surviving cells was determined by CellTiter-Glo assay (e, f); and IL-1β in culture supernatants was assessed by ELISA 2.5 h later (g). (h) HT-29 cells were pretreated (10 and 50 μM) or not with disulfiram (C-23) or 2 μM necrosulfonamide (NSA) or 10 μM Necrostatin-1 (Nec) for 1 hr before adding 20 ng/ml TNF (T), 100 nM SMAC mimetic (S), and 20 μM z-VAD-fmk (Z) and analyzed for cell viability by CellTiter-Glo assay 24 hrs later. Graphs in (a, d, e, h, g) show mean ± s.d; data are representative of three independent experiments with replicates (n= 3) and similar results. Data were analyzed using two-tailed Student’s t-test. **P < 0.01.
Figure 3
Figure 3
Disulfiram inhibition of liposome leakage is mediated primarily by direct inhibition of GSDMD pore formation. (a,b) Dose response of effect of disulfiram on liposome leakage induced by pre-cleaved human GSDMD (0.3 μM) (a) or pre-cleaved mouse GSDMA3 (0.3 μM) (b). n = 3 independent experiments. The mean ± s.e.m. is shown. (c) Time course of liposome leakage in the presence or absence of disulfiram. n = 3 independent experiments. The mean ± s.e.m. is shown. (d) Processing of GSDMD by caspase-11 in the presence or absence of disulfiram. Data are representative of three independent experiments. (e) Negative stain EM images of PS-containing nanodiscs that were incubated or not with pre-cleaved GSDMD. In the 3rd image from the left, disulfiram was added to pre-cleaved GSDMD before it was added to the nanodiscs; in the 4th image, disulfiram was added after the pre-cleaved GSDMD was incubated with nanodiscs when pores had formed. Data are representative of three independent experiments. Scale bar, 100 nm. Yellow arrows point to empty nanodiscs; red arrows point to pores.
Figure 4
Figure 4
Disulfiram covalently modifies GSDMD Cys191. (a,b) MS/MS spectra of the Cys191-containing human GSDMD peptide FSLPGATCLQGEGQGHLSQK (aa 184–103; 2057.00 Da) modified on Cys191 (red) by carbamidomethyl (an increase of 57.0214 Da) [LC retention time, 22.85 min; a triplet charged precursor ion m/z 705.6827 (mass: 2114.0481 Da; delta M 2.27 ppm) was observed] (a) or of the corresponding GSDMD peptide after GSDMD incubation with disulfiram, which was modified on Cys191 (red) by the diethyldithiocarbamate moiety of disulfiram (an increase of 147.0255 Da). [LC retention time. 28.93 min; a triplet charged precursor ion m/z 735.6802 (mass: 2204.0406 Da; delta M 0.53 ppm) was observed.] (b). Data are representative of three independent experiments. (c) Models of full-length human GSDMD in its auto-inhibited form and of the pore form of GSDMD-NT based on the corresponding structures of GSDMA3 , showing the location in yellow of Cys191, modified by compound disulfiram. GSDMD-NT in cyan; GSDMD-CT in gray. d, Dose response curve of disulfiram inhibition of liposome leakage induced by wildtype (WT), C38A or C191A human GSDMD (0.3 μM) plus caspase-11 (0.15 μM). n = 3 independent experiments. The mean ± s.e.m. is shown. e, Full-length (FL) human GSDMD and GSDMD C191S were co-expressed with caspase-11 in HEK293T cells. Cell death was determined by CytoTox96 cytotoxicity assay 20 hrs after transfection. f, FL human wildtype or C191S GSDMD were co-expressed with caspase-11 in HEK293T cells. Eight h post transfection, the indicated amount of disulfiram was added and cell death was determined by LDH release 12 hrs later. (e,f) show the mean ± s.d. of 1 representative experiment of three independent experiments performed. Comparisons in (e,f) were calculated by two-tailed Student’s t-test. *P < 0.05, **P < 0.01, n.s., not significant.
Figure 5
Figure 5
GSDMD pore formation is the main target of disulfiram. (a-e) LPS-primed THP-1 cells, pretreated or not with 30 μM disulfiram or z-VAD-fmk for 1 hr and stimulated with nigericin or medium, were analyzed for ASC specks (a, b), caspase-1, GSDMD and pro-IL-1β cleavage and IL-1 release by immunoblot of whole cell lysate (WCL) or culture supernatants (Sup) (c), and redistribution of GSDMD to the plasma membrane (d, e). (a) shows representative images of ASC specks (arrowheads) and (b) shows mean ± s.d. percent of cells with ASC specks analyzed 20 min after adding nigericin. The ratios of cells with ASC specks were calculated by counting 30 high-power fields for each sample in 5 independent experiments and analyzed using two-tailed Student’s t-test. In (c) WCL and Sup, harvested 1 hr after adding nigericin, were immunoblotted with the indicated antibodies. The GSDMD antibody used was generated in house (Extended Data Fig. 6). In (d, e) cells were fixed 30 min after adding nigericin and stained for GSDMD using a previously unreported monoclonal antibody generated in house (Extended Data Fig. 6). Shown are representative confocal microscopy images (d) and quantification (e) of the proportion of cells with GSDMD membrane staining and pyroptotic bubbles. Arrows indicate GSDMD staining of pyroptotic bubbles. The ratios of cells with GSDMD membrane staining were calculated by counting 40 high-power fields for each sample in 5 independent experiments and analyzed using two-tailed Student’s t-test. (f) Mouse iBMDMs were pretreated with disulfiram, Bay 11–7082, necrosulfonamide (NSA) or z-VAD-fmk for 1 hr before adding Nigericin. Whole cell lysates and culture supernatants, harvested 1 hr after adding nigericin, were immunoblotted with the indicated antibodies. Graphs show the mean ± s.d; data are representative of three independent experiments. Data in (c, f) are representative of three independent experiments. *P < 0.05, **P < 0.01. (g) Model of inflammasome pathway steps and their inhibition by disulfiram, with a main effect on GSDMD.
Figure 6
Figure 6
Disulfiram protects against LPS-induced sepsis. (a-f) Mice were pretreated with disulfiram (50 mg/kg) or vehicle (Ctrl) by intraperitoneal injection 24 and 4 hrs before intraperitoneal challenge with 15 (a-d), 25 (e), or 50 (f) mg/kg LPS and followed for survival (a,e,f). Statistical analysis was performed using the log-rank (Mantel-Cox) test (a, n = 12 mice/group, e,f, n = 8 mice/group). Serum IL-1β, TNF and IL-6 were measured by ELISA (n= 5 mice/group) 12 hrs post LPS challenge (b-d). Data were analyzed using two-tailed Student’s t-test. Shown are mean ± s.d. (g) Mice were pretreated with disulfiram (50 mg/kg) or vehicle (Ctrl) by intraperitoneal injection 4 hrs before and daily after intraperitoneal LPS challenge (25 mg/kg) and followed for survival. Statistical analysis was performed using the log-rank (Mantel-Cox) test (n = 8 mice/group). (h) Peritoneal macrophages from four indicated groups of mice were analyzed for NLRP3, GSDMD and HMGB1 by immunoblot. (i) Mice were challenged with 25 mg/kg LPS intraperitoneally and then treated with vehicle (Ctrl) or 50 mg/kg disulfiram given 0 and 12 hrs later. Indicated mice also received copper gluconate (0.15 mg/kg). Statistical analysis was performed using the log-rank (Mantel-Cox) test (n = 8 mice/group). Experiments were repeated three independent times.

Comment in

References

    1. Rathinam VA, Vanaja SK & Fitzgerald KA Regulation of inflammasome signaling. Nat Immunol 13, 333–332 (2012). - PMC - PubMed
    1. Lamkanfi M & Dixit VM Inflammasomes and their roles in health and disease. Annu Rev Cell Dev Biol 28, 137–161 (2012). - PubMed
    1. Broz P & Dixit VM Inflammasomes: mechanism of assembly, regulation and signalling. Nat Rev Immunol 16, 407–420 (2016). - PubMed
    1. Kayagaki N et al. Caspase-11 cleaves gasdermin D for non-canonical inflammasome signalling. Nature 526, 666–671 (2015). - PubMed
    1. Shi J et al. Cleavage of GSDMD by inflammatory caspases determines pyroptotic cell death. Nature 526, 660–665 (2015). - PubMed

Publication types

MeSH terms