. 2020 Jun;22(6):728-739.
doi: 10.1038/s41556-020-0511-2. Epub 2020 May 4.

FBP1 loss disrupts liver metabolism and promotes tumorigenesis through a hepatic stellate cell senescence secretome

Affiliations

FBP1 loss disrupts liver metabolism and promotes tumorigenesis through a hepatic stellate cell senescence secretome

Fuming Li et al. Nat Cell Biol. 2020 Jun.

Abstract

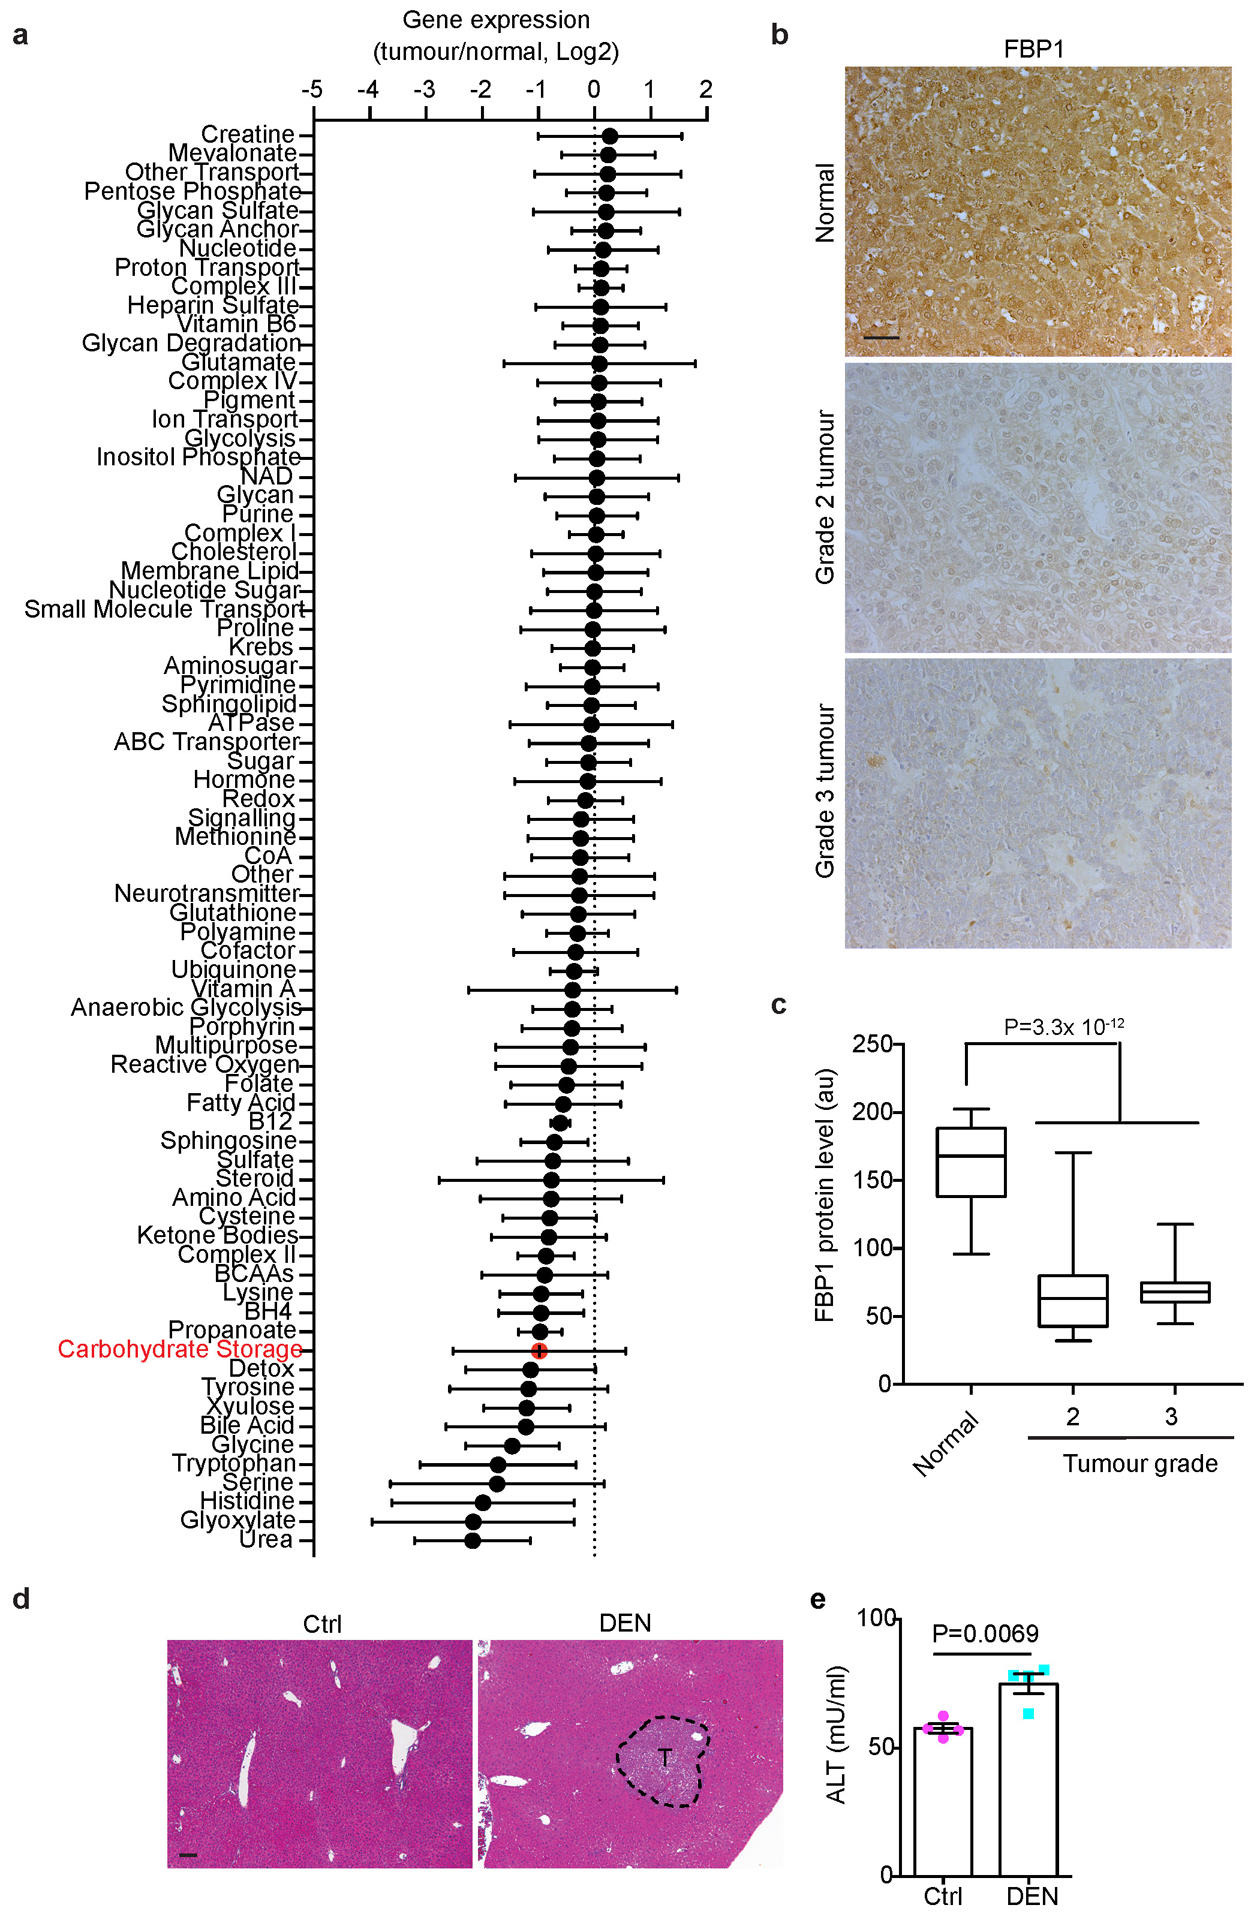
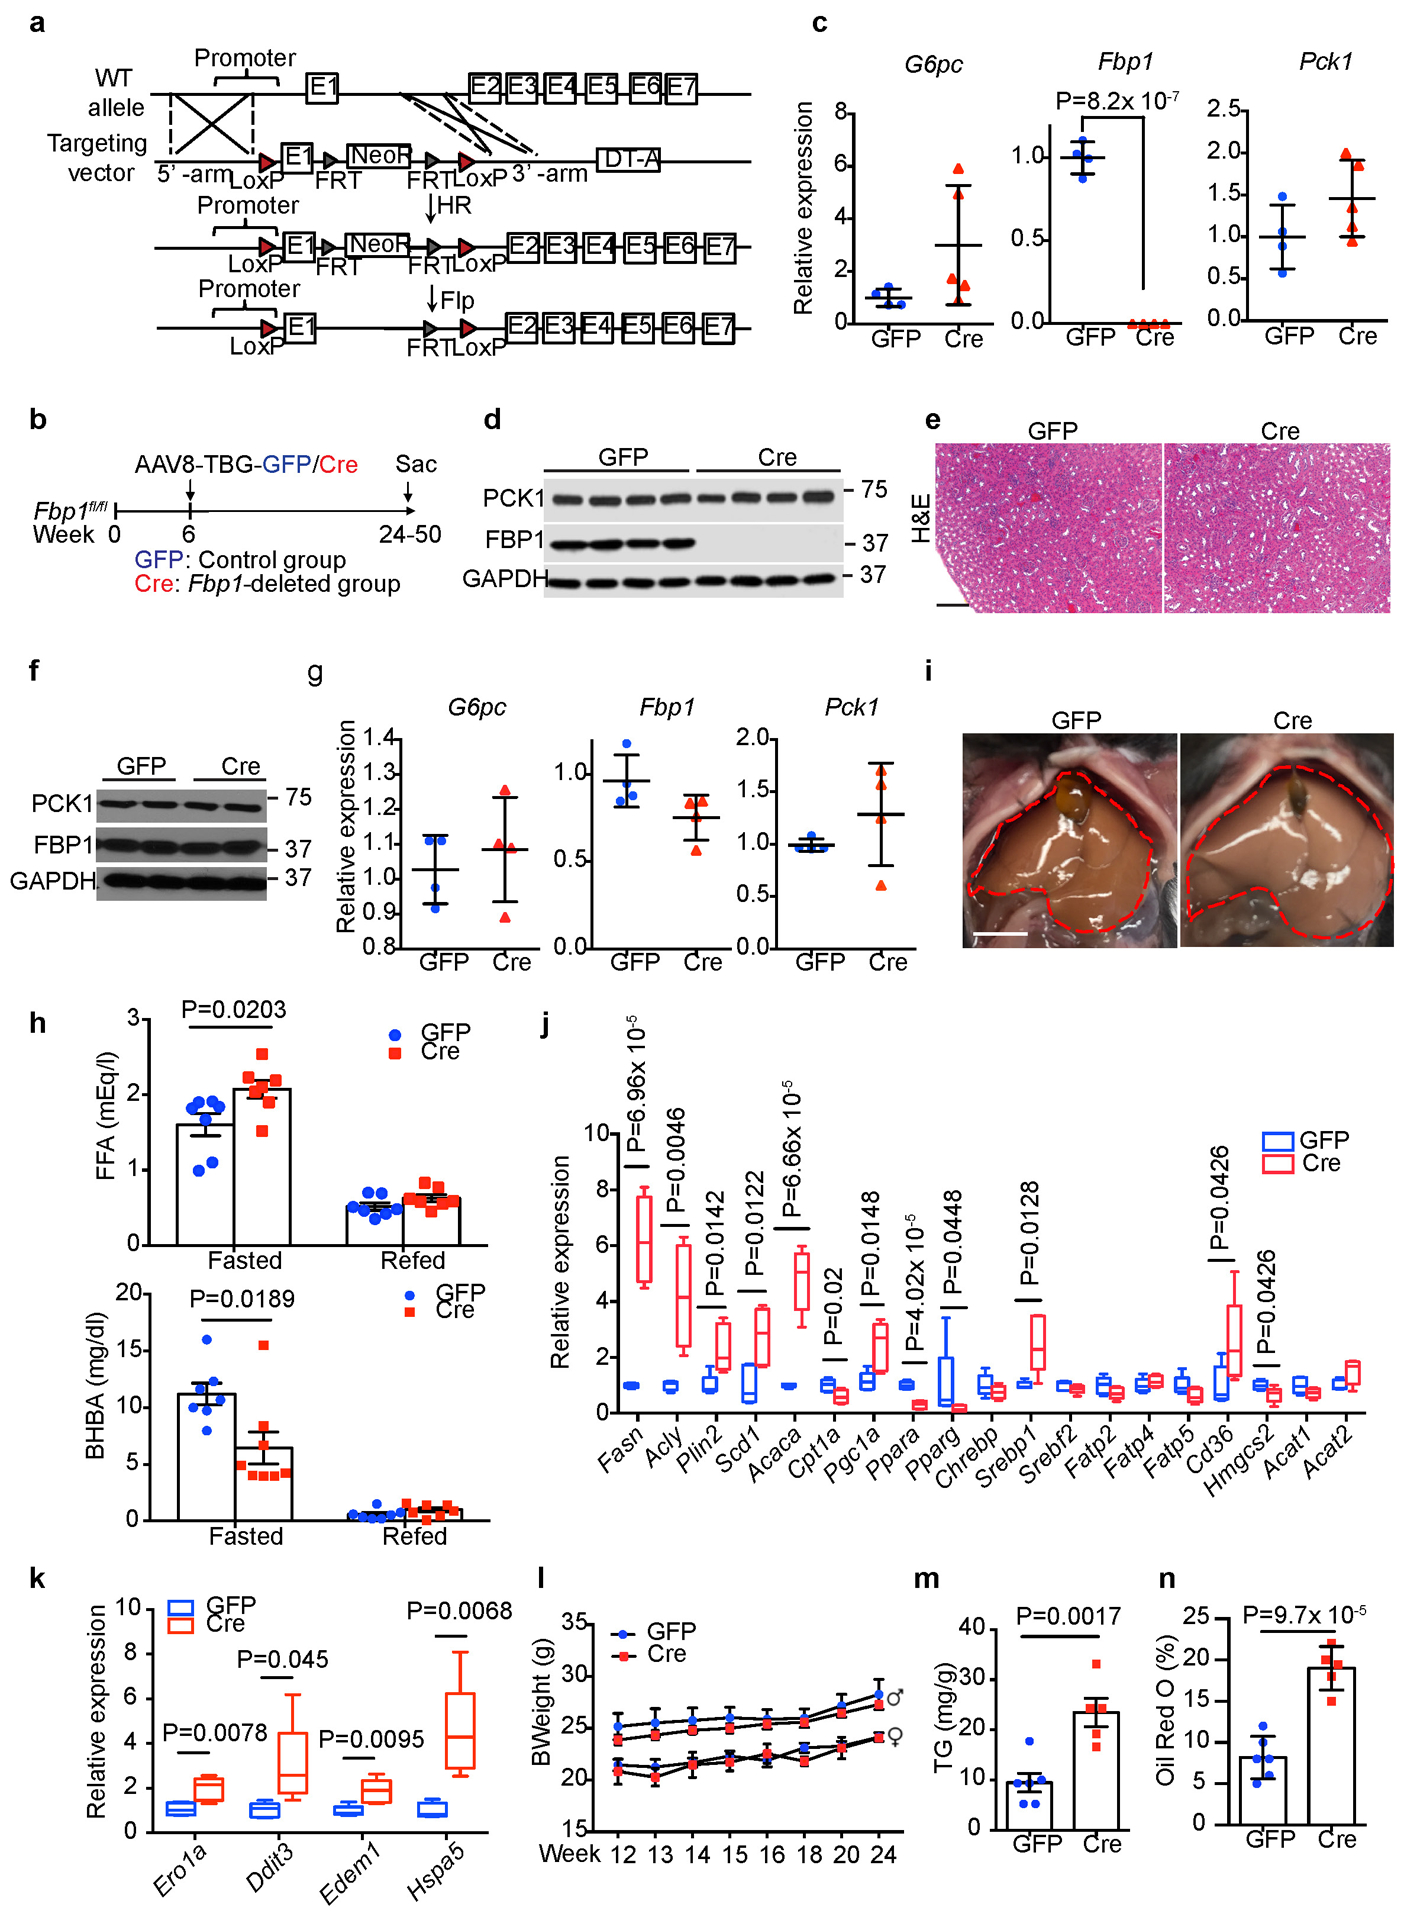
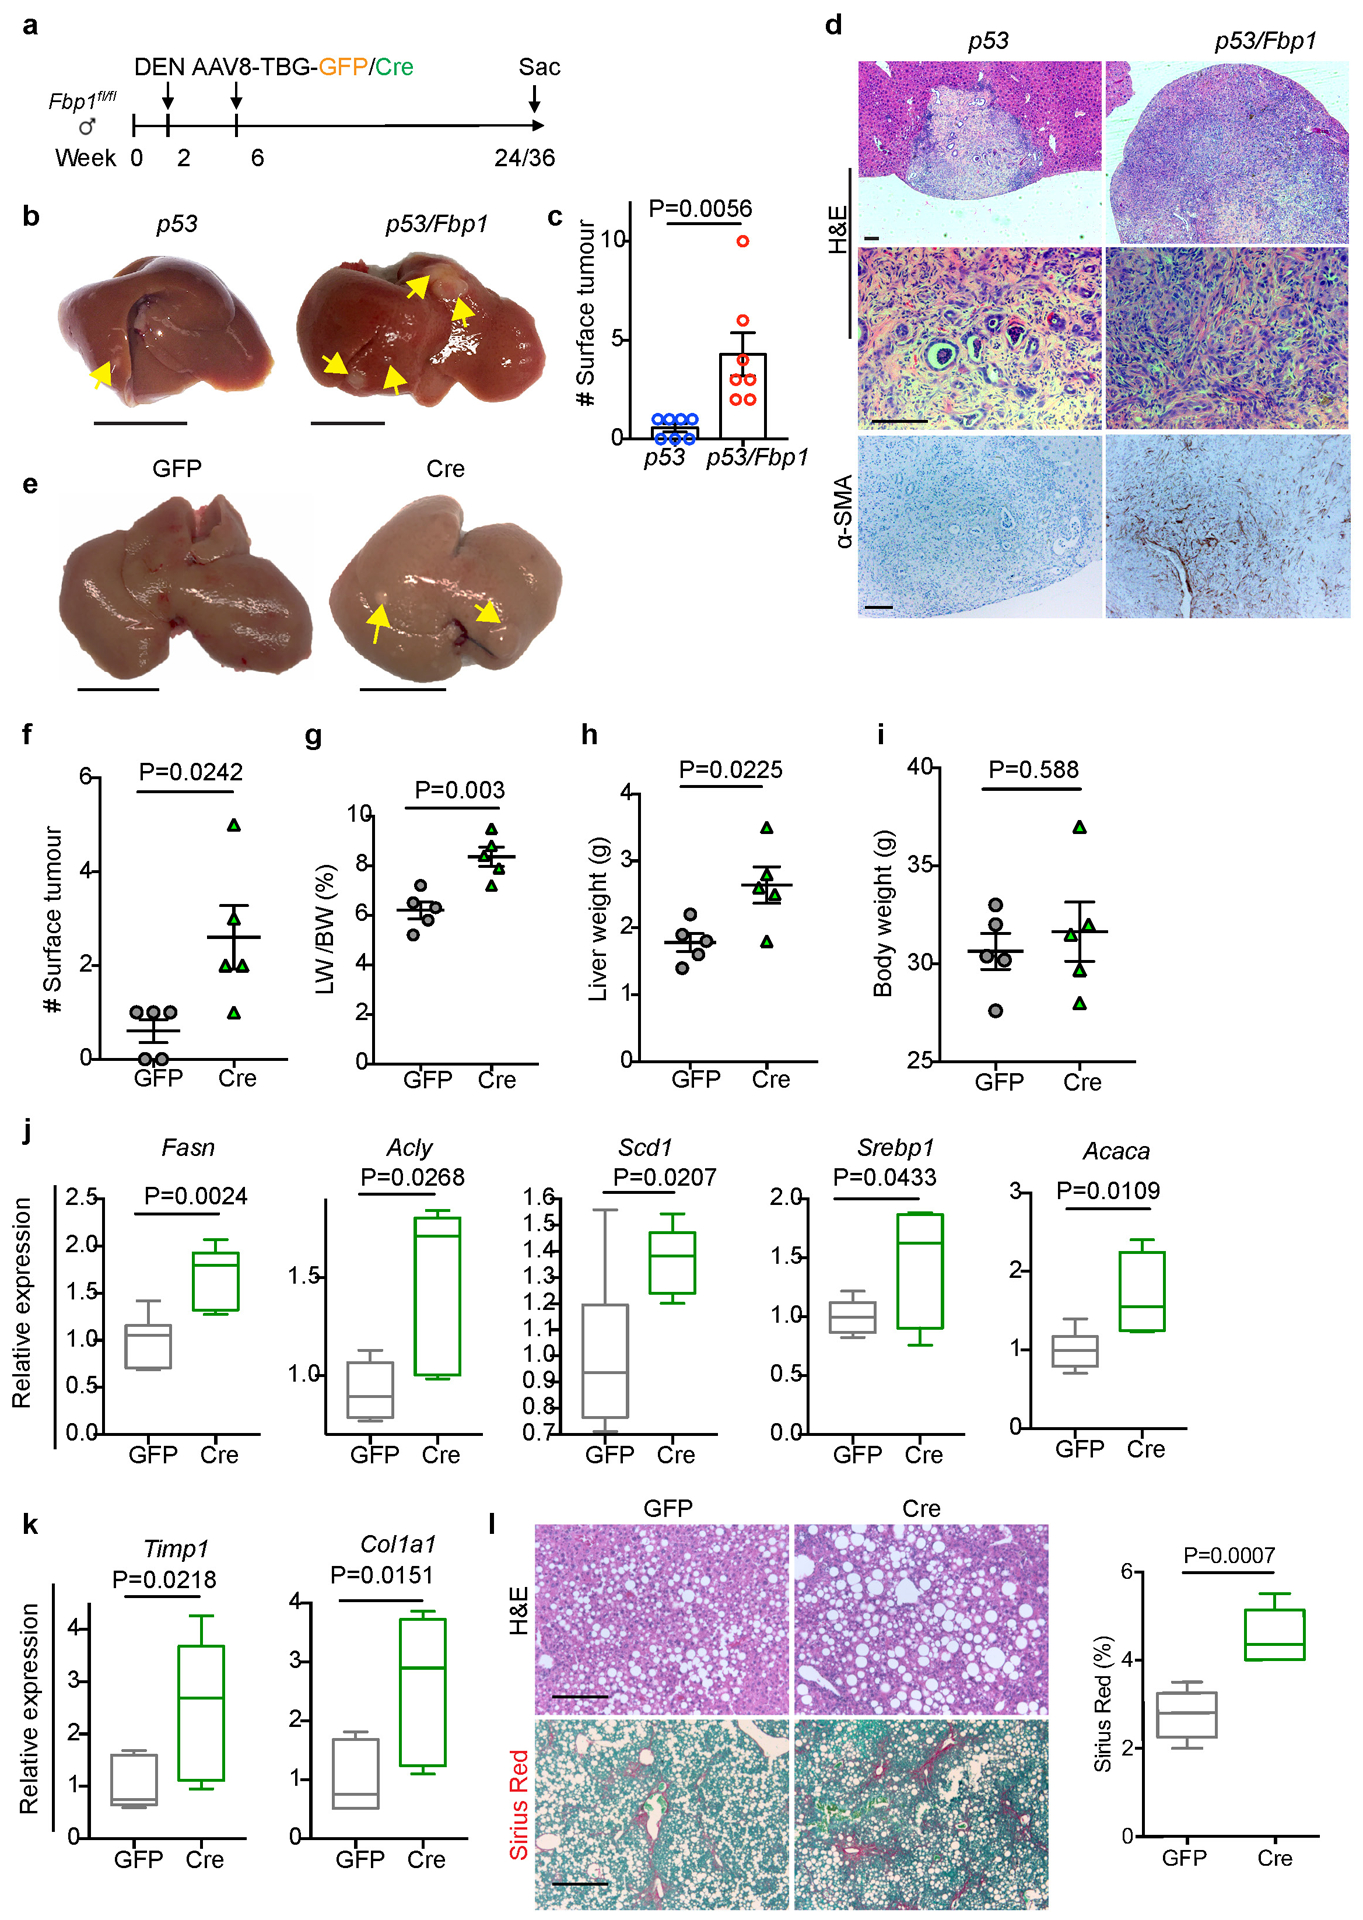
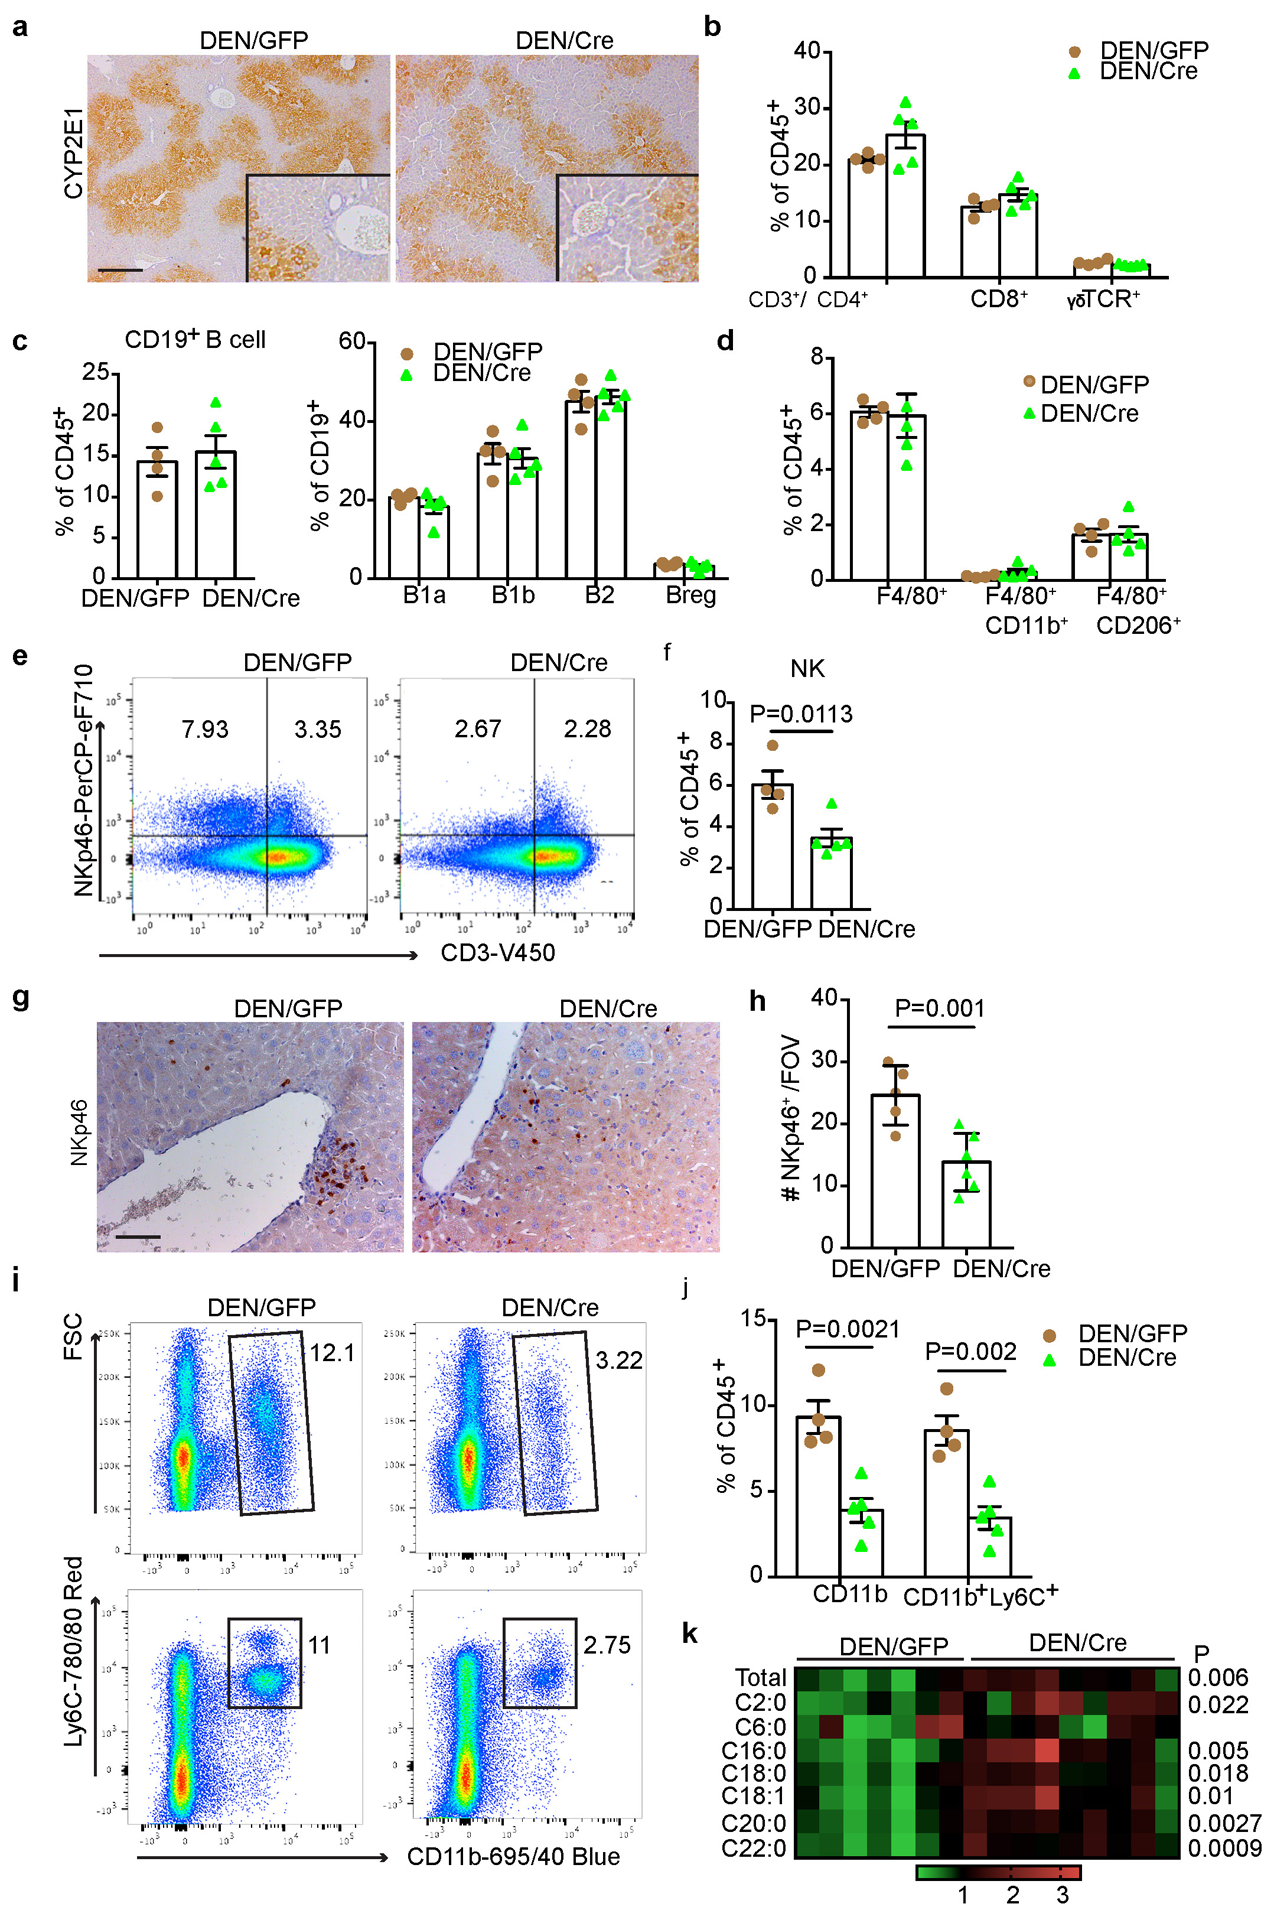
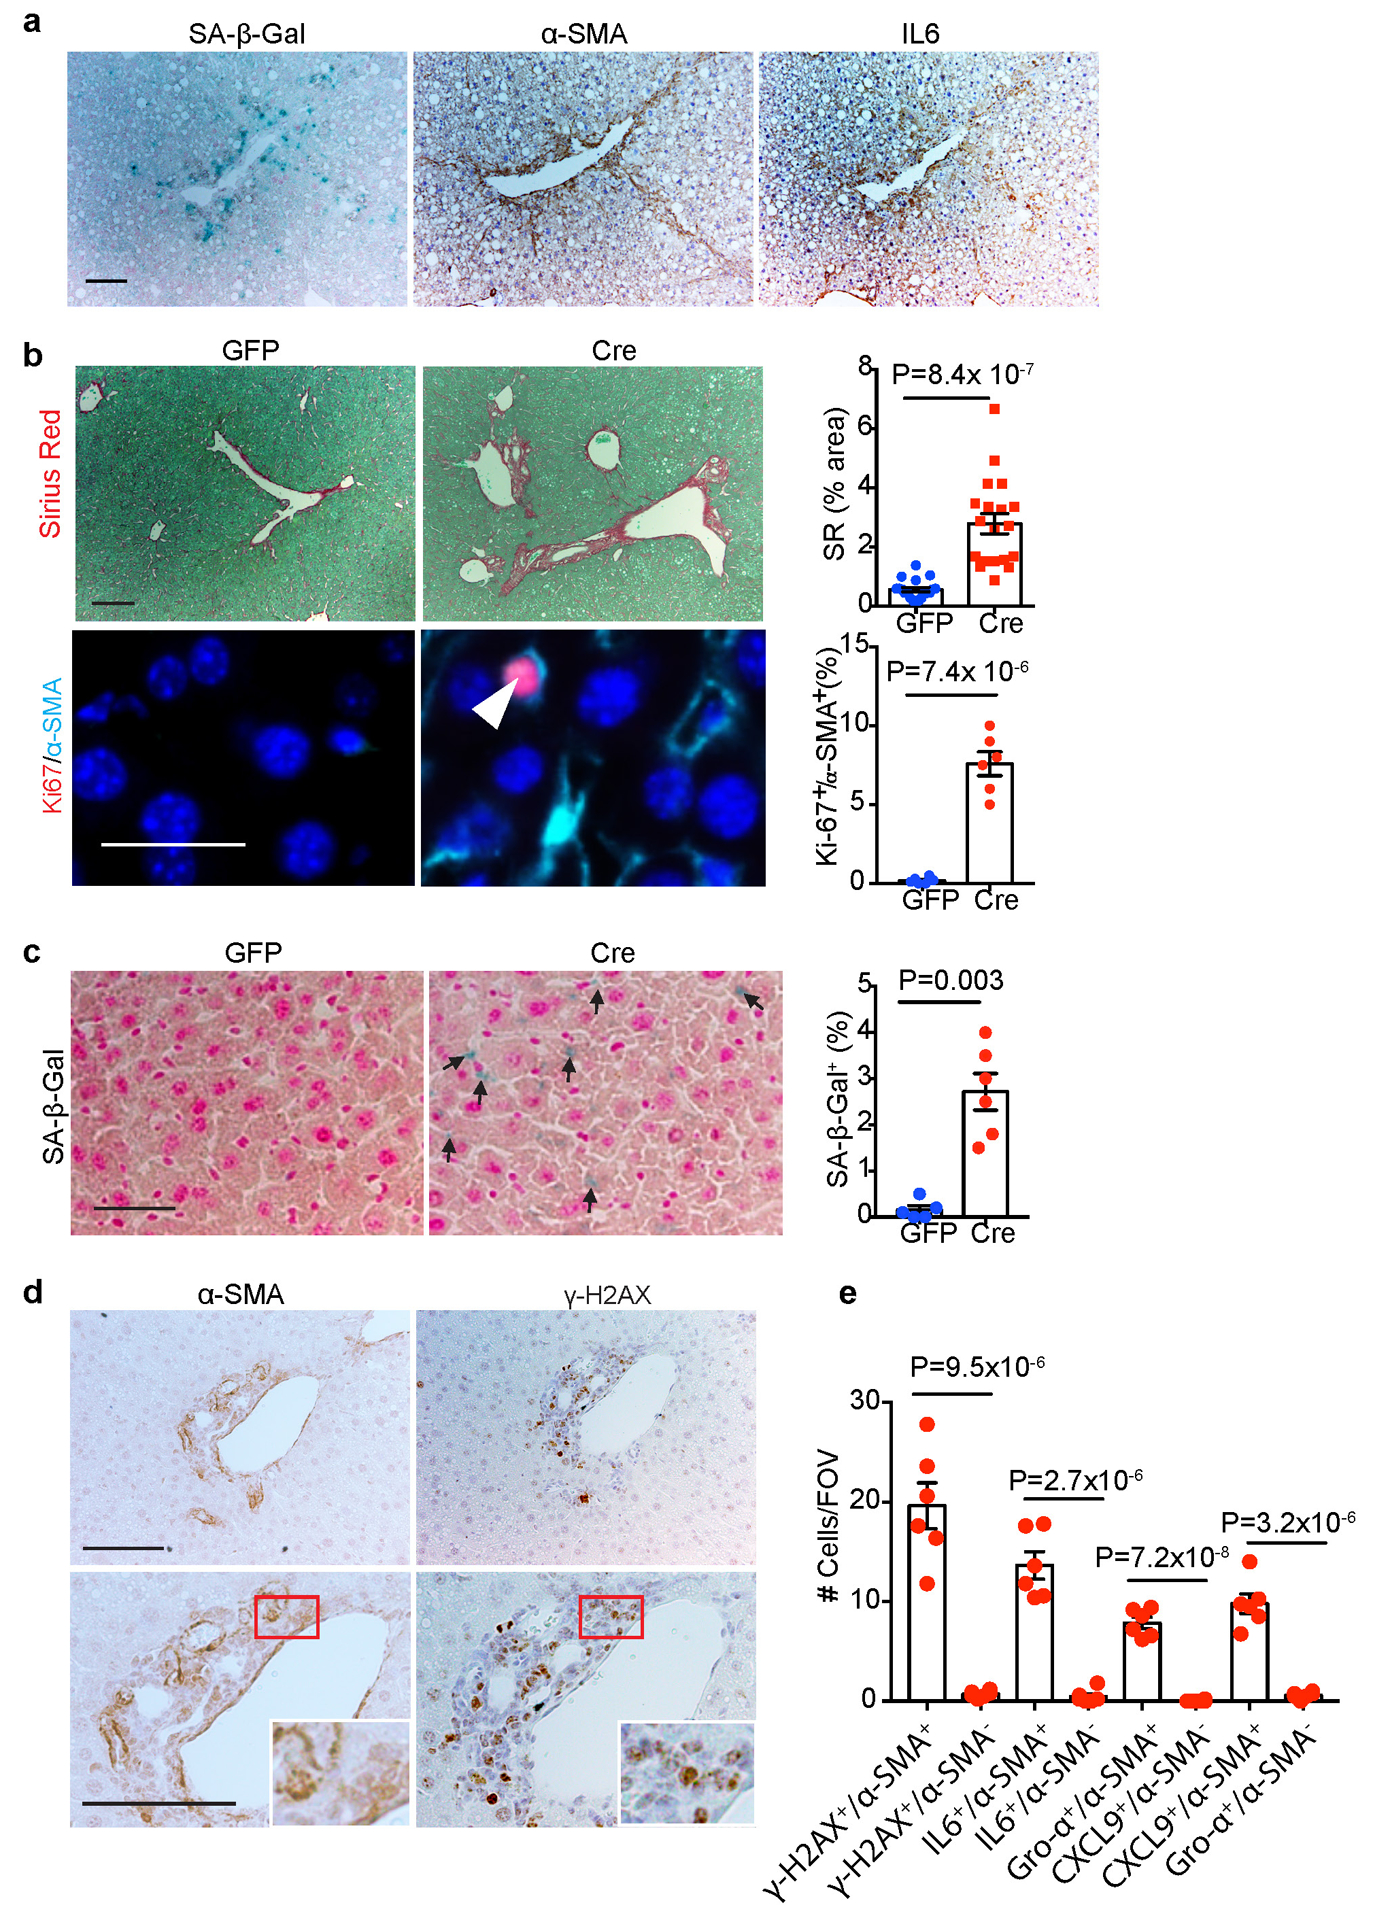
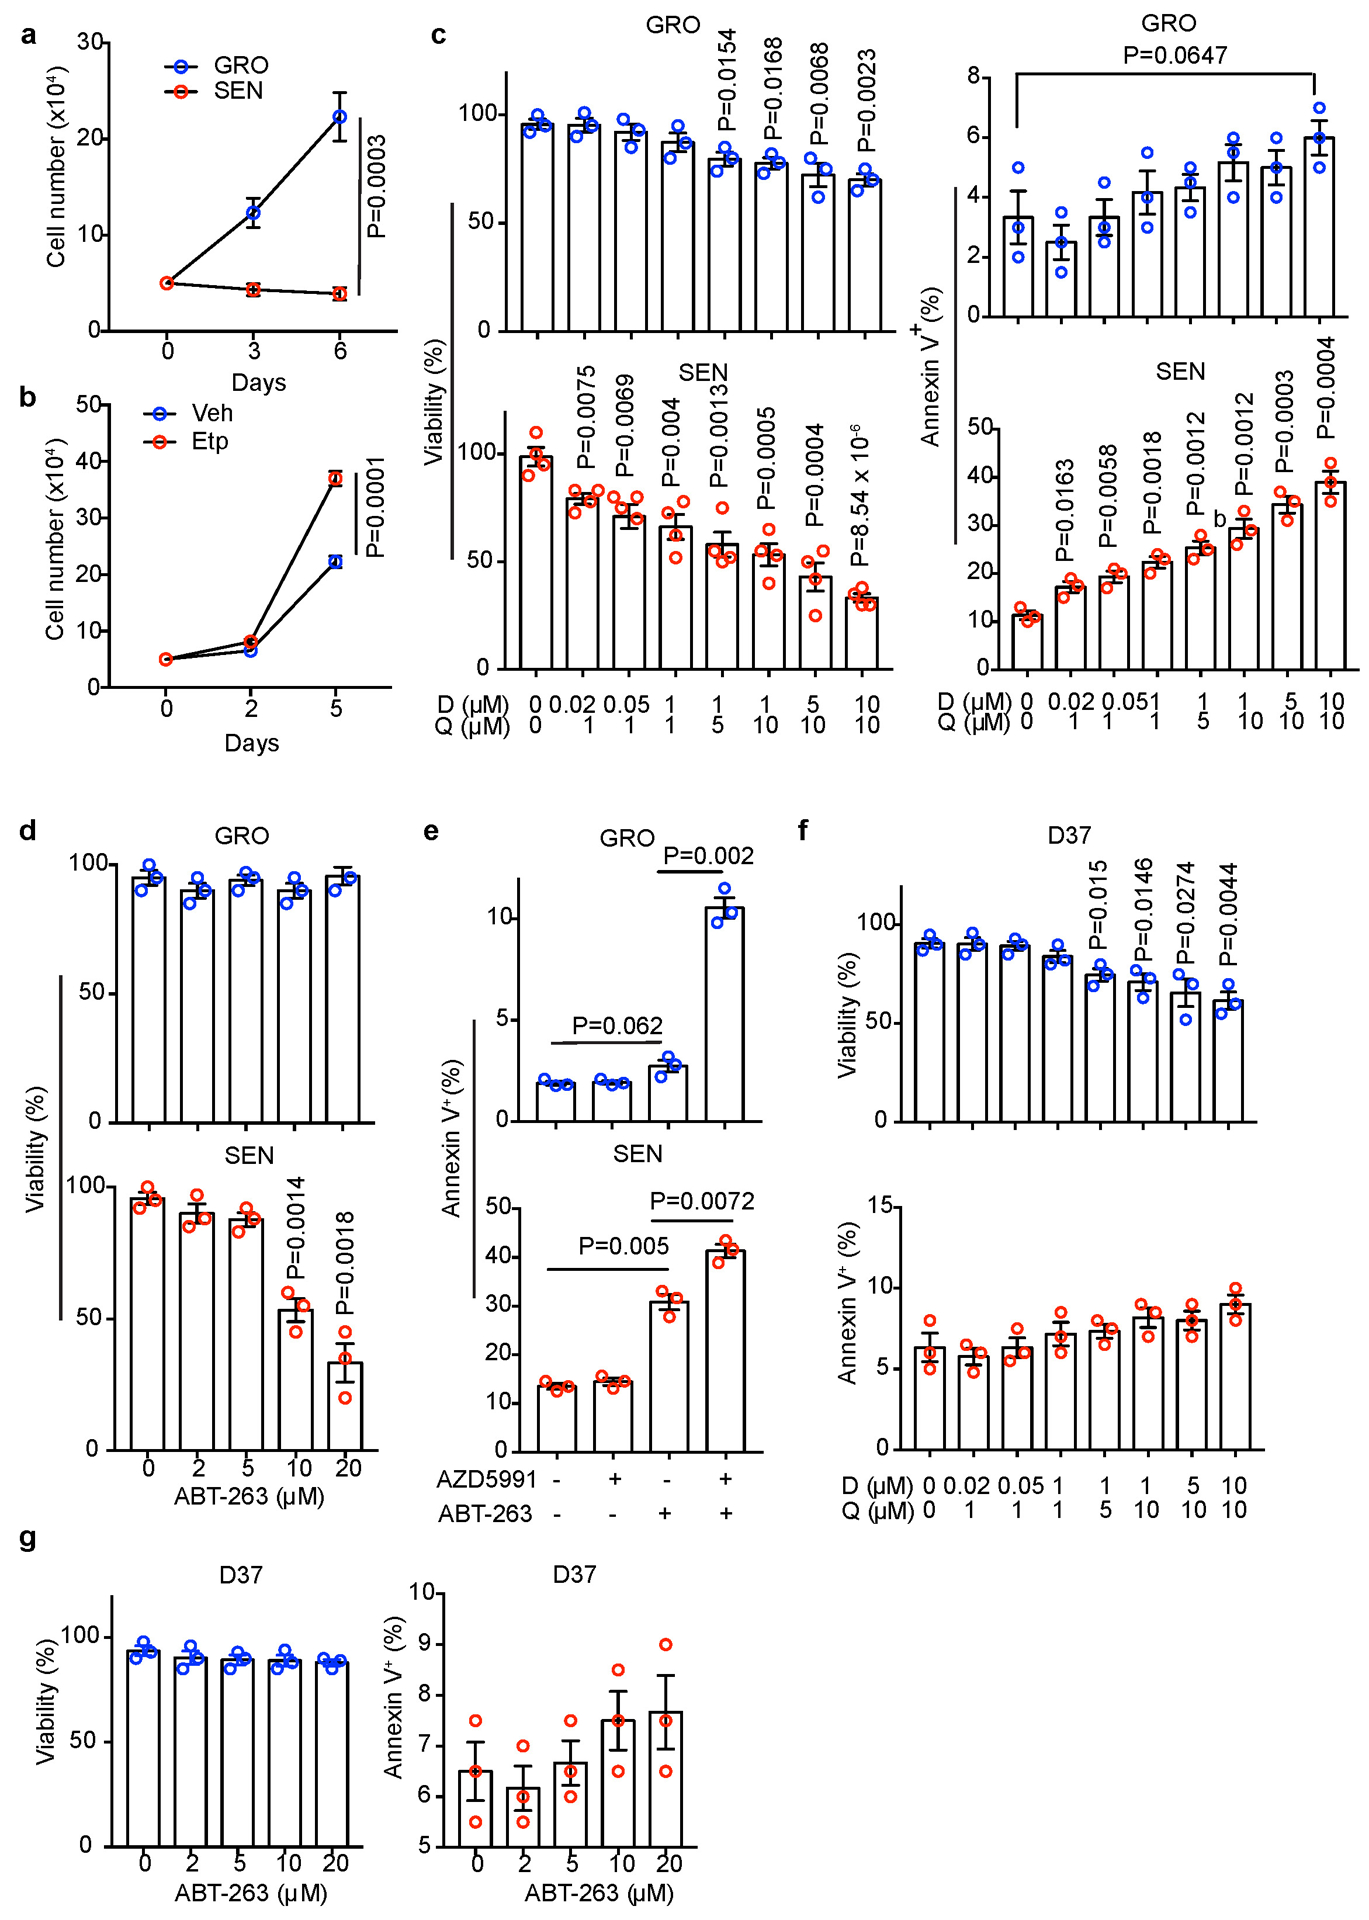
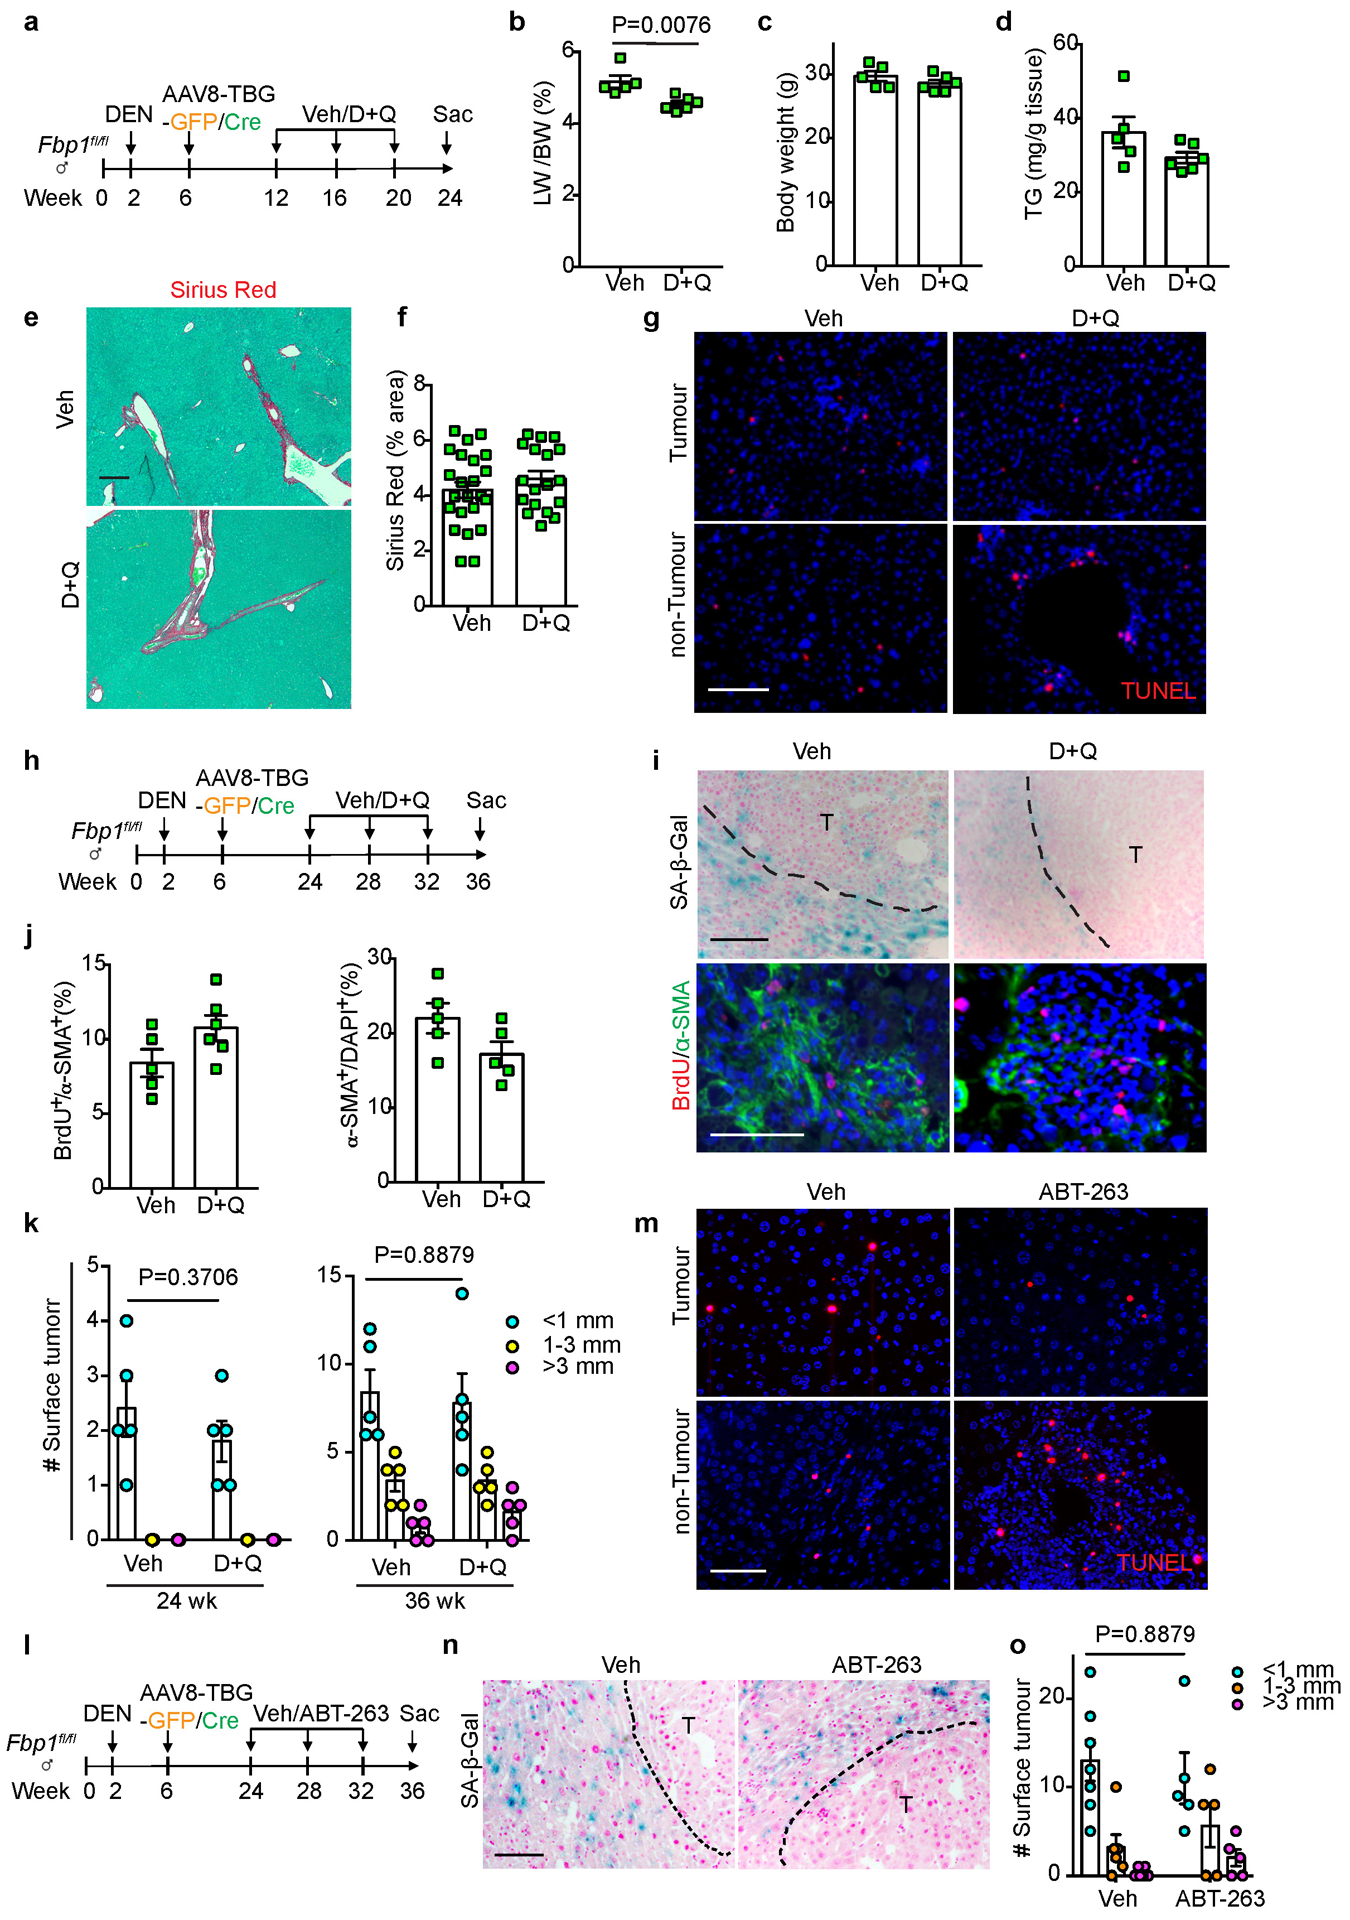
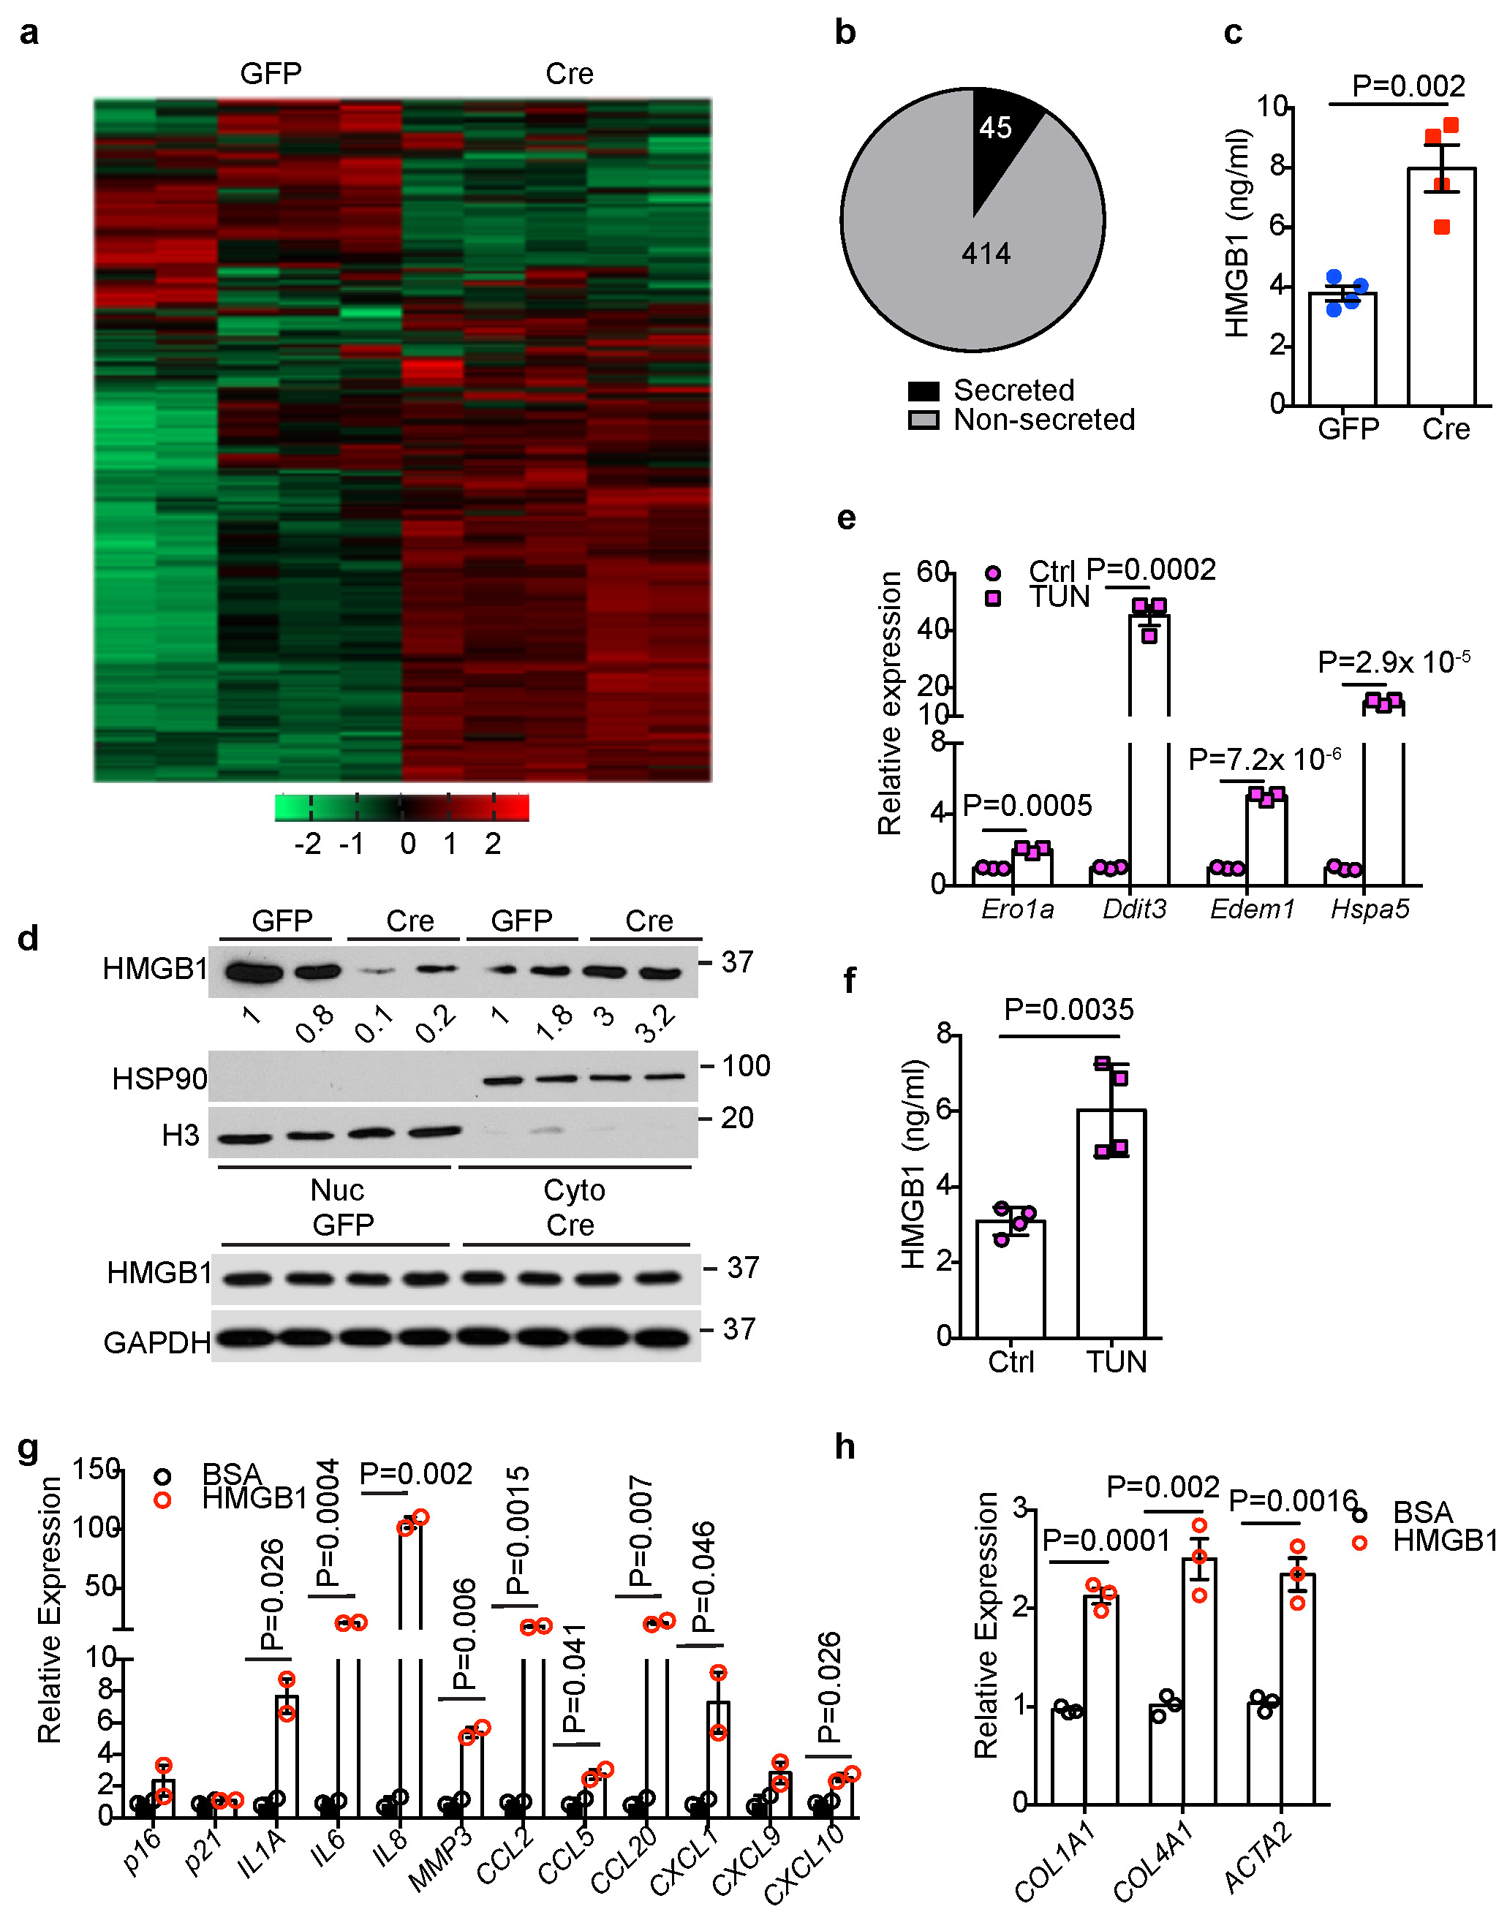
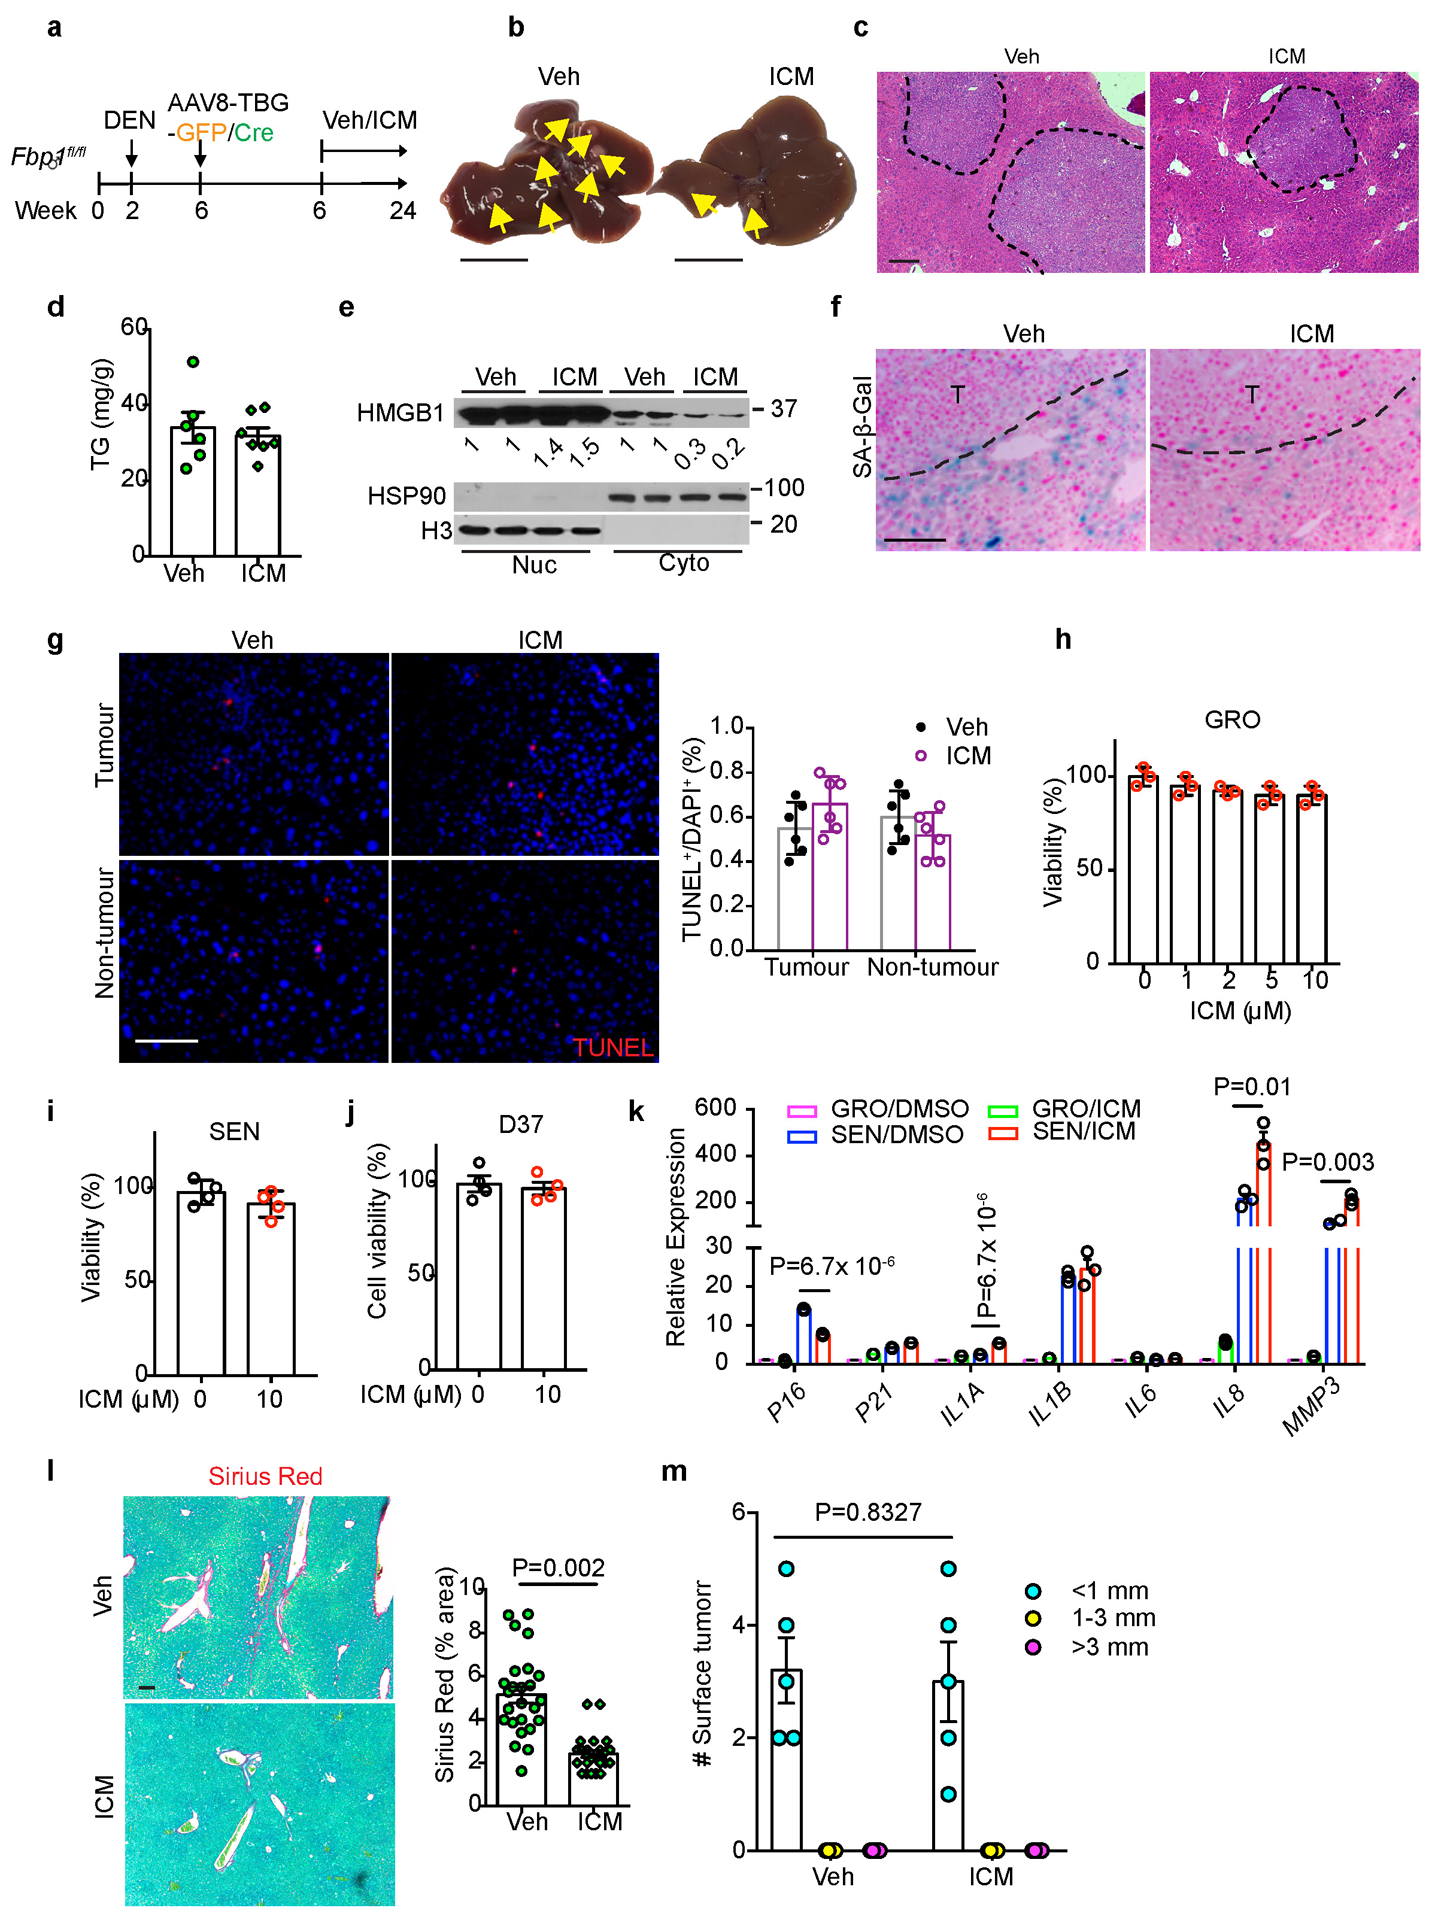
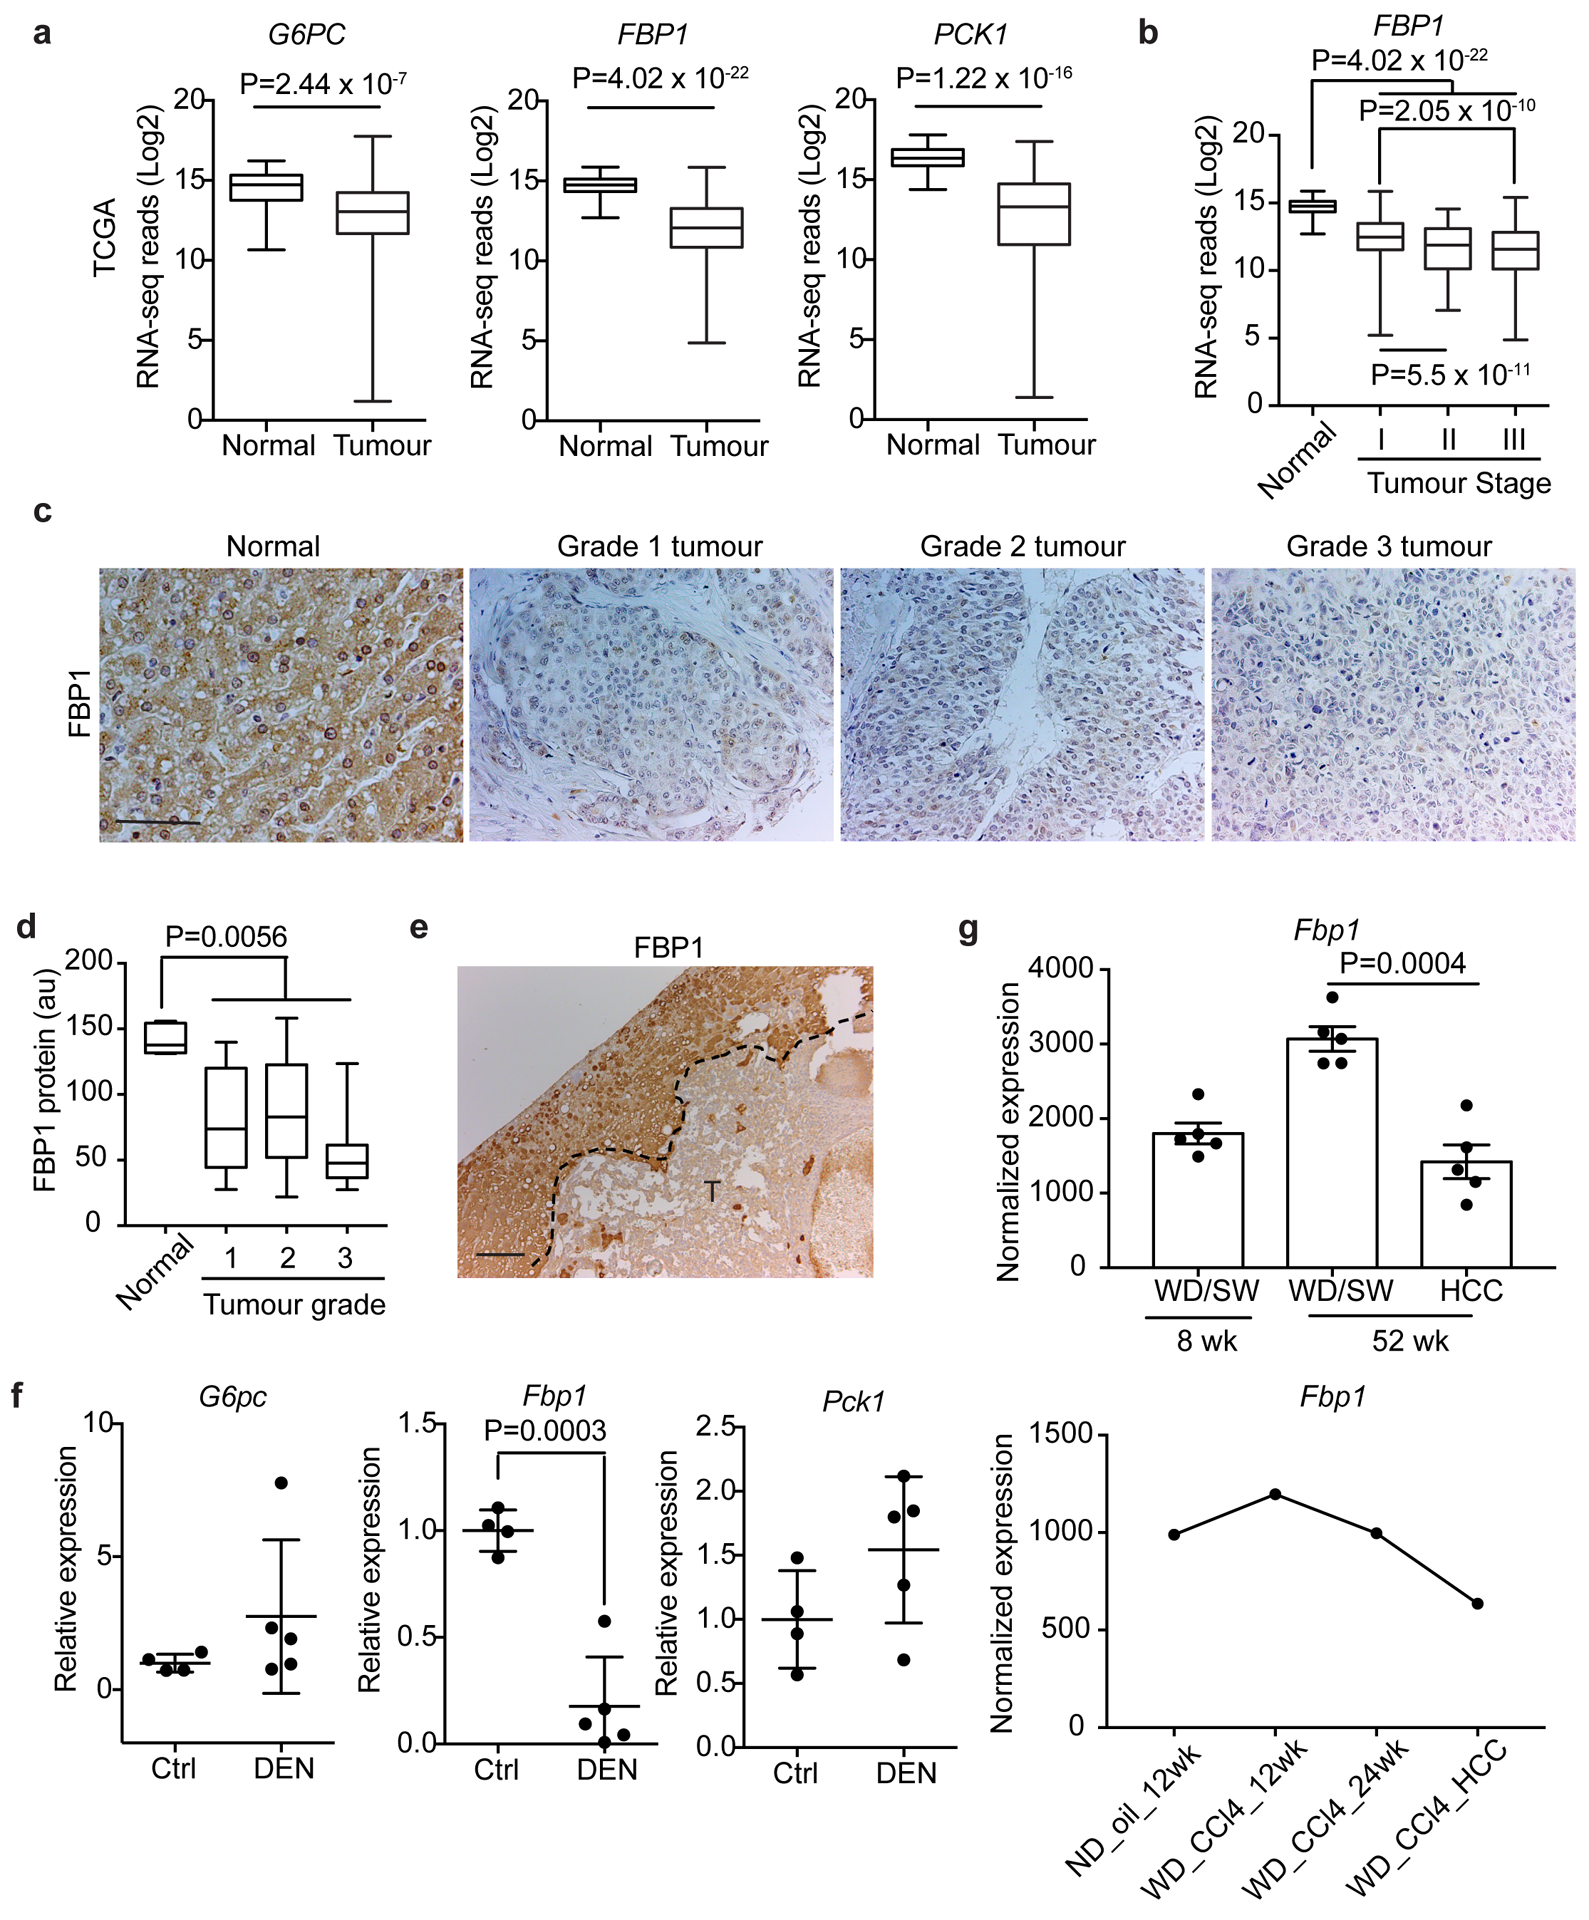
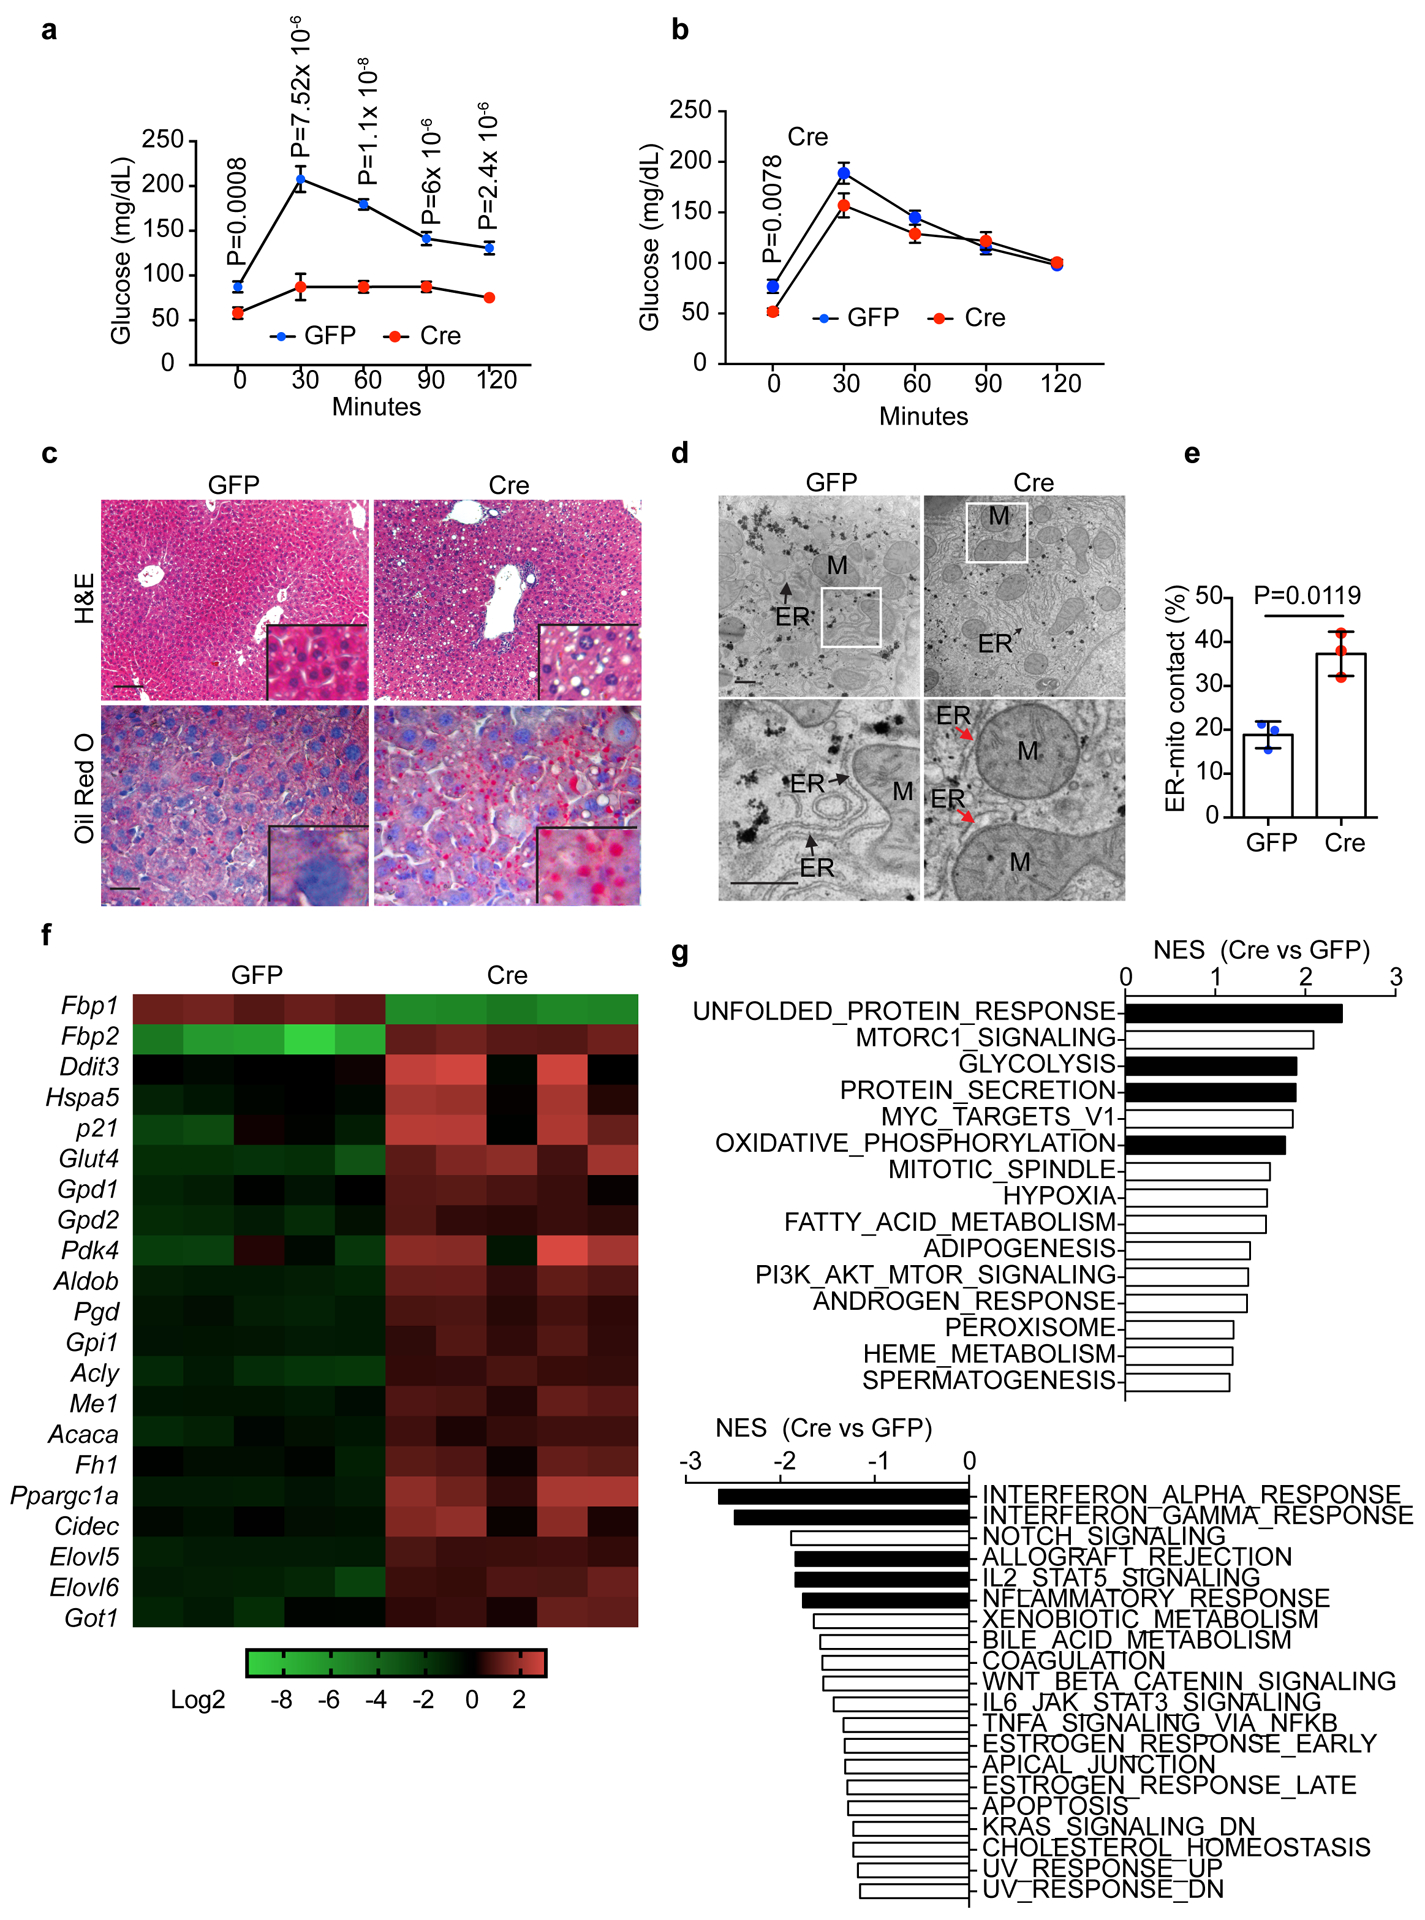
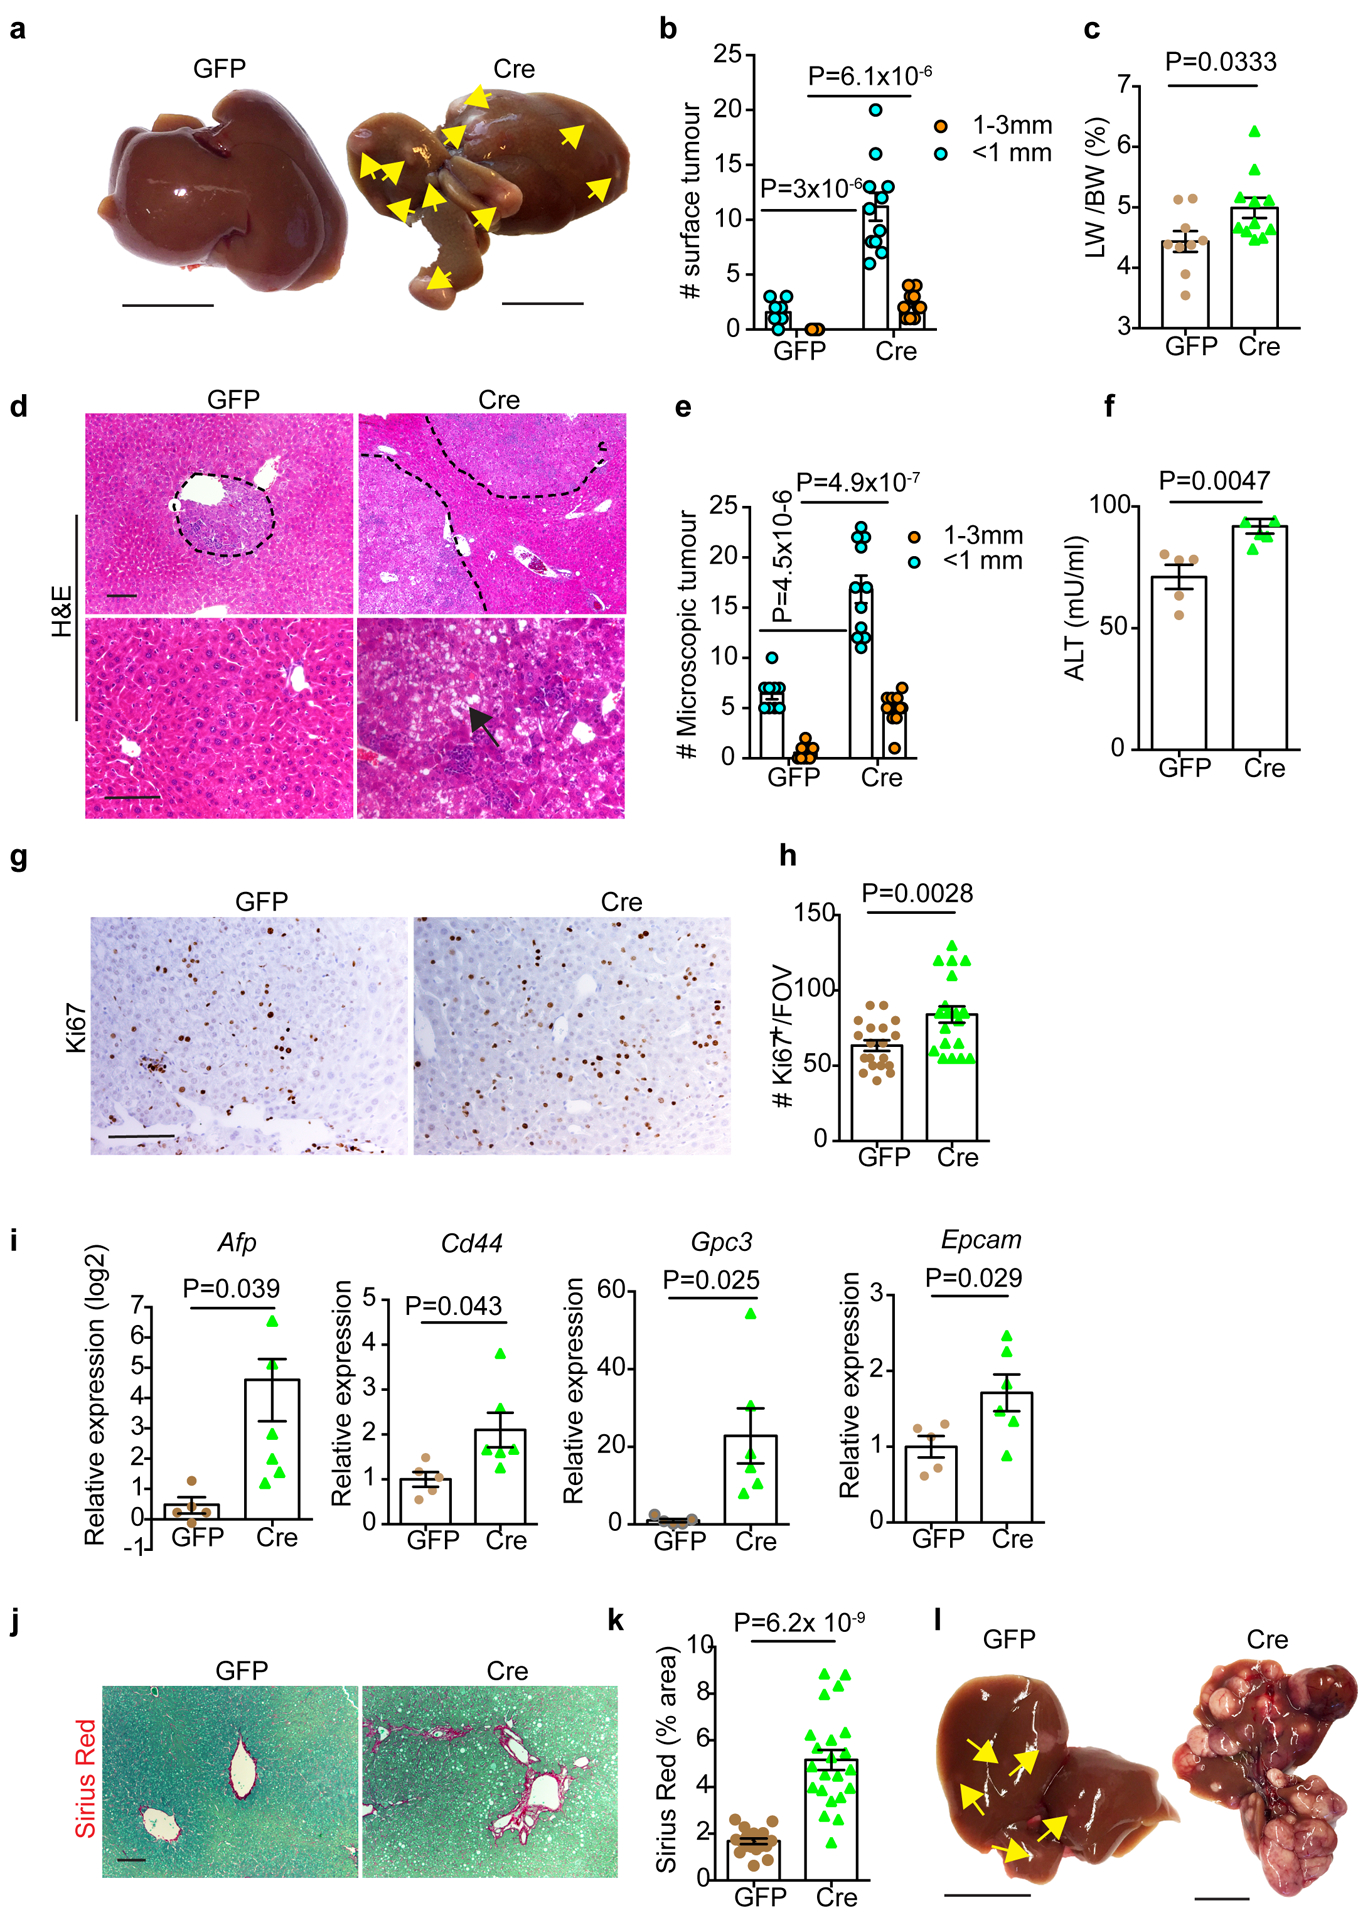
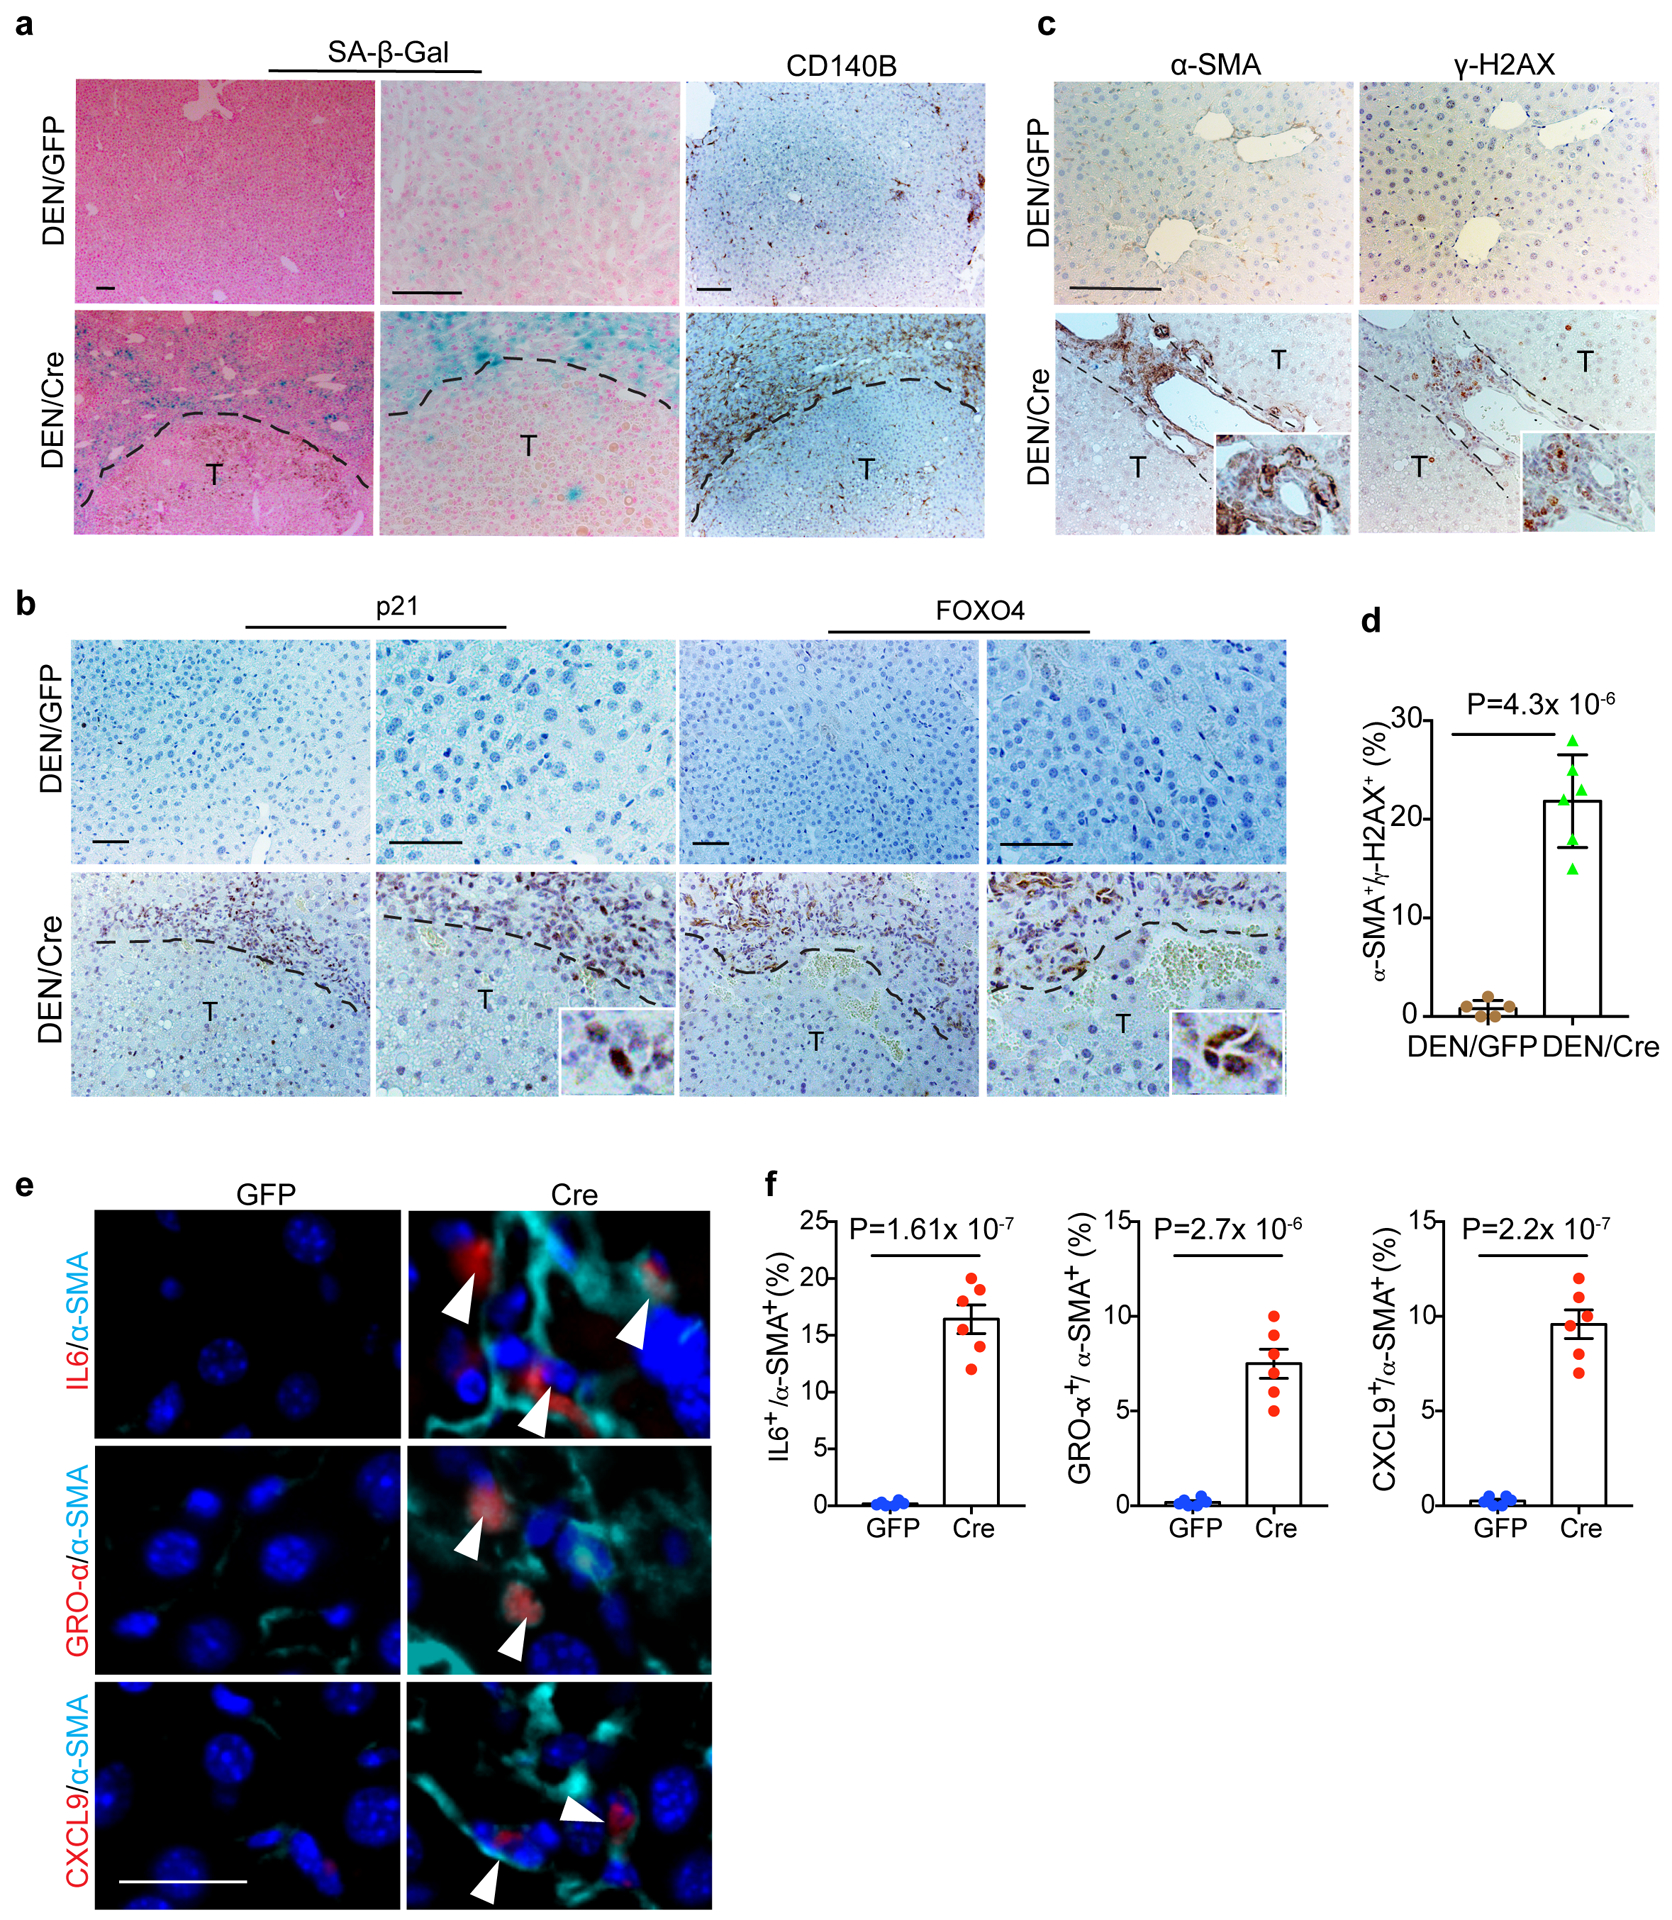
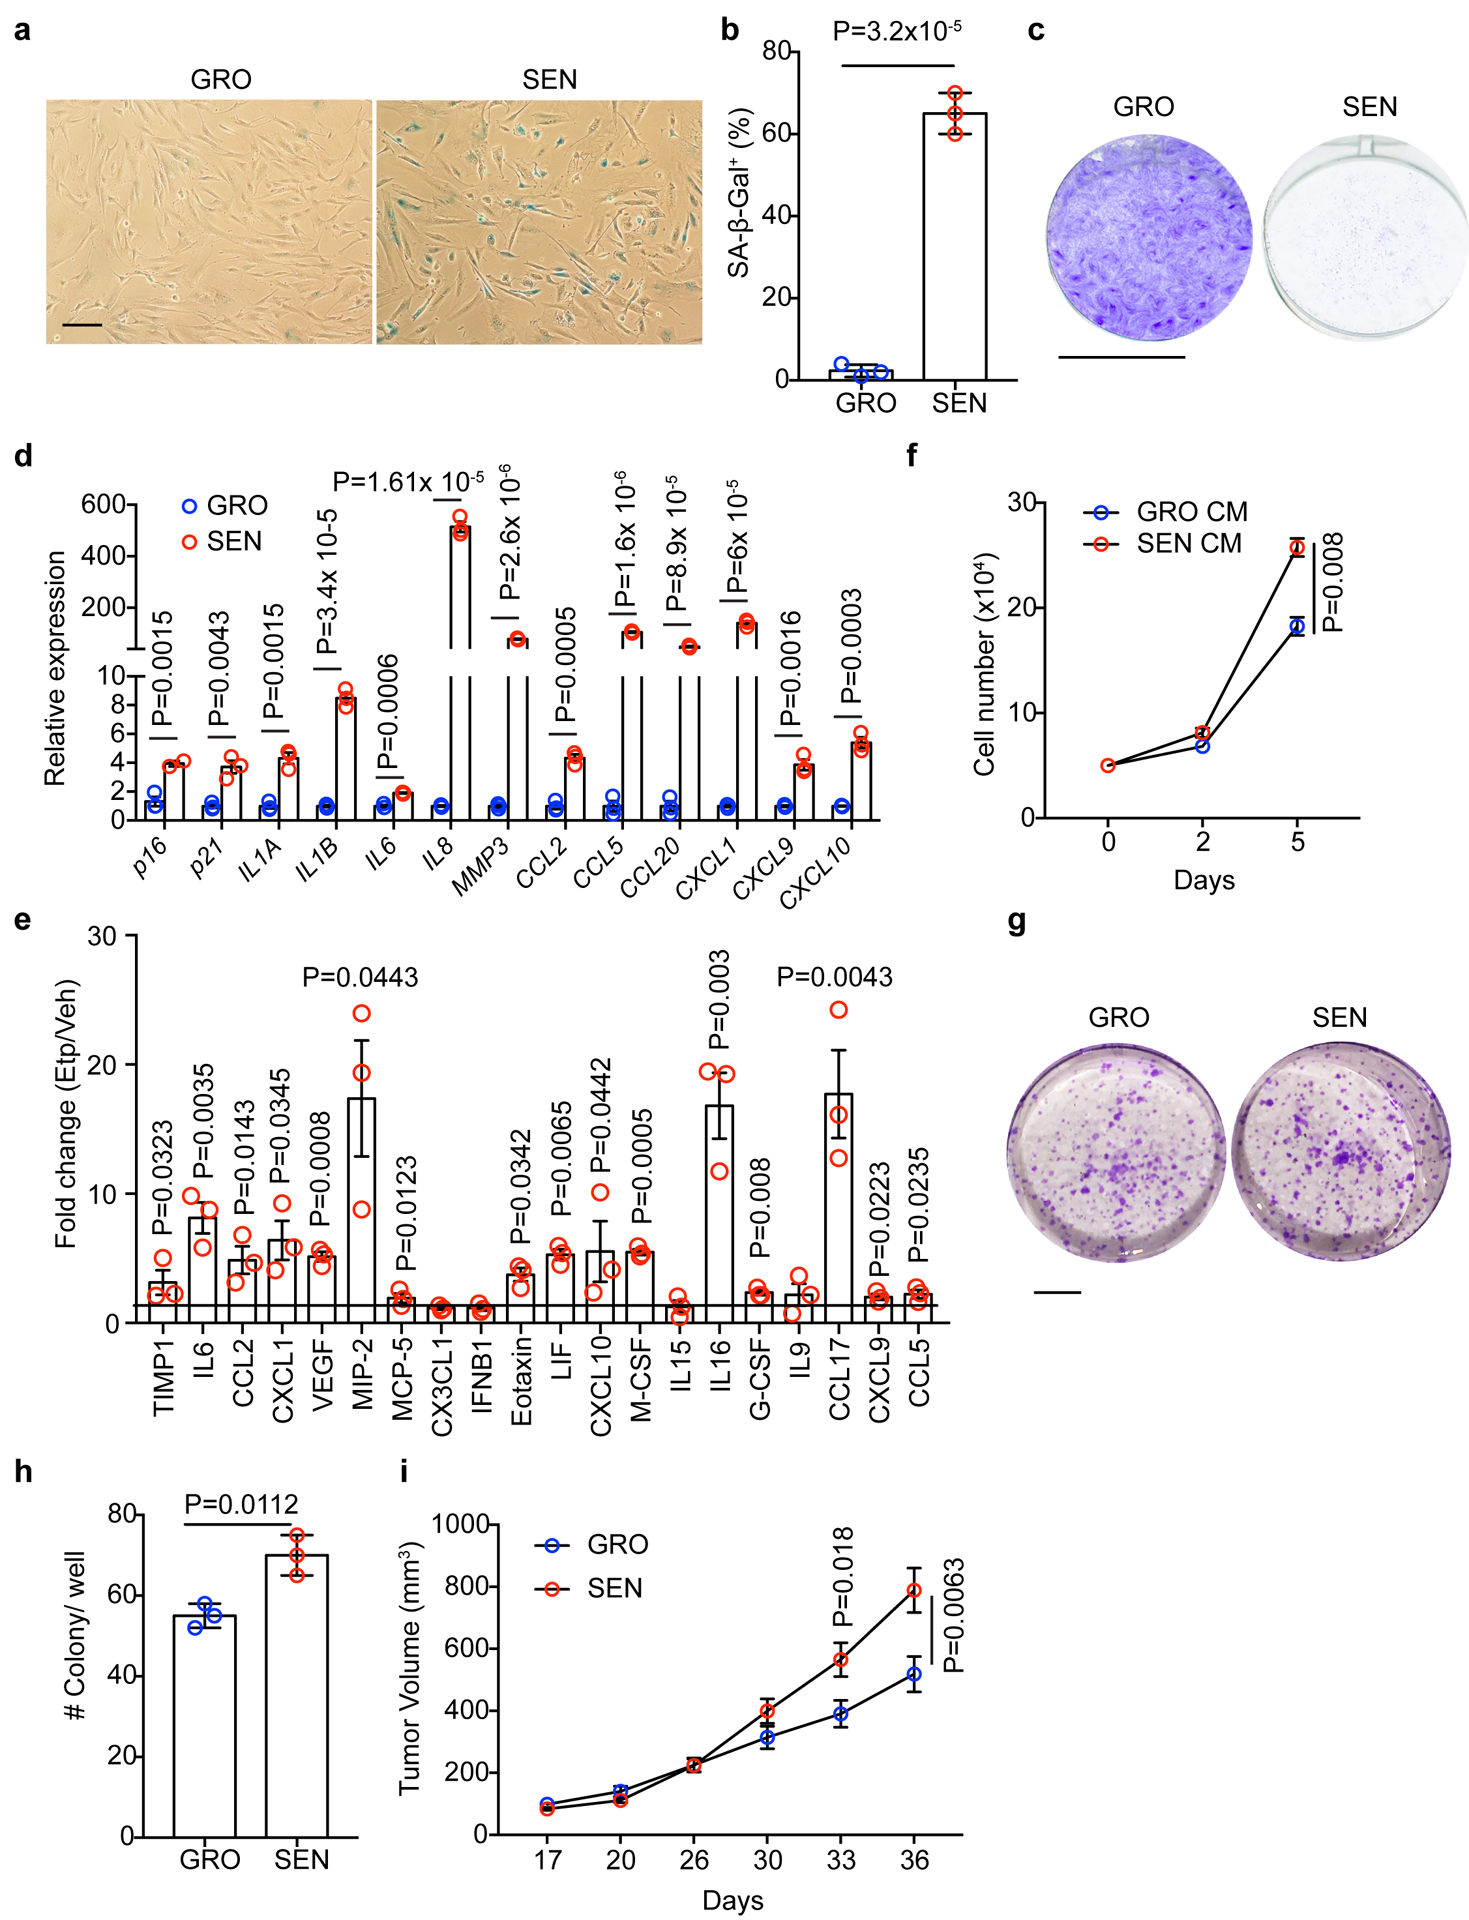
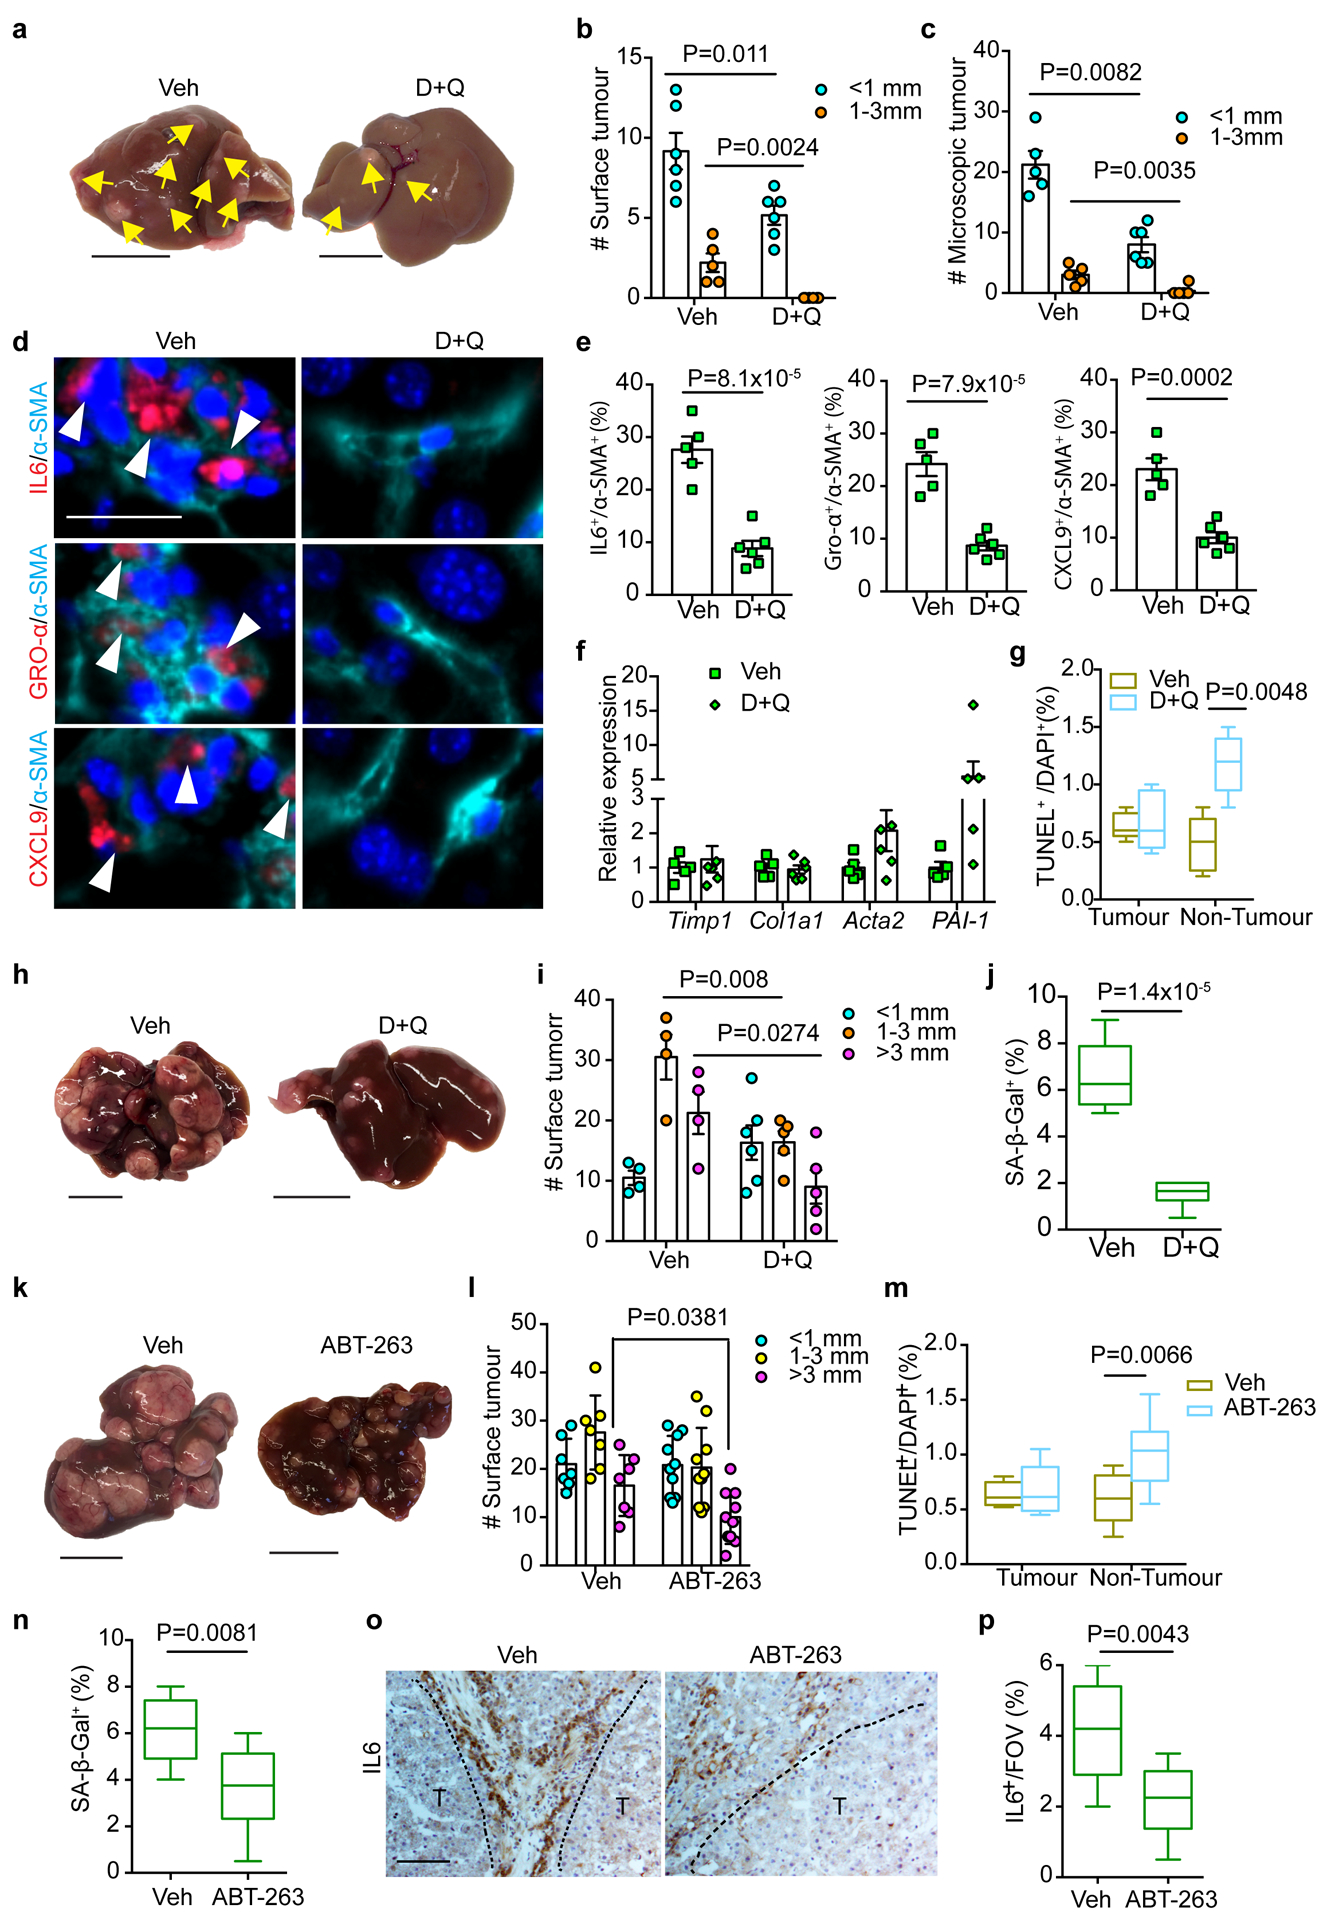
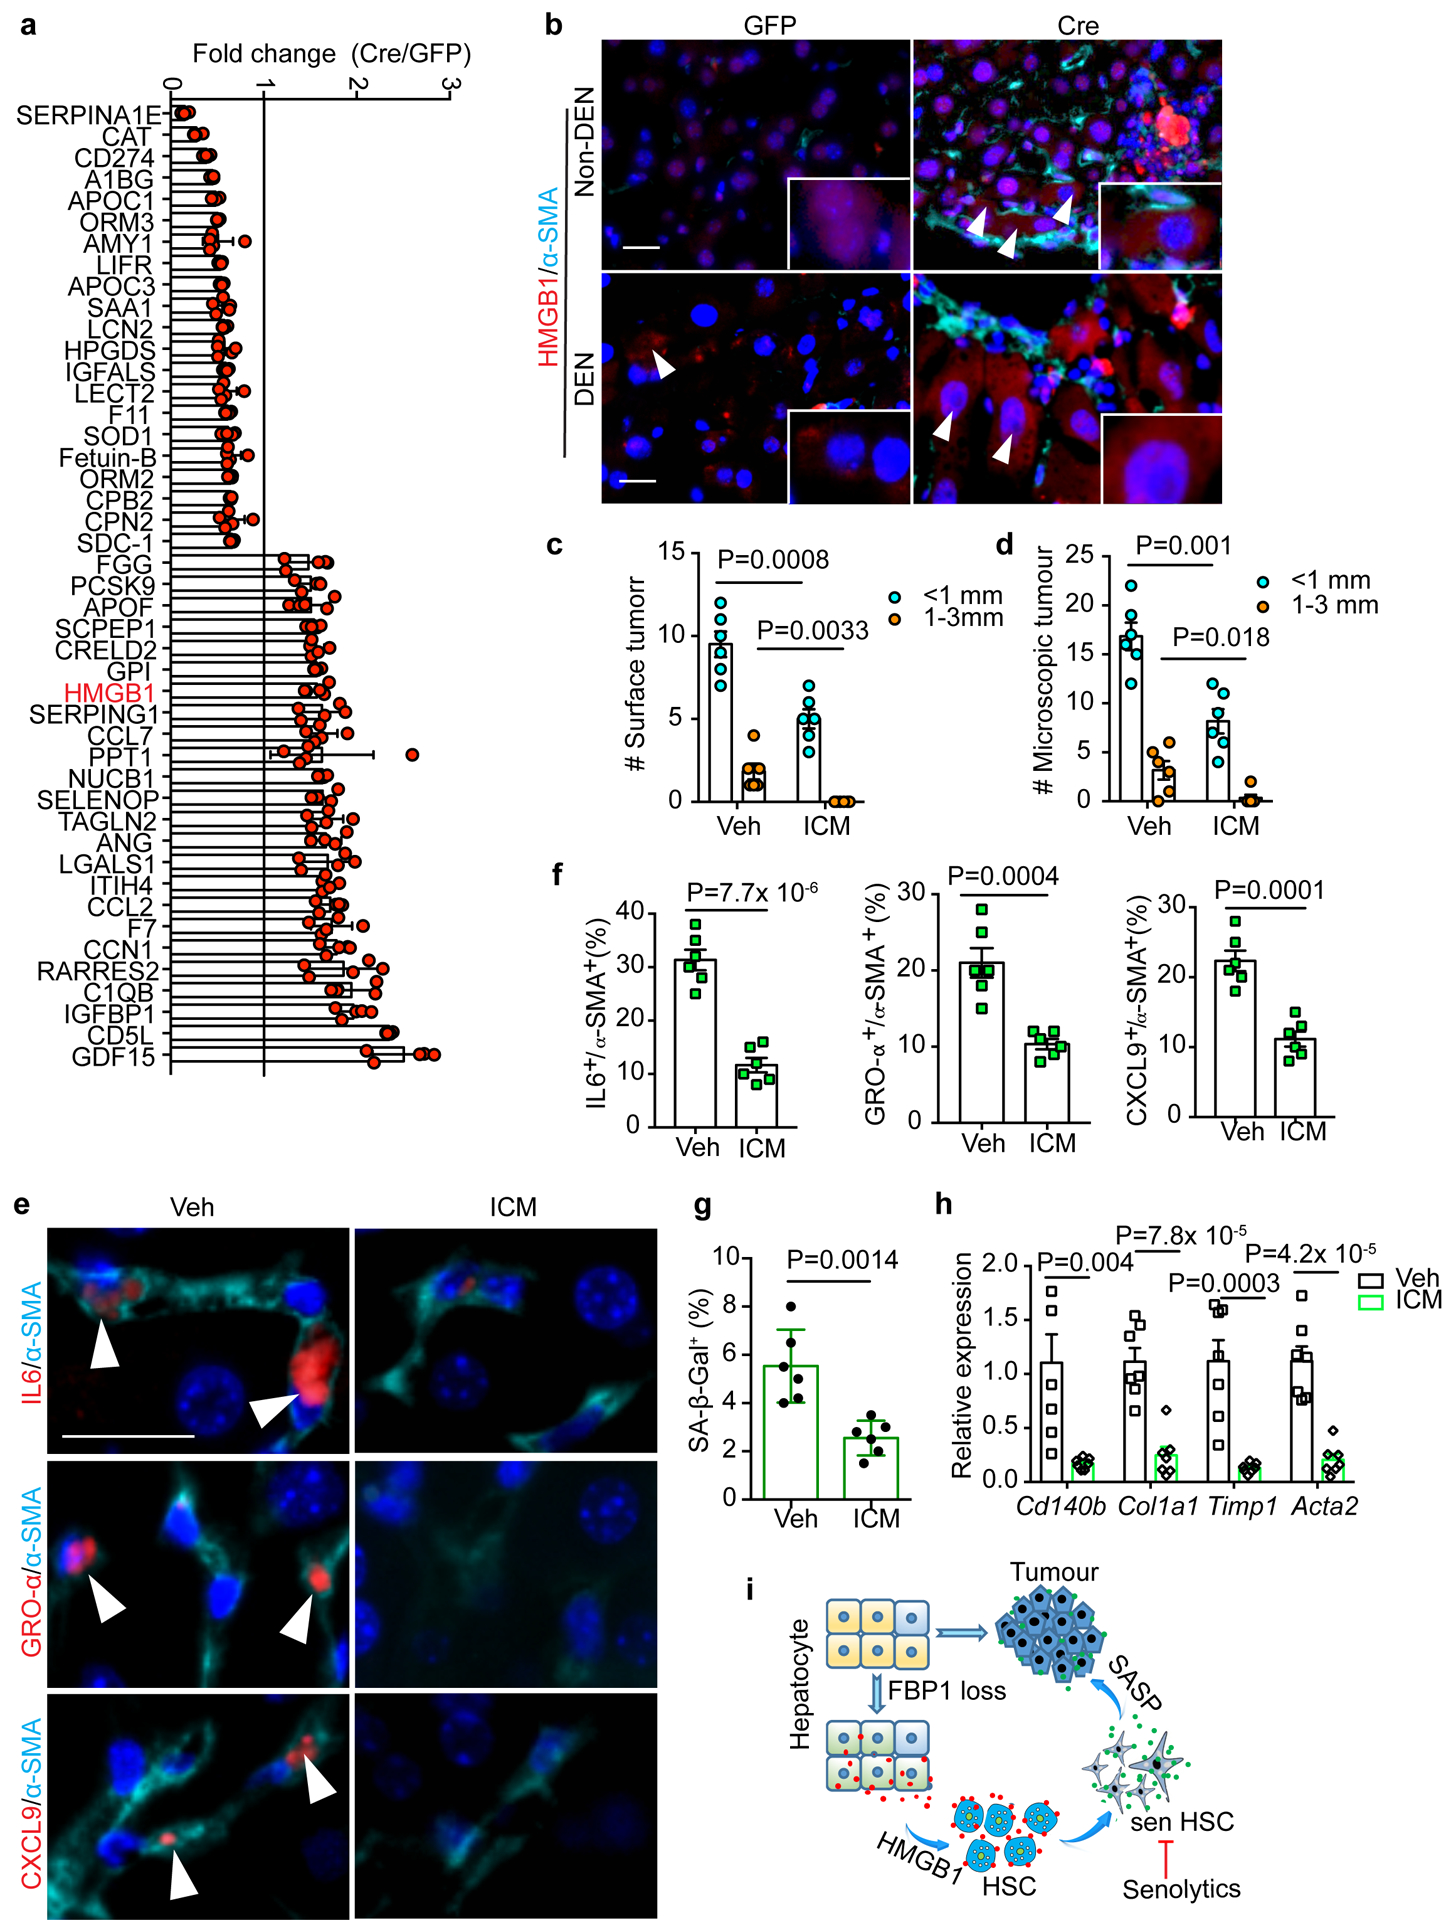
The crosstalk between deregulated hepatocyte metabolism and cells within the tumour microenvironment, as well as the consequent effects on liver tumorigenesis, are not completely understood. We show here that hepatocyte-specific loss of the gluconeogenic enzyme fructose 1,6-bisphosphatase 1 (FBP1) disrupts liver metabolic homeostasis and promotes tumour progression. FBP1 is universally silenced in both human and murine liver tumours. Hepatocyte-specific Fbp1 deletion results in steatosis, concomitant with activation and senescence of hepatic stellate cells (HSCs), exhibiting a senescence-associated secretory phenotype. Depleting senescent HSCs by 'senolytic' treatment with dasatinib/quercetin or ABT-263 inhibits tumour progression. We further demonstrate that FBP1-deficient hepatocytes promote HSC activation by releasing HMGB1; blocking its release with the small molecule inflachromene limits FBP1-dependent HSC activation, the subsequent development of the senescence-associated secretory phenotype and tumour progression. Collectively, these findings provide genetic evidence for FBP1 as a metabolic tumour suppressor in liver cancer and establish a critical crosstalk between hepatocyte metabolism and HSC senescence that promotes tumour growth.


Conflict of interest statement

Competing interests

The authors declare no competing financial interests.

Figures

Extended Data Fig. 1
Extended Data Fig. 1. Decreased FBP1 expression in human and murine liver tumours
(a) Metabolic gene set analysis of TCGA HCC RNA-sequencing data. A total of 374 HCC tumours and 50 adjacent normal tissues were included, and 2752 genes encoding all known human metabolic enzymes and transporters were classified according to the Kyoto Encyclopedia of Genes and Genomes (KEGG). Generated metabolic gene sets were ranked based on their median fold expression changes in HCC tumours vs normal tissue, and plotted as median ± median absolute deviation. (b) Representative FBP1 IHC staining on human liver tissue array with adjacent normal, grade 2 and 3 HCC tissues. Scale bar: 100 μm. (c) Statistical analysis of FBP1 IHC staining in (b). n=20 for normal, n=30 for grade 2, n=30 for grade 3 samples. In each box plot, the top-most line is the maximum, the top of the box is the third quartile, the centre line is the median, the bottom of the box is the first quartile and the bottom-most line is the minimum. (d) Representative H&E staining in liver sections from 24-week control (Ctrl) and DEN-treated (DEN) C57BL/6 mice (n = 3 independent experiments with similar results). T, tumour. Scale bar: 100 μm. (e) Serum alanine transaminase (ALT) activity from 24-week Ctrl and DEN mice. n=4 for Ctrl, n=5 for DEN. Graph in e show mean ± SEM, and P value was calculated using a two-tailed t-test. Numerical source data are provided in Source Data Extended Data Fig. 1.
Extended Data Fig. 2
Extended Data Fig. 2. Hepatic FBP1 loss disrupts liver metabolism in mice
(a) Scheme for generating Fbp1fl/fl mice by homologous recombination. (b) Scheme for hepatocyte-specific Fbp1 deletion in Fbp1fl/fl mice. (c) qRT-PCR analysis of gluconeogenic gene expression in 24-week GFP (n=4) and Cre (n=4) livers. (d) Immunoblotting analysis of 24-week GFP and Cre livers (n = 3 independent experiments). GAPDH was used as loading control. (e) H&E staining of 24-week GFP and Cre kidney sections (n = 3 independent experiments). Scale bar: 100 μm. (f) Immunoblotting analysis of 24-week GFP (n=2) and Cre (n=2) kidneys. GAPDH was used as loading control. (g) qRT-PCR analysis of gluconeogenic gene expression in 24-week GFP (n=4) and Cre (n=4) kidneys. (h) Serum free fatty acid (FFA) and β-hydroxybutyrate (BHBA) levels of fasted (16-h) and refed (4-h) GFP (n=7) and Cre (n=8) mice (24-week). (i) Liver gross appearance of 16-h fasted animals (24-week) (n = 3 independent experiments). (j, k) qRT-PCR analysis of lipid metabolism (j) and unfolded protein response (UPR) (k) gene signatures in 16-h fasted GFP (n=5) and Cre (n=5) livers (24-week). In each box plot, the top-most line is the maximum, the top of the box is the third quartile, the centre line is the median, the bottom of the box is the first quartile and the bottom-most line is the minimum. (l) Growth rates of GFP and Cre mice. GFP: n=5 for female or male mice, Cre: n=5 for female, n=8 for male mice. (m, n) Quantification of triglyceride (TG) (m) and Oil Red O staining (% area) (n) in 24-week GFP (n=6) and Cre (n=5) mouse livers. Graphs in c, g, h, l-n show mean ± SEM. All P values were calculated using a two-tailed t-test. Scanned images of unprocessed blots in c and e are shown in Source Data Extended Data Fig.2. Numerical source data are provided in Source Data Extended Data Fig. 2.
Extended Data Fig. 3
Extended Data Fig. 3. Hepatic FBP1 loss promotes tumour progression in p53fl/fl and NAFLD models
(a) Scheme for Fbp1 deletion in DEN-induced liver cancer model. b, Gross liver appearance and tumour multiplicity in 80-week p53 and p53/Fbp1 mice treated with AAV8-TBG-Cre. Yellow arrows indicate liver tumours. Scale bar: 1 cm. (c) Quantification of surface tumour numbers in p53 and p53/Fbp1 animals in (b). n=7 mice for p53 or p53/Fbp1 cohorts. 4 of 7 p53 mice and 7 of 7 p53/Fbp1 mice had surface tumours. (d) Representative H&E staining and α-SMA IHC staining of liver sections from 80-wk p53 and p53/Fbp1 mice (n=3 independent experiments). Scale bar: 100 μm. (e) Gross liver appearances of 32-wk GFP and Cre mice with diet- and CCl4-induced NAFLD (see Materials and Methods for details). Scale bar: 1 cm. (f-i) Quantification of surface tumour number (f), liver-to-body weight ratio (g), liver weight (h) and body weight (i) in 32-wk GFP (n=5) and Cre (n=5) mice with NAFLD. (j, k) qRT-PCR analysis of lipogenic (j) and fibrotic (k) gene expression from 32-wk GFP (n=5) and Cre (n=5) mouse livers with NAFLD. (l) Representative H&E staining, Sirius Red staining of 32-wk GFP and Cre NAFLD mouse liver sections (n=3 independent experiments). Scale bar: 100 μm. (m) Quantification of Sirius Red staining in (l). n=5 mice for each group. All graphs represent the mean ± SEM. In each box plot of j, k and m, the top-most line is the maximum, the top of the box is the third quartile, the centre line is the median, the bottom of the box is the first quartile and the bottom-most line is the minimum. Graphs in c, f-I show mean ± SEM. All P values were calculated using a two-tailed t-test. Numerical source data are provided in Source Data Extended Data Fig. 3.
Extended Data Fig. 4
Extended Data Fig. 4. Impact of hepatic FBP1 loss on tumour microenvironment in DEN mice
(a) Representative CYP2E1 IHC staining in liver sections from 24-week DEN/GFP and DEN/Cre mice (n=3 independent experiments). Scale bar: 100 μm. (b) Flow cytometry quantification of T cell subpopulations in 24-week DEN/GFP (n=4) and DEN/Cre (n=5) livers. (c) Flow cytometry quantification of B cells and B cell subpopulations in 24-week DEN/GFP (n=4) and DEN/Cre (n=5) livers. (d) Flow cytometry quantification of total macrophages and CD11b+ or CD206+ subsets in 24-week DEN/GFP (n=4) and DEN/Cre (n=5) livers. (e, f) Representative flow cytometry plots (e) and quantification (f) (% CD45+ cells) of NK cells (CD3NKp46+) in 24-week DEN/GFP (n=4) and DEN/Cre (n=5) livers. (g, h) Representative NKp46 IHC staining (g) and quantification (h) in 24-wk DEN/GFP (n=4) and DEN/Cre (n=5) liver sections. Scale bar: 100 μm. (i, j) Representative flow cytometry plots (i) and quantification (j) (% CD45+ cells) of MDSC cells (CD11b+Ly6C+) in 24-week DEN/GFP (n=4) and DEN/Cre (n=5) livers. (k) A heatmap showing relative abundance of individual ceramide species in 24-wk DEN/GFP (N=7) and DEN/Cre (n=9) mouse livers by lipidomic profiling. Graphs in b-d, f, h and j show mean ± SEM, and P values were calculated using a two-tailed t-test. Numerical source data are provided in Source Data Extended Data Fig. 4.
Extended Data Fig. 5
Extended Data Fig. 5. Hepatic FBP1 loss leads to HSC activation and senescence
(a) Representative SA-β-Gal staining, α-SMA and IL6 IHC staining of serial cryosections from 36-week mouse livers (n=3 independent experiments). Scale bar: 100 μm. (b) Representative Sirius Red staining and quantification, Ki67/α-SMA IF staining and quantification of 24-week non-DEN liver sections. For Sirius Red staining quantification, n=20 fields of view (FOV, 200x) from 6 mice for GFP, n=18 fields of view (FOV, 200x) from 6 mice for Cre. For Ki67/α-SMA IF staining quantification, n=6 mice for each group. Scale bar: 100 μm. (c) SA-β-Gal staining and quantification (% of cells) in 24-week liver sections from non-DEN mice. Black arrows indicate SA-β-Gal staining. n=6 mice for each group. Scale bar: 100 μm. (d) α-SMA and γ-H2AX IHC staining of 24-week non-DEN Cre liver sections. Scale bar: 100 μm. (e) Quantification of α-SMA/γ-H2AX IHC staining and SASP component IF staining of 24-week non-DEN Cre (n=6) liver sections. Graphs in b, c and e show mean ± SEM, and P values were calculated using a two-tailed t-test. Numerical source data are provided in Source Data Extended Data Fig. 5.
Extended Data Fig. 6
Extended Data Fig. 6. In vitro Characterization of senolytic effects of D+Q and ABT-263
(a) Growth curves of GRO and SEN human HSCs under 3% O2 (to prevent senescence due to oxidative damage) in regular medium (n=3 independent experiments). (b) Growth curves of mouse D37 cells under 3% O2 in conditioned medium from Vehicle (Veh) or etoposide (Etp)-treated mouse HSCs (n=3 independent experiments). (c) Viability or apoptosis (% Annexin V+) quantification of GRO or SEN human HSCs after D+Q treatment at indicated concentrations/combinations (n=3 or independent experiments). (d) Viability or apoptosis (% Annexin V+) quantification of GRO or SEN human HSCs after treatment with ABT-263 at indicated concentrations (n=3 independent experiments). (e) Apoptosis (% Annexin V+) quantification of GRO or SEN human HSCs after treatment with indicated AZD5991 (50 nM) and ABT-263 (10 μM) combinations (n=3 independent experiments). (f) Viability or apoptosis (% Annexin V+) quantification of mouse D37 cells after D+Q treatment at indicated concentrations/combinations (n=3 independent experiments). (g) Mouse D37 cell viability or apoptosis (% Annexin V+) quantification after treatment with indicated ABT-263 concentrations (n=3 independent experiments). All graphs show mean ± SEM, and P values were calculated using a two-tailed t-test. Numerical source data are provided in Source Data Extended Data Fig. 6.
Extended Data Fig. 7
Extended Data Fig. 7. Characterizing the senolytic effects of D+Q and ABT-263 in vivo
(a) Scheme of early stage Veh and D+Q treatment of DEN/GFP or DEN/Cre mice. (b, c) Liver-to-Body Weight (LW/BW) ratio (b) and body weight (c) quantifications of 24-week Veh (n=5) and D+Q (n=6) DEN/Cre mice. (d) Quantification of TG levels from 24-week Veh (n=5) and D+Q (n=6) DEN/Cre mouse livers. (e, f) Representative Sirius Red staining (e) and quantification (f) of 24-week Veh (n=25) and D+Q (n=20) DEN/Cre mouse liver sections. FOV: 200x fields of view. Scale bar: 100 μm. (g) TUNEL staining of 24-week Veh and D+Q DEN/Cre mouse liver sections (n=3 independent experiments). Scale bar: 100 μm. (h) Scheme of late stage Veh and D+Q treatment of DEN/GFP or DEN/Cre mice. (i) Representative SA-β-Gal staining (n=3 independent experiments), and BrdU/α-SMA IF staining of 36-week Veh and D+Q DEN/Cre mouse liver sections. Scale bar: 100 μm. (j) Quantification of BrdU and α-SMA IF staining of 36-week Veh (n=5) and D+Q (n=6) DEN/Cre mouse liver sections. (k) Surface tumour number and size distributions of 24 wk or 36 wk DEN/GFP mice treated with Veh or D+Q. n=5 mice for each cohort at each time point. (l) Scheme of Veh and ABT-263 treatment of DEN/GFP or DEN/Cre mice. (m) Representative TUNEL staining of 36-week Veh and ABT-263-treated DEN/Cre mouse liver sections (n=3 independent experiments). Scale bar: 100 μm. (n) SA-β-Gal staining of 36-week Veh and ABT-263-treated DEN/Cre mouse liver sections (n=3 independent experiments). Scale bar: 100 μm. (o) Surface tumour number and size distributions of DEN/GFP mice treated with Veh (n=5) or ABT-263 (n=5). Graphs in b-d, f, j, k and o show mean ± SEM, and P values were calculated using a two-tailed t-test. Numerical source data are provided in Scanned images of unprocessed blots in Source Data Extended Data Fig. 7.
Extended Data Fig. 8
Extended Data Fig. 8. Identification of HMGB1 as a potential mediator between FBP1-deficient hepatocytes and HSCs
(a) Unsupervised hierarchical clustering of normalized protein abundance in CM of 24-week Non-DEN GFP (n=5) and Cre (n=5) hepatocytes. (b) An Egyptian Pie Chart of 459 proteins with >=1.5-fold change (adjusted p<0.05) of abundance in CM between Non-DEN GFP (n=5) and Cre (n=5) groups. (c) ELISA-based quantification of HMGB1 levels in CM of 24-week Non-DEN GFP (n=4) or Cre (n=4) hepatocytes. (d) Immunoblotting analysis of HMGB1 in the nuclear (Nuc) and cytosolic (Cyto) fractions or total lysates from 24-week non-DEN GFP (n=2) and Cre (n=2) mouse livers. H3 and HSP90 were used as loading control for nuclear and cytosolic fractions, respectively. GAPDH was used as loading control for whole tissue lysates. (e) qRT-PCR analysis of UPR gene expression in mouse primary hepatocytes after tunicamycin (TUN) treatment (n=3 independent experiments). (f) ELISA-based quantification of HMGB1 levels in primary hepatocyte culture medium of Ctrl and TUN groups (n=3 independent experiments). (g, h) qRT-PCR analysis of SASP (g) or fibrotic (h) gene expression in human HSCs after 1 nM HMGB1 treatment for 15 h (n=3 independent experiments). Graphs in c, e, f-h show represent the mean ± SEM, and P values were calculated using a two-tailed t-test. Scanned images of unprocessed blots in d are shown in Source Data Extended Data Fig.8. Numerical source data are provided in Source Data Extended Data Fig. 8.
Extended Data Fig. 9
Extended Data Fig. 9. Characterization of in vivo and in vitro ICM treatment
(a) Scheme for Veh and ICM treatment of DEN/GFP and DEN/Cre mice. (b) Gross liver appearances and tumour multiplicity (indicated by yellow arrows) in Veh and ICM DEN/Cre mice. Scale bar: 1 cm. (c) H&E staining of Veh (n=6) and ICM (n=7) DEN/Cre mouse liver sections. Scale bar: 100 μm. (d) Quantification of TG levels in Veh (n=6) and ICM (n=7) DEN/Cre mouse livers. (e) Immunoblotting analysis of HMGB1 in nuclear (Nuc) and Cytosolic (Cyto) fractions of Veh (n=2) and ICM (n=2) DEN/Cre livers. H3 and HSP90 were used as loading control for nuclear and cytosolic fractions, respectively. (f) SA-β-Gal staining of Veh (n=6) and ICM (n=7) DEN/Cre mouse liver sections. Scale bar: 100 μm. (g) TUNEL staining and quantification of Veh (n=6) and ICM (n=6) DEN/Cre mouse liver sections. Scale bar: 100 μm. (h) Cell viability assays of GRO human HSCs after ICM treatment (n=3 independent experiments). (I, j) Cell viability assays in SEN human HSCs (i) or mouse D37 cells (j) after ICM (10 μM) treatment (n=3 independent experiments). (k) qRT-PCR analysis of SASP gene expression in human HSCs after 10 μM ICM treatment for 24 h (n=3 independent experiments). (l) Representative Sirius Red staining and quantification (% area) of Veh (n=25 FOV) and ICM (n=21) DEN/Cre mouse liver sections. FOV: fields of view. Scale bar: 100 μm. (m) Quantification of surface tumour number and size distributions from DEN/GFP mice treated with Veh (n=5) or ICM (n=5). Graphs in d, g-m show mean ± SEM, and P values were calculated using a two-tailed t-test. Scanned images of unprocessed blots in e are shown in Source Data Extended Data Fig.9. Numerical source data are provided in Source Data Extended Data Fig. 9.
Figure 1 |
Figure 1 |. Universal FBP1 loss in human and murine liver tumours.
a, Box plots of gluconeogenic gene RNA-seq reads in normal liver and tumour tissues from TCGA dataset. n=50 for normal livers, n=374 for tumour samples. b, Box plots of FBP1 RNA-seq reads in normal liver and stage I-Ill tumour tissues in TCGA dataset. n=50 for normal, n=173 for stage I, n=88 for stage II, n=85 for stage III specimens. c, d, Representative IHC staining (c) and statistical analysis (d) of FBP1 protein in human liver tissue array. n=5 for normal, n=10 for grade 1, n=27 for grade 2, n=12 for grade 3 samples. Scale bar: 100 μm. e, Representative FBP1 IHC staining of 80-week p53-deficient mouse liver sections with tumours (T) (n = 3 independent experiments). Scale bar: 100 μm. f, qRT-PCR analysis of gluconeogenic gene expression in livers from 24-week control (Ctrl) (n=4) and DEN-treated (DEN) (n=5) mice. g, Fbp1 expression patterns in two datasets of murine NAFLD models. In the GSE67680 dataset (upper panel, n=5 for each group), western diet/sugar water (WD/SW)/8wk corresponds to an early non-alcoholic steatohepatitis (NASH) stage, and WD/SW/52wk corresponds to NASH/HCC stage; in the GSE99010 dataset (lower panel, n=2 for WD_CCl4_HCC, n=1 for other groups), (western diet) WD_CCL4_12wk corresponds to NASH stage, and WD_CCL4_24wk corresponds to NASH/HCC stage. “HCC” are dissected tumours from “WD_CCl4_24 wk” livers. In box plots of a, b and d, the top-most line is the maximum, the top of the box is the upper quartile, the centre line is the median, the bottom of the box is the lower quartile and the bottom-most line is the minimum. Graphs in f and g (upper panel) show mean ± SEM. Graph in g (lower panel) show mean. All P values were calculated using a two-tailed t-test. Numerical source data are provided in Statistic Source Data Fig. 1.
Figure 2 |
Figure 2 |. Hepatic FBP1 loss disrupts liver metabolism.
a, b, Pyruvate tolerance test (PTT) (a) and glucose tolerance test (GTT) (b) performed on 16-h fasted GFP (n=7) and Cre (n=8) mice (24-week). c, H&E and Oil Red O staining of liver sections from 24-week GFP and Cre mice (n = 3 independent experiments). Scale bar: 100 μm. d, TEM images of liver sections from 24-week GFP and Cre mice. Bottom panels are magnifications of boxed areas in top panels. M, mitochondria; ER, endoplasmic reticulum. Black arrows indicate ER. Red arrow indicates dilated ER adjacent to mitochondria. Scale bar: 500 nm. e, Quantitation of ER length adjacent to mitochondria (Mito) normalized by total ER length. n=3 mice for each group. f, heatmap of indicated gene expression change from RNA-seq of 24-week GFP (n=5) and Cre (n=5) livers. g, Summary of normalized enrichment score (NES) from GSEA (hallmark gene sets) of RNA-seq dataset. Graphs in a, b and e show mean ± SEM, and P values were calculated using a two-tailed t-test. Numerical source data are provided in Statistic Source Data Fig. 2.
Figure 3 |
Figure 3 |. Hepatic FBP1 loss promotes DEN-induced liver tumour progression in mice.
a, Gross appearance of livers and tumour multiplicity in 24-week DEN mice. Yellow arrows indicate liver tumours. Scale bar: 1 cm. b, c, Quantification of surface tumour number and size distributions (b) and Liver-to-body weight (LW/BW) radios (c) in 24-week DEN mouse cohorts. n=9 mice for GFP, n=11 mice for Cre. d, H&E staining of 24-week DEN mouse liver sections. Black arrow indicates a steatotic tumour. Scale bar: 100 μm. e, Quantification of microscopic tumour number and size distributions in 24-week DEN mouse liver sections. n=9 mice for GFP, n=11 mice for Cre. f, Serum ALT quantification in 24-week DEN mice. n=5 mice for GFP, n=6 mice for Cre. g, h, Representative Ki67 IHC staining (g) and quantification (h) of 24-week DEN liver tumours. n=20 FOV for GFP, n=22 FOV for Cre. FOV: 200x field of view. Scale bar: 100 μm. i, qRT-PCR analysis of a liver cancer gene signature in 24-week DEN livers. n=5 mice for GFP, n=6 mice for Cre. j, k, Sirius Red staining (j) and quantification (% area) (k) of 24-week DEN mouse liver sections. n=18 FOV for GFP, n=22 FOV for Cre. FOV: 100x field of view. Scale bar: 100 μm. l, Gross appearance of livers and tumour multiplicity (indicated by yellow arrows) from 36-week DEN mouse cohorts (n=3 independent experiments). Scale bar: 1 cm. Graphs in b, c, e, f, h, i and k show mean ± SEM, and P values were calculated using a two-tailed t-test. Numerical source data are provided in Statistic Source Data Fig. 3.
Figure 4 |
Figure 4 |. Hepatic FBP1 loss elicits senescence and SASP in HSCs.
a, Representative SA-β-Gal staining, CD140B IHC staining of cryosections from 36-week mouse liver sections (n=4 independent experiments with similar results). T: tumour. Scale bar: 100 μm. b, Representative p21 and FOXO4 IHC staining of 36-week mouse liver sections (n=3 independent experiments). T: Tumour. Scale bar: 100 μm. c, d, Representative α-SMA and γ-H2AX IHC staining (c) and quantification (% of α-SMA+) (d) of 36-week mouse liver sections. n=6 mice for each group. T: tumour. Scale bar: 100 μm. e, f, Representative IF staining (e) of IL6+/α-SMA+, GRO-α+/α-SMA+ and CXCL9+/α-SMA+ cells and quantification (% of α-SMA+) (f) in 24-week non-DEN GFP (n=6) and Cre (n=6) mouse liver sections. White arrowheads indicate cells with double positive staining. Scale bar: 50 μm. Graphs in d an f show mean ± SEM, and P values were calculated using a two-tailed t-test. Numerical source data are provided in Statistic Source Data Fig. 4.
Figure 5 |
Figure 5 |. Senescent HSCs promote HCC growth in vitro and in vivo.
a, b, SA-β-Gal staining (a) and quantification (% of cells) (b) of GRO and SEN human HSCs (n = 3 independent experiments). Scale bar: 100 μm. c, Proliferation assay for GRO and SEN HSC cells (n = 3 independent experiments). Scale bar: 1 cm. d, Gene expression by qRT-PCR analysis of GRO and SEN human HSCs (n = 3 independent experiments). e, Cytokine array of conditioned medium (CM) from vehicle (Veh) control and etoposide (Etp)-treated mouse HSCs. The abundance of individual protein of Etp groups was normalized to that of Veh group and expressed as fold change. n=3 for each group. f, In vitro cell proliferation assay for human PLC HCC cells cultured in CM from GRO or SEN human HSCs (n = 3 independent experiments). g, h, Clonogenicity assay (g) and quantification (h) of PLC HCC cells in CM from GRO or SEN human HSCs (n = 3 independent experiments). Scale bar: 1 cm. i, Xenograft tumor growth assay with PLC cells and co-injected GRO or SEN human HSCs. n=15 tumours in each group. Graphs in b, d, e, f, h and i show mean ± SEM, and P values were calculated using a two-tailed t-test. Numerical source data are provided in Statistic Source Data Fig. 5.
Figure 6|
Figure 6|. Senolytic treatment limits HSC SASP and tumour progression driven by FBP1 loss.
a, Gross liver appearance and tumour multiplicity (indicated by yellow arrows) in 24-week Veh and D+Q DEN/Cre cohorts. Scale bar: 1 cm. b, c, Surface (b) and microscopic (c) tumour number and size distributions in 24-week Veh (n=5) and D+Q (n=6) DEN/Cre cohorts. d, e, IF staining (d) and quantification (e) of IL6+/α-SMA+, GRO-α+/α-SMA+ and CXCL9+/α-SMA+ cells in 24-week Veh (n=5) and D+Q (n=6) DEN/Cre mouse liver sections. Scale bar: 50 μm. f, qRT-PCR analysis of fibrotic gene expression from 24-week Veh (n=5) and D+Q (n=5) DEN/Cre mouse livers. g, Quantification of TUNEL staining from 24-week Veh (n=5) and D+Q (n=6) DEN/Cre liver sections. h, Gross liver appearances and tumour multiplicity in 36-week Veh and D+Q DEN/Cre mice. Scale bar: 1 cm. i, Surface tumour number and size distributions in 36-week Veh (n=4) and D+Q (n=5) DEN/Cre cohorts. j, Quantification of SA-β-Gal staining of 36-week Veh (n=4) and D+Q (n=5) DEN/Cre mouse liver sections. k, Gross liver appearances and tumour multiplicity in 36-week Veh and ABT-263 DEN/Cre cohorts. Scale bar: 1 cm. l, Surface tumour number and size distributions in 36-week Veh (n=7) and ABT-263 (n=10) DEN/Cre mice. m, Quantification of TUNEL staining from 36-week Veh (n=7) and ABT-263 (n=10) DEN/Cre mouse liver sections. n, SA-β-Gal staining quantification of 36-week Veh (n=7) and ABT-263 (n=10) DEN/Cre mouse liver sections. o, p, Representative IL6 IHC staining (o) and quantification (p) of 36-week Veh (n=7) and ABT-263 (n=10) mouse liver sections. T, tumour. Scale bar: 100 μm. In box plots of g, j, m, n and p, the top-most line is the maximum, the top of the box is the upper quartile, the centre line is the median, the bottom of the box is the lower quartile and the bottom-most line is the minimum. Graphs in b, c, e, f, i and l show mean ± SEM. All P values were calculated using a two-tailed t-test. Numerical source data are provided in Statistic Source Data Fig. 6.
Figure 7 |
Figure 7 |. HMGB1 mediates crosstalk between FBP1-deficient hepatocytes and HSCs.
a, Fold change of 45 secretory protein abundances in Cre relative to GFP hepatic CM (adjusted p<0.05). 5 biological replicates from 3 mice of each cohort. b, Representative IF staining of HMGB1 and α-SMA in 24-week mouse liver sections (n=3 independent experiments). Scale bar: 50 μm. White arrowheads indicate cells with cytosolic HMGB1 staining. c, d, Quantification of surface tumour (c) and microscopic tumour (d) number and size distributions in Veh (n=6) and ICM (n=7) DEN/Cre mice. e, f, IF staining (e) of IL6+/α-SMA+, GRO-α+/α-SMA+ and CXCL9+/α-SMA+ cells and quantification (% of α-SMA+) (f) in mouse liver sections from Veh (n=6) and ICM (n=7) DEN/Cre cohorts. Scale bar: 50 μm. White arrowheads in (e) indicate cells with double positive staining. g, Quantification of SA-β-Gal staining (% of cells) in 24-week Veh (n=6) and ICM (n=6) DEN/Cre mouse liver sections. h, qRT-PCR analysis of fibrotic gene expression from 24-week Veh (n=6) and ICM DEN/Cre (n=5) mouse livers. i, Working model for liver tumour promotion by hepatic FBP1 loss. Hepatic FBP1 loss disrupts liver metabolism leading to ER stress and a distinctive hepatic secretome; secreted HMGB1 as one mediator activates HSCs; HSCs undergo senescence (sen HSC) and promote tumour progression through a SASP. Graphs in c, d, f, g and h show mean ± SEM, and P values were calculated using a two-tailed t-test. Numerical source data are provided in Statistic Source Data Fig. 7.

Comment in

References

    1. Siegel RL, Miller KD & Jemal A Cancer Statistics, 2017. CA Cancer J Clin 67, 7–30 (2017). - PubMed
    1. TCGA Comprehensive and Integrative Genomic Characterization of Hepatocellular Carcinoma. Cell 169, 1327–1341 e1323 (2017). - PMC - PubMed
    1. Greten TF, Wang XW & Korangy F Current concepts of immune based treatments for patients with HCC: from basic science to novel treatment approaches. Gut 64, 842–848 (2015). - PMC - PubMed
    1. Ringelhan M, Pfister D, O’Connor T, Pikarsky E & Heikenwalder M The immunology of hepatocellular carcinoma. Nat Immunol 19, 222–232 (2018). - PubMed
    1. Friedman SL Hepatic stellate cells: protean, multifunctional, and enigmatic cells of the liver. Physiol Rev 88, 125–172 (2008). - PMC - PubMed

Publication types

Substances