

Age and generational patterns of overdose death risk from opioids and other drugs
- PMID: 32367060
- PMCID: PMC8086189
- DOI: 10.1038/s41591-020-0855-y
Age and generational patterns of overdose death risk from opioids and other drugs
Abstract
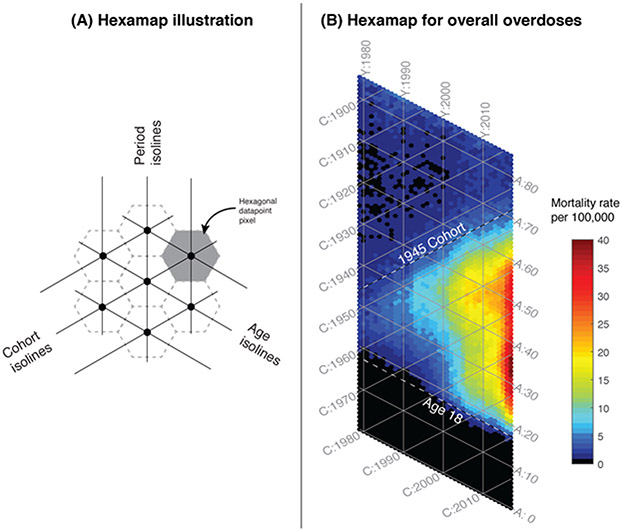
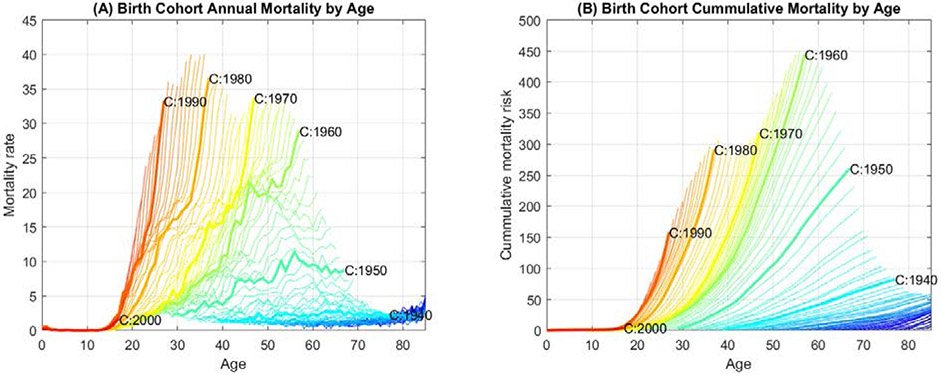
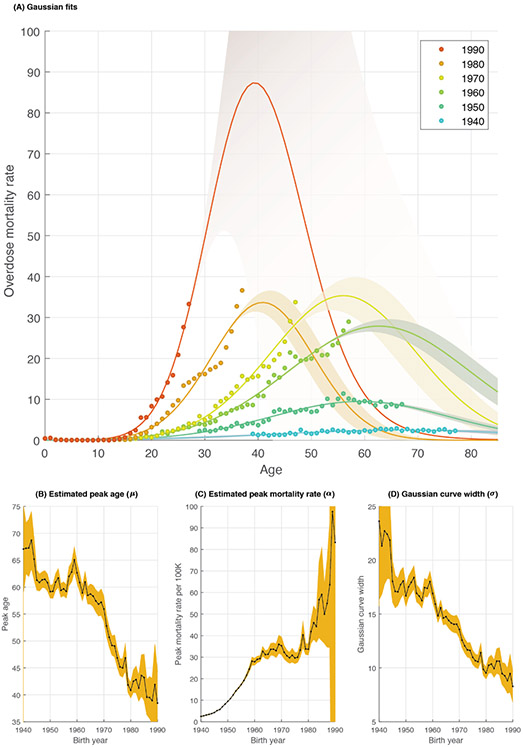
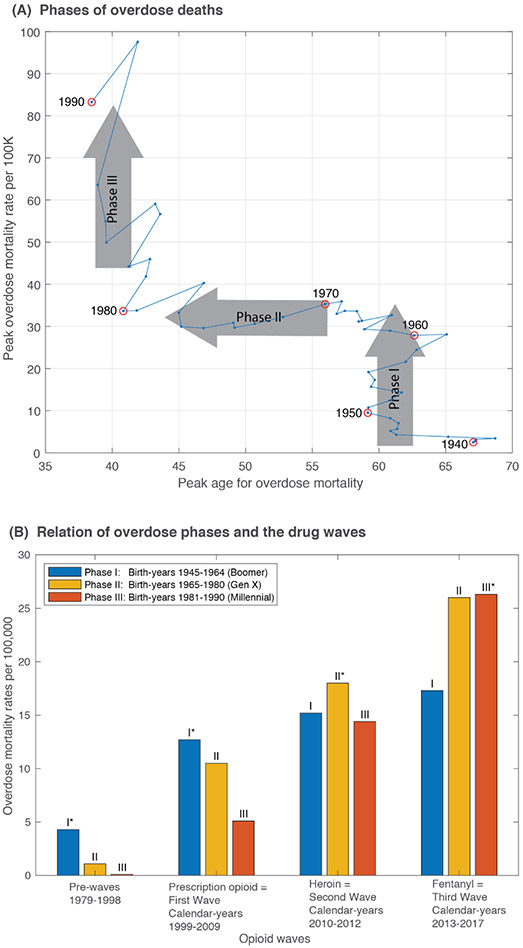
The ongoing substance misuse epidemic in the United States is complex and dynamic and should be approached as such in the development and evaluation of policy1. Drug overdose deaths (largely attributable to opioid misuse) in the United States have grown exponentially for almost four decades, but the mechanisms of this growth are poorly understood2. From analysis of 661,565 overdose deaths from 1999 to 2017, we show that the age-specific drug overdose mortality curve for each birth-year cohort rises and falls according to a Gaussian-shaped curve. The ascending portion of each successive birth-year cohort mortality curve is accelerated compared with that of all preceding birth-year cohorts. This acceleration can be attributed to either of two distinct processes: a stable peak age, with an increasing amplitude of mortality rate curves from one birth-year cohort to the next; or a youthward shift in the peak age of the mortality rate curves. The overdose epidemic emerged and increased in amplitude among the 1945-1964 cohort (Baby Boomers), shifted youthward among the 1965-1980 cohort (Generation X), and then resumed the pattern of increasing amplitude in the 1981-1990 Millennials. These shifting age and generational patterns are likely to be driven by socioeconomic factors and drug availability, the understanding of which is important for the development of effective overdose prevention measures.
Figures
Comment in
-
Generational trends in US opioid-overdose deaths.Nat Med. 2020 May;26(5):651-652. doi: 10.1038/s41591-020-0875-7. Nat Med. 2020. PMID: 32367061 No abstract available.
Similar articles
-
Increasing Prescription Opioid and Heroin Overdose Mortality in the United States, 1999-2014: An Age-Period-Cohort Analysis.Am J Public Health. 2018 Jan;108(1):131-136. doi: 10.2105/AJPH.2017.304142. Epub 2017 Nov 21. Am J Public Health. 2018. PMID: 29161066 Free PMC article.
-
The Burden of Opioid-Related Mortality in the United States.JAMA Netw Open. 2018 Jun 1;1(2):e180217. doi: 10.1001/jamanetworkopen.2018.0217. JAMA Netw Open. 2018. PMID: 30646062 Free PMC article.
-
Unintentional opioid overdose deaths in New York City, 2005-2010: a place-based approach to reduce risk.Int J Drug Policy. 2014 May;25(3):569-74. doi: 10.1016/j.drugpo.2013.10.015. Epub 2013 Nov 8. Int J Drug Policy. 2014. PMID: 24412006
-
An epidemic of the use, misuse and overdose of opioids and deaths due to overdose, in the United States and Canada: is Europe next?Bone Joint J. 2017 Jul;99-B(7):856-864. doi: 10.1302/0301-620X.99B7.BJJ-2016-1350.R1. Bone Joint J. 2017. PMID: 28663389 Review.
-
Opioid analgesic dose and the risk of misuse, overdose, and death: A narrative review.Pharmacoepidemiol Drug Saf. 2018 May;27(5):464-472. doi: 10.1002/pds.4366. Epub 2017 Dec 15. Pharmacoepidemiol Drug Saf. 2018. PMID: 29243305 Review.
Cited by
-
Measuring network dynamics of opioid overdose deaths in the United States.Sci Rep. 2024 Nov 28;14(1):29563. doi: 10.1038/s41598-024-80627-4. Sci Rep. 2024. PMID: 39609532 Free PMC article.
-
Opioid-related deaths in Ontario correctional facilities and penitentiaries (2009-2019).Forensic Sci Med Pathol. 2023 Sep;19(3):357-363. doi: 10.1007/s12024-022-00573-3. Epub 2023 Jan 23. Forensic Sci Med Pathol. 2023. PMID: 36690802 Free PMC article.
-
A Demographic and Regional Comparison of Opioid-Related Hospital Visits within Community Type in the United States.J Clin Med. 2021 Aug 4;10(16):3460. doi: 10.3390/jcm10163460. J Clin Med. 2021. PMID: 34441753 Free PMC article.
-
Opioid Use Disorder in Older Adults: a Narrative Review.Curr Geriatr Rep. 2025;14(1):6. doi: 10.1007/s13670-025-00431-4. Epub 2025 May 3. Curr Geriatr Rep. 2025. PMID: 40416299
-
Age, Period, and Cohort Effects in Alcohol Use in the United States in the 20th and 21st Centuries: Implications for the Coming Decades.Alcohol Res. 2022 Jan 13;42(1):02. doi: 10.35946/arcr.v42.1.02. eCollection 2022. Alcohol Res. 2022. PMID: 35083099 Free PMC article.
References
-
- Keyes K LG. Age–Period–Cohort Modeling. Inj Res. 2011:409–426. doi:10.1007/978-1-4614-1599-2_22 - DOI
-
- National Center for Health Statistics. Mortality Multiple Cause Data Files; 1979–2017. Atlanta, GA: Centers for Disease Control and Prevention, US Department of Health and Human Services.
References for online methods:
-
- Annual Estimates of the Resident Population by Single Years of Age and Sex for the United States; 1970s, 1980s, 1990s, 2000s, 2010s. U.S. Census Bureau, Population Division; Retrieved from https://factfinder.census.gov/faces/nav/jsf/pages/index.xhtml
Publication types
MeSH terms
Substances
Grants and funding
LinkOut - more resources
Full Text Sources
