. 2020 May;27(5):489-499.
doi: 10.1038/s41594-020-0415-7. Epub 2020 May 4.

Real-time observation of CRISPR spacer acquisition by Cas1-Cas2 integrase

Affiliations

Real-time observation of CRISPR spacer acquisition by Cas1-Cas2 integrase

Jagat B Budhathoki et al. Nat Struct Mol Biol. 2020 May.

Abstract

Cas1 integrase associates with Cas2 to insert short DNA fragments into a CRISPR array, establishing nucleic acid memory in prokaryotes. Here we applied single-molecule FRET methods to the Enterococcus faecalis (Efa) Cas1-Cas2 system to establish a kinetic framework describing target-searching, integration, and post-synapsis events. EfaCas1-Cas2 on its own is not able to find the CRISPR repeat in the CRISPR array; it only does so after prespacer loading. The leader sequence adjacent to the repeat further stabilizes EfaCas1-Cas2 contacts, enabling leader-side integration and subsequent spacer-side integration. The resulting post-synaptic complex (PSC) has a surprisingly short mean lifetime. Remarkably, transcription effectively resolves the PSC, and we predict that this is a conserved mechanism that ensures efficient and directional spacer integration in many CRISPR systems. Overall, our study provides a complete model of spacer acquisition, which can be harnessed for DNA-based information storage and cell lineage tracing technologies.


Conflict of interest statement

Competing Interests

The authors declare no competing interests.

Figures

Extended Data Fig. 1
Extended Data Fig. 1. Bulk biochemistry showing that the structure-guided fluorescent labeling scheme did not alter the integration activity of EfaCas1–Cas2
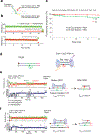
a, Location of the Cy3 (green) and Cy5 (red) fluorophores and the six possible integration schemes (leader-half, spacer-half, and full-integration in two prespacer orientations); b, The expected length of the fluorophore-containing products from each integration scheme on a. c, Product of EfaCas1–Cas2 catalyzed integration over time, resolved on Urea-PAGE. Green band: Cy3-containing products; red band: Cy5-containing products; yellow: products containing both Cy3 and Cy5 fluorophores; leftmost lane: 5’-Cy3-labeled ssDNA size ladder. Uncropped gel images for panel c are shown in the Source Data.
Extended Data Fig. 2
Extended Data Fig. 2. Efficient target capture by EfaCas1–Cas2–PS(4,4) and interpretation of denaturing FRET states after SDS wash
a, Histogram (native condition) collected from 25 short movies each having 325 FRET pairs on average after 10 min of 10 nM Cas1–Cas2–PS(4,4) incubation. Only two peaks were observed in steady state representing two orientation of prespacer, but it is not clear whether prespacer is integrated into the leader-side/spacer side, or, in half or full integration state. EFRET= center ± s.d. b-d, Representative smFRET traces showing potential binding, half-integration or full-integration events. Within five minutes of recording, more than 90% of traces recorded Cas1–Cas2 activities in the form of binding-unbinding or integration-disintegration. e, f, Oligonucleotide annealing scheme to mimic the leader-side half integration in two prespacer orientations. g, h, FRET histogram from single-molecule constructs depicted in e and f, respectively. i, smFRET histogram (denatured condition) after EfaCas1–Cas2 catalyzed integration from half-integration-only prespacers [i.e. PS(4, 4ddC)]. Integration only took place from the non-dideoxy end of the prespacer. Leader-side integration was strongly preferred. Spacer-side integration peak was only present after extended incubation.
Extended Data Fig. 3
Extended Data Fig. 3. Spacer-side labeling scheme revealed DNA bending and four native FRET levels for half and full integration
a, The Crystal structure of half and full integration shown in both prespacer orientations; half to full conversion bends the target DNA and changes the FRET states, positions of donor and acceptor fluorophores are as indicated on DNA. b, Schematic of half and full integration in native states; six integration possibilities are shown. c, Steady-state FRET efficiency histogram showing binding-integration of Cas1–Cas2–PS(4,4) in the native state. Only four peaks were observed, two for half integration (unbent target) and two for the bent state in each orientation. Mostly, bent state corresponded to full integration (as detected by SDS wash), but a small fraction of bent population also showed half integration (both leader and spacer side) due to integration-disintegration phenomenon (see TDP); EFRET= center ± s.d. d, EFRET transition from the native to denatured state tabulated. e, Schematics of six integration configurations in the protein-denatured state.
Extended Data Fig. 4
Extended Data Fig. 4. Kinetic measurement of Kd by counting Cy5 spots
a, A schematic of target and Cas1–Cas2–PS(4,4) used in experiments. b, Plot of bound or integrated single molecule population (measured via Cy5 signal on target) after the introduction of EfaCas1–Cas2–PS(4,4) at different concentration into the flow cell. Fitting the data with single exponential equation yields rate constant kobs for each concentration, which when plotted against concentration (b) gives equilibrium constant Kd and a reaction rate constant, k2.
Extended Data Fig. 5
Extended Data Fig. 5. Measurement of leader side reaction rate khalf
a, A schematic of target and Cas1–Cas2–PS(4,4) used in experiments b, FRET histogram collected following SDS denaturation at varied reaction times, showing the changing free and integrated population (leader side) at different reaction times. c, Plot of leader-side half integrated population vs reaction time. Data fitting gives the rate of formation (khalf) of leader-side half integration. The khalf is comparable to k2 (Extended Data Fig. 3) and represents a lower limit of reaction rate because the integration reaction was difficult to perform reliably by hand for a reaction time of 1s or less.
Extended Data Fig. 6
Extended Data Fig. 6. Capturing binding-unbinding and integration-disintegration events using one-ended ddC prespacer
a, A representative smFRET trace from a 15-min long movie with prespacer PS(4, 4ddC). O1 has longer dwell time than O2 because of integration from 3’-OH. The trace captures binding and unbinding, integration and disintegration, and FRET transition from native to the denatured state upon SDS treatment on a single shot. Two orientations of prespacer are shown by dashed lines. b, Plot of transitions from two native peaks, O1 and O2, to corresponding denatured peaks representing leader and spacer side integration, respectively. The plot was generated for PS(4,4ddC). c, Two smFRET traces for prespacer PS(4ddC, 4) after swapping -OH group and -ddC from PS(4, 4ddC). The dwell time for O1 and O2 is reversed due to swap.
Extended Data Fig. 7
Extended Data Fig. 7. Long movie trace showing finite stability of half and full integration
a, Schematics of construct used in photo-stability test with 532 nm excitation, Cy3 emission, and FRET-induced Cy5 emissions. b, Representative smFRET traces showing eventual photobleaching of Cy3 (top) and Cy5 (bottom) after long-time excitation. c, Percentage of live molecules vs survival time for Cy3 (green) and Cy5 (red). d, A schematic of target and Cas1–Cas2–PS(4,4) used in experiments. e, f, Representative smFRET traces from 20-min long recording. As the one Cas1–Cas2–PS(4,4) molecule integrates and later disintegrates, another comes and interacts with the target as the excess molecules were not washed out. After 18 minutes of recording, SDS solution flowed through the channel to identify the fate of PS(4,4) prespacer if it was integrated at the time of flow. The last part of trace was used to create TDP as it contains both native and denatured state FRET levels.
Extended Data Fig. 8
Extended Data Fig. 8. Kinetic measurement of full-integration reaction
a, A schematic of target and Cas1–Cas2–PS(4,4) used in experiments. b-e, Denaturing FRET histogram of the integration reaction quenched at different time point using SDS wash. Prespacer PS(4,4) was used in the measurement to allow full integration. Histogram for each time point was constructed from 25 short movies, each with about 300 FRET pairs. f, Histograms in b-e were quantified and the percentage of half- (black) and full-integration (red) products were plotted against reaction time, which shows the depletion of half-integration and the compensatory accumulation of full-integration population. The rate of formation full-integration (kfull) was derived from fitting the single-exponential equation, y = y0 + A * exp(−kfull * x), where y is population, x is reaction time.
Extended Data Fig. 9
Extended Data Fig. 9. Integration of various prespacer precursors
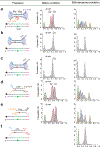
a, Both overhangs 4 nt for positive control; both native and SDS histogram are shown. b, c, One side overhang 4 nt, another side overhang 5 and 6 nt, respectively. Histograms under native condition show integration from only one orientation, i.e. O1, and histograms under SDS treatment indicates that only one side of prespacer is attached as half integration. d, e, EfaCas1–Cas2 can spontaneously unwind 4 bp duplex blunt end. As a result, both orientations O1 and O2 appear under the native condition, and SDS wash resolves native peaks into several new peaks as seen before (Fig.1 d). f, With duplex length extended to 30 bp from its optimal 22 bp length, only one side with 4 nt overhang is integrated. Data were collected only for the denaturing condition.
Extended Data Fig. 10
Extended Data Fig. 10. Probe does not bind to repeat without transcription
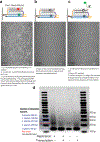
a, Cy3 spots from the 200bp target duplex five minutes after the flow of Cas1-Cas2-PS(4,4). The integration was detected by the appearance of Cy5 spots in the acceptor channel (but Cy5 spots not shown). b, The Cy3 spots were photobleached quickly by introducing imaging solution without gloxy under regular illumination of green laser (~25 mW). c, Image collected after the flow of Cy3-IR1 probe. The lack of Cy3 spots suggests that repeat is not exposed where the probe is expected to bind. A slight increase in spot number compared to ‘b’ (second image) may be due to non-specific binding of probe on surface-adsorbed Cas1–Cas2 that did not have prespacer or reappearance of some dark Cy3 (which appeared photobleached in ‘b’). d, Gel image showing multiple integrated spacers (bands) after 80 minutes under the different condition of replication and transcription.
Fig. 1.
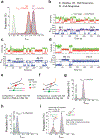
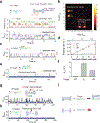
Fig. 1.. Reconstitution of the integration reaction at the single-molecule level.
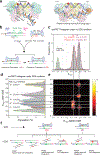
a, Location of the fluorophores on half and full integration crystal structures (PDB accession code: 5XVO and 5XVP). Full integration requires DNA bending, but this does not affect the Cy3-Cy5 distance in the leader-side labeling scheme. b, Schematic of the target, Cas1–Cas2–PS(4,4), and two orientations in which Cas1–Cas2 can bind/integrate the prespacer to the target. c, d, EFRET histogram under native (no-SDS) and denaturing (SDS) conditions, respectively. EFRET peaks are reported as mean ± s.d (n= 7500 and 7000 single-molecules traces for c and d, respectively). e, Transition density plot showing the transition from native peaks to denatured peaks. Each orientation, O1 and O2, is split into corresponding leader-side, spacer-side or full-integration configuration. Transitions to FRET zero were removed to augment the weaker transition peaks. f, Schematic showing transition from the native conformation(O1 and O2) to various SDS-denatured integration configurations.
Fig. 2.
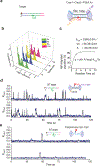
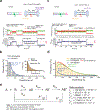
Fig. 2.. Mechanism of target searching by EfaCas1–Cas2.
a, (Top) Schematic of the target and Cas1–Cas2–PS(4ddC,4ddC). The prespacer lacks 3’-OH at both ends. (Bottom) A representative smFRET trace showing binding and unbinding events with 20 nM Cas1–Cas2–PS(4ddC,4ddC). Two FRET levels, O1 and O2, were observed consistent the data in Fig. 1c, representing target binding in two prespacer orientations. Dwell times in the on-state and off-state are denoted on the trace. b, Transition density plot created from 843 binding-unbinding transitions (51 traces). c, e, Representative traces from ΔL and ΔIR targets under the same concentration used in a. d, Plot of the binding rate (1/τoff) vs Cas1–Cas2–PS(4ddC,4ddC) concentration for different targets. The slope provides the binding rate constant (kon), which is reported as mean ± s.e. The values for off-state dwell times used to derivethe binding rate are provided in source data. f, Plot of 1/τon to derive the dissociation constant (koff). koff was determined from four concentrations for WT and ΔL target and two concentrations for ΔIR target. koff is reported as mean ± s.e. The values for on-state dwell times used to derive dissociation rate are provided in source data. g, A representative trace showing frequent binding and unbinding events obtained for 15 nM Cy5-labeled Cas1–Cas2 and unlabeled prespacer. h, A representative trace showing rare binding and unbinding events in the absence of a prespacer. i, Schematic illustrating target binding in the presence (top) and absence (bottom) of prespacer. In the presence of prespacer, Cas1–Cas2 can successfully find the target and integrates the prespacer, but it fails to identify a target in the absence of a prespacer. Source data for panels d and f are available online.
Fig. 3.
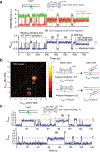
Fig. 3.. Stability of half and full integration complexes.
a, Schematic of target and Cas1–Cas2–PS(4,4ddC) used in the experiment (top) and a representative smFRET trace (bottom). The dashed lines show prespacer orientations (O1 and O2). O2 corresponds to binding events whereas O1 corresponds to half-integration (HI) and was assigned as such based on mean lifetime and post-SDS denaturation. b, Dwell times of binding (inset) and half-integration events were collected from traces like the one shown in panel a and plotted on the histograms. Mean lifetimes for binding and half-integration events were obtained using gamma fit on the histogram data. 358 traces were included in the analysis (each trace contributes one dwell time data point). c, Schematic of target and Cas1–Cas2–PS(4,4) used in the experiment (top) and a representative smFRET trace (bottom). Important events, such as binding-unbinding, integration (half and full) and disintegration, are marked. Since both orientations O1 and O2 correspond to integration in this case, the potential half and full integration events were assigned based on mean lifetime. d, A total of 606 smFRET traces, which showed wide dwell time distribution, were analyzed to collect dwell times for integration events, which were plotted in the histogram. A sum of two gamma functions fitted the histogram, providing two mean lifetimes: one for half and one for full integration. e, Kinetic parameters of Cas1–Cas2–prespacer and target interaction. Source data for graphs in b and d are available online.
Fig. 4.
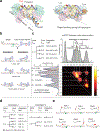
Fig. 4.. Prespacer processing and unidirectional integration.
a, Left, Pre ExoI treatment. Schematic showing assembly of precursor prespacer with Cas1–Cas2 (boxed) and integration. The prespacer has 22bp mid-duplex and two 3’ overhangs of 4 and 26 nt. The prespacer can only be half-integrated from the 4-nt end as shown in histograms presented below the schematic. Both native and SDS condition histograms are presented. Right, Post-ExoI treatment. Schematic showing processing by host nucleases (boxed), such as ExoI, which can act on the longer overhang of the prespacer and trim it to 4nt, the correct length for integration. The resulting prespacer can then be integrated, which is shown in histogram below the schematic. Since the prespacer is integrated in both O1 and O2 orientations, integration is called bidirectional. b, Left, Pre- ExoIII treatment. Schematic showing assembly of Cas1-Cas2 on a precursor prespacer with mid-duplex extended by 20bp (boxed). The prespacer has a 4-nt overhang on one end. Right, Post-ExoIII treatment. ExoIII can act on the duplex end, trimming it to 4bp.The end can then be frayed by Cas1–Cas2 itself. The prespacer is ready for integration and can be integrated in either orientation. The histogram shows peaks corresponding to half and full integration in both O1 and O2 orientations. c, (Left) Scheme of the experimental approach to test the model for unidirectional integration. In this model, precursor prespacer is first integrated from the 4nt overhang end in one orientation (O1 in this case). The other end is then processed in-situ without dissociation from the target. Once the duplex end trimmed to the proper length, Cas1–Cas2 integrates the end to the spacer side, which ensures unidirectional full integration. (Right) Histogram showing unidirectional integration. The peak with EFRET ~0.35 represents half integration and the peak with EFRET ~0.55 represents full integration in O1 orientation, consistent with the proposed model.
Fig. 5.
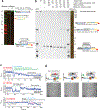
Fig. 5.. Resolution of post-synaptic complex (PSC).
a, Urea gel resolving DNA Pol I mediated extension of leader-side and spacer-side fragments from the naked PSC, without Cas1–Cas2 protection. b, Urea gel showing the extension of the spacer-side fragment, indicating duplication of CRISPR repeat. Extension occurs when both RNA polymerase and DNA polymerase are present simultaneously in the reaction, but when only RNA polymerase or DNA polymerase is present, extension is not observed. c, Representative smFRET traces showing FRET transitions due to transcription of a promoter upstream of leader. The traces are annotated with presumptive events such as unwinding of the repeat, pausing, rewinding, and stalling. Prior to transcription (first 25 seconds), integration of the prespacer is achieved by flowing Cas1–Cas2–PS(4,4). Target Cy3 label is on the coding (top) strand to prevent RNA polymerase blockade, which changes the FRET level of O1 and O2. d, Experimental set-up to show that RNA polymerase can unwind the CRISPR repeat. Left, Cy3 spots from the target. After integration was confirmed through the presence of Cy5 spots in the acceptor channel, transcription was initiated. Middle,Cy3 fluorophores were photobleached (although some Cy3 survived). Right, The Cy3-IR1 DNA probe is added to the channel. It should anneal with the template (bottom) strand of the repeat, if the template strand is exposed by RNA polymerase-mediated unwinding. New Cy3 spots in the photobleached area indicate annealing of the Cy3 probe. Control experiments without transcription are shown in Extended Data Fig. 10a–c. Uncropped gel images for a and b are available online.
Fig. 6.
Fig. 6.. In vivo evidence that transcription from the CRISPR locus promotes new spacer incorporation.
a, In vivo spacer acquisition assay. E. coli expressing Cas1 and Cas2 (bacteria depicted as green circle) were electroporated with spacers (lightning bolt) and the of CRISPR array expansion was analyzed by PCR at specified time intervals. Primer set 1 (orange) amplifies both expanded and unexpanded CRISPR arrays from genomic DNA, whereas primer set 2 (green) selectively amplifies new spacers incorporated in one orientation. b, Quantification of new spacer acquisition (top), with or without transcription from the CRISPR locus, under conditions of replication arrest, which was achieved by adding nalidixic acid in the growth medium. The bars represent mean of 3 independent experiments; p-value: * < 0.05; ** <0.005 (two-tailed t-test; t-scores were converted to corresponding p-values). c, Image of agarose gel showing PCR products using primer set 2 from time-course experiments in the above four conditions. Uncropped gel images for panel b and c and source data for the graph in b are available online.
Fig. 7:
Fig. 7:
Model explaining how transcription-coupled repair resolves PSC and allows the final spacer incorporation into a CRISPR array. a, Integration of the prespacer by Cas1–Cas2 and formation of post-synaptic complex (PSC). b, RNA polymerase invades into the PSC upon transcription of the CRISPR locus and exposes single strands of the CRISPR repeat. c, Exposed repeat is filled by DNA polymerase. d, Cas1–Cas2 remain bound with new spacer and defines the spacer-side filling boundary. It also prevents double-strand DNA breaks. e, RNA polymerase is removed, and the leader-side is filled completely. f, Cas1–Cas2 is removed and the nicks are ligated, completing the incorporation of the new spacer.

Similar articles

Cited by

References

    1. Barrangou R et al. CRISPR provides acquired resistance against viruses in prokaryotes. Science 315, 1709–1712 (2007). - PubMed
    1. Yosef I, Goren MG & Qimron U Proteins and DNA elements essential for the CRISPR adaptation process in Escherichia coli. Nucleic acids research 40, 5569–5576 (2012). - PMC - PubMed
    1. Nuñez JK et al. Cas1–Cas2 complex formation mediates spacer acquisition during CRISPR–Cas adaptive immunity. Nature structural & molecular biology 21, 528–534 (2014). - PMC - PubMed
    1. Nuñez JK, Lee AS, Engelman A & Doudna JA Integrase-mediated spacer acquisition during CRISPR-Cas adaptive immunity. Nature 519, 193–198 (2015). - PMC - PubMed
    1. Makarova KS, Grishin NV, Shabalina SA, Wolf YI & Koonin EV A putative RNA-interference-based immune system in prokaryotes: computational analysis of the predicted enzymatic machinery, functional analogies with eukaryotic RNAi, and hypothetical mechanisms of action. Biol Direct 1, 7, doi:10.1186/1745-6150-1-7 (2006). - DOI - PMC - PubMed

References for the Methods and Supplemental text sections

    1. Joo C & Ha T Labeling Proteins for Single-Molecule FRET. Cold Spring Harbor Protocols 2012, pdb.prot071035 (2012). - PubMed
    1. Roy R, Hohng S & Ha T A practical guide to single-molecule FRET. Nat Methods 5, 507 (2008). - PMC - PubMed
    1. Bronson JE, Fei J, Hofman JM, Gonzalez RL & Wiggins CH Learning Rates and States from Biophysical Time Series: A Bayesian Approach to Model Selection and Single-Molecule FRET Data. Biophysical Journal 97, 3196–3205 (2009). - PMC - PubMed
    1. Mairhofer J, Wittwer A, Cserjan-Puschmann M & Striedner G Preventing T7 RNA polymerase read-through transcription-A synthetic termination signal capable of improving bioprocess stability. ACS Synth Biol 4, 265–273, doi:10.1021/sb5000115 (2015). - DOI - PubMed
    1. Chen YJ et al. Characterization of 582 natural and synthetic terminators and quantification of their design constraints. Nat Methods 10, 659–+, doi:10.1038/Nmeth.2515 (2013). - DOI - PubMed

Publication types

MeSH terms

LinkOut - more resources