. 2020 May;27(5):500-510.
doi: 10.1038/s41594-020-0406-8. Epub 2020 May 4.

CDK11 is required for transcription of replication-dependent histone genes

Affiliations

CDK11 is required for transcription of replication-dependent histone genes

Pavla Gajdušková et al. Nat Struct Mol Biol. 2020 May.

Abstract

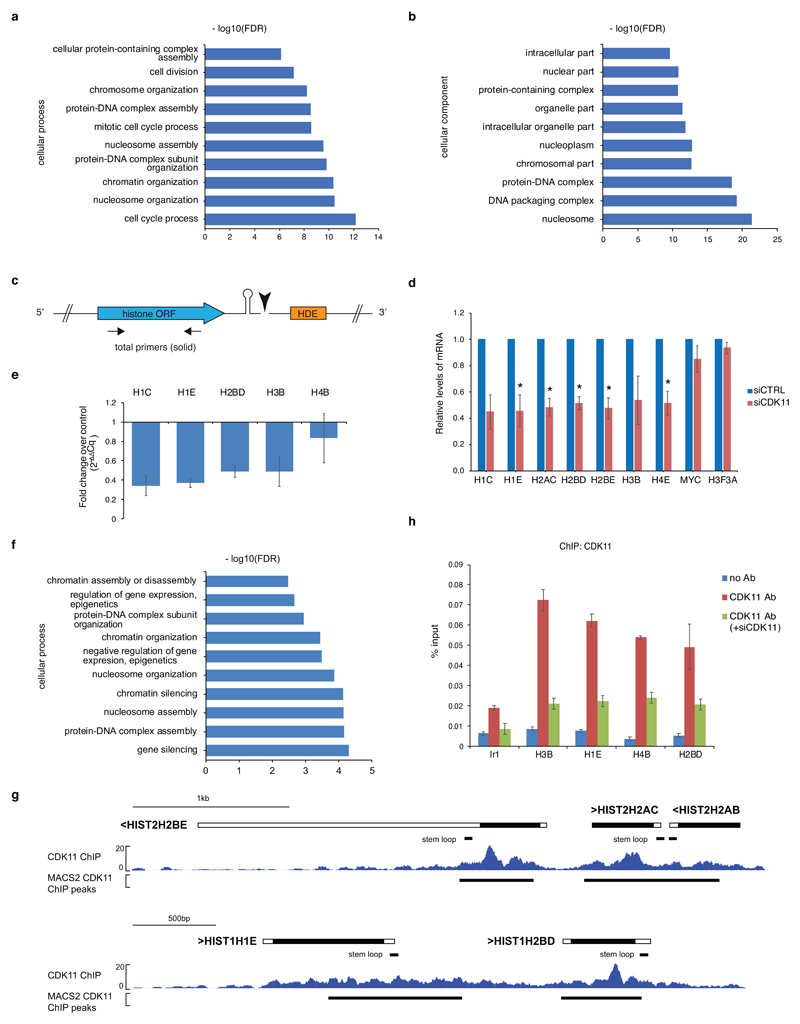
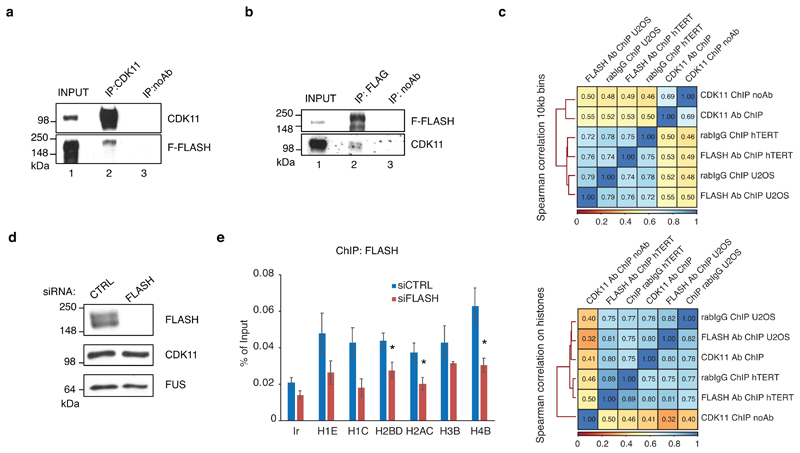
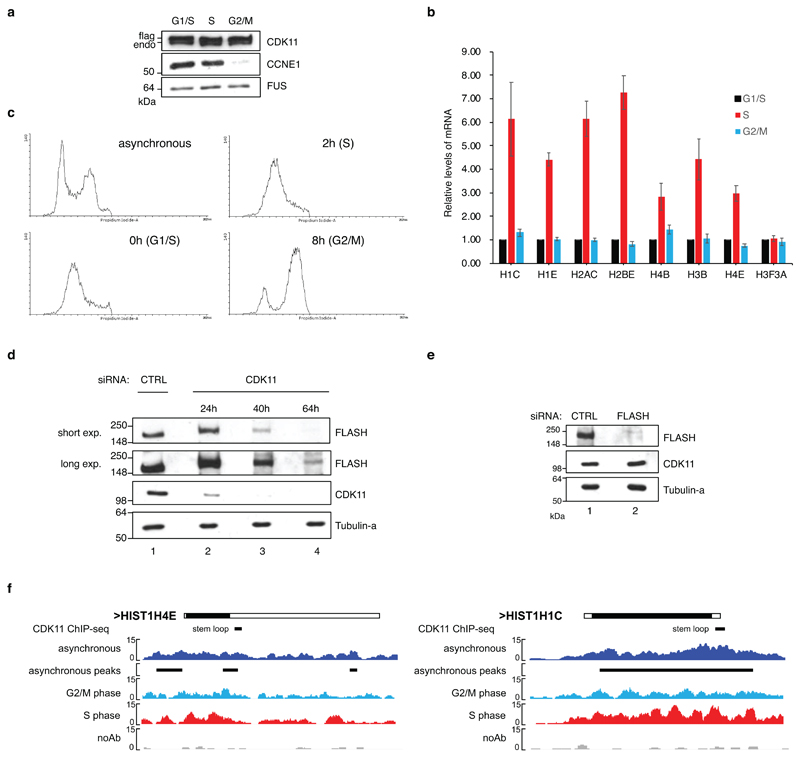
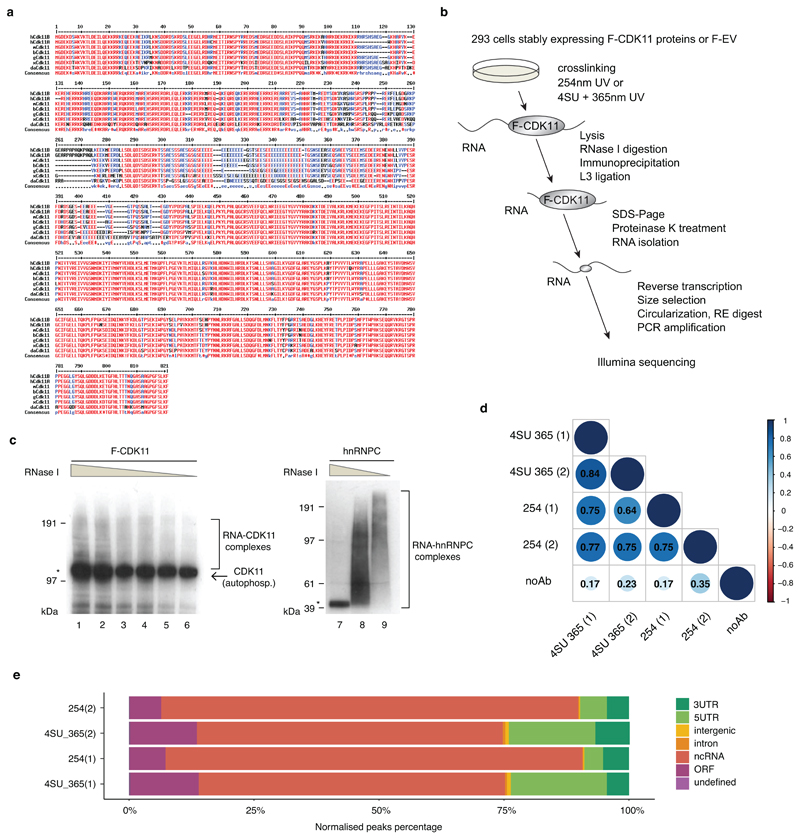
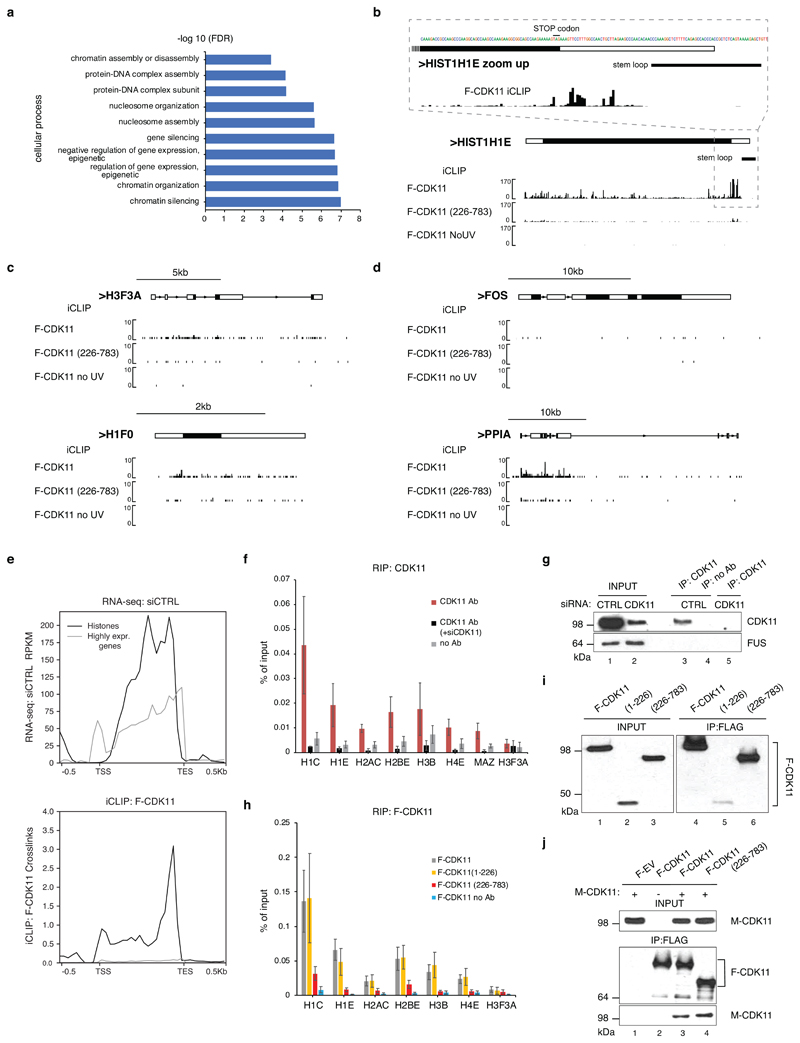
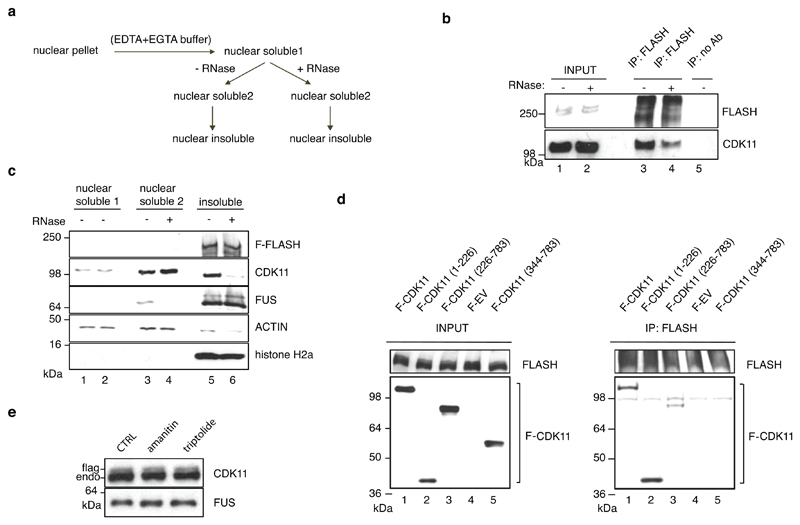
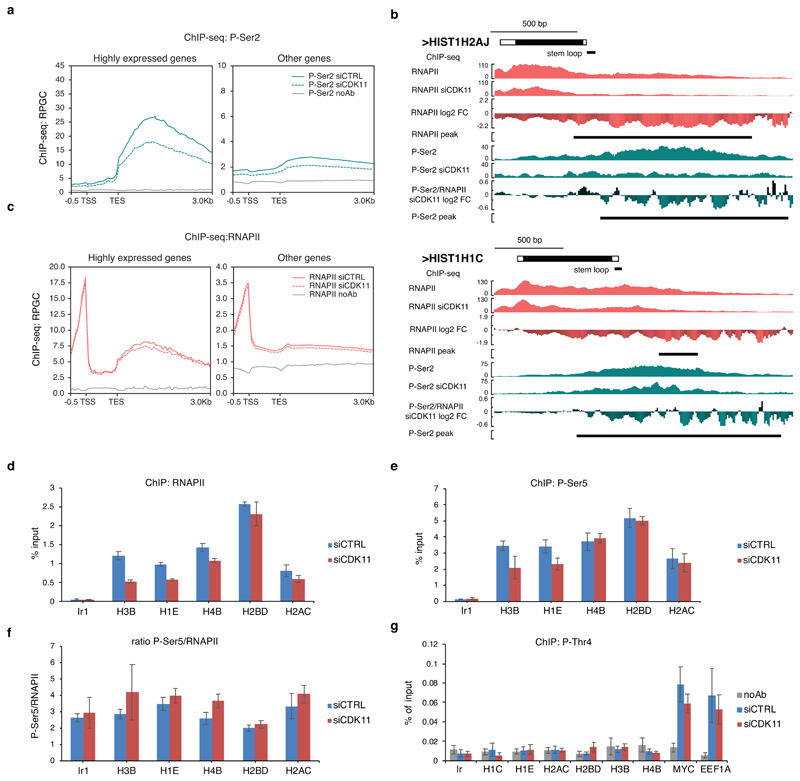
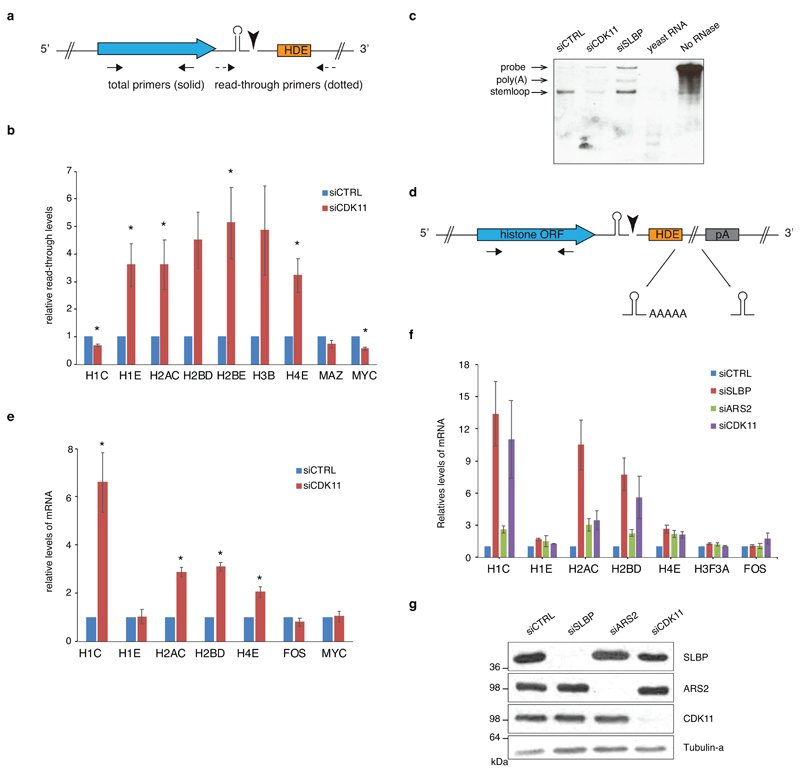
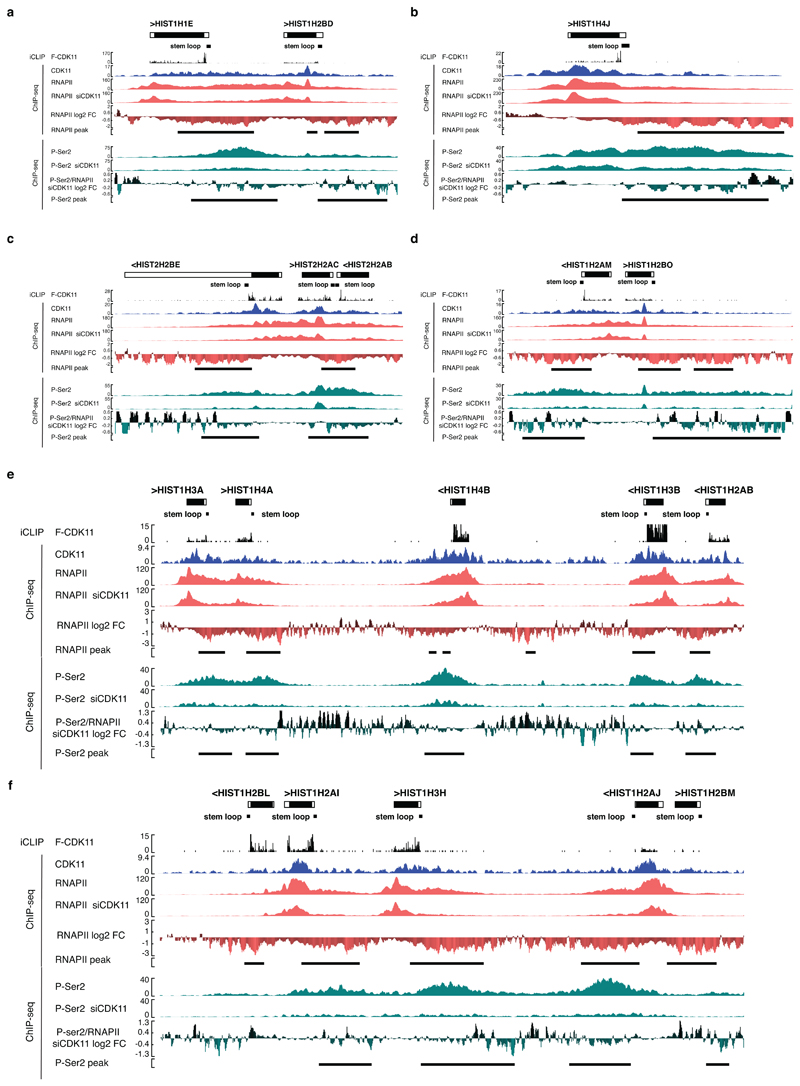
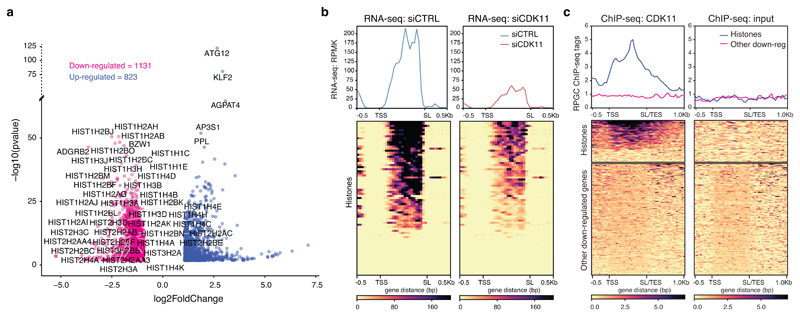
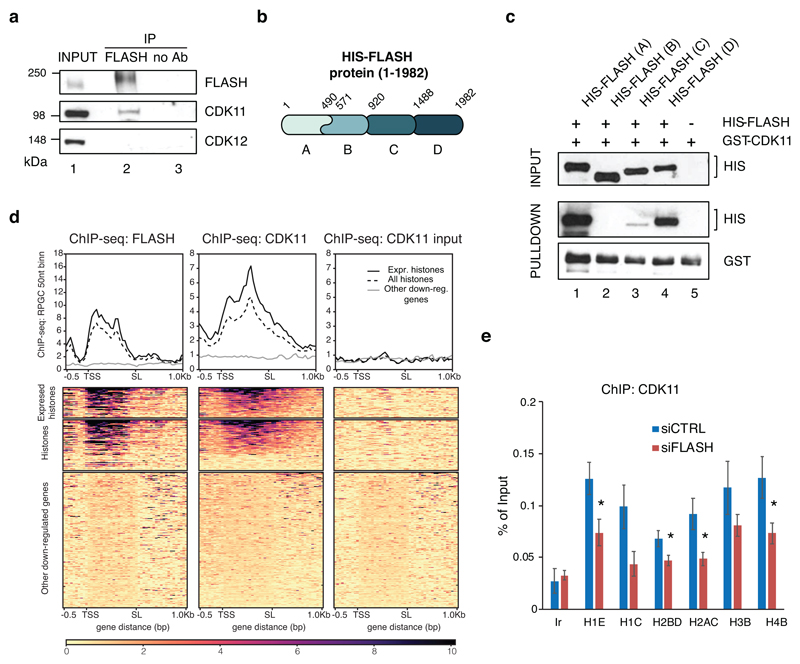
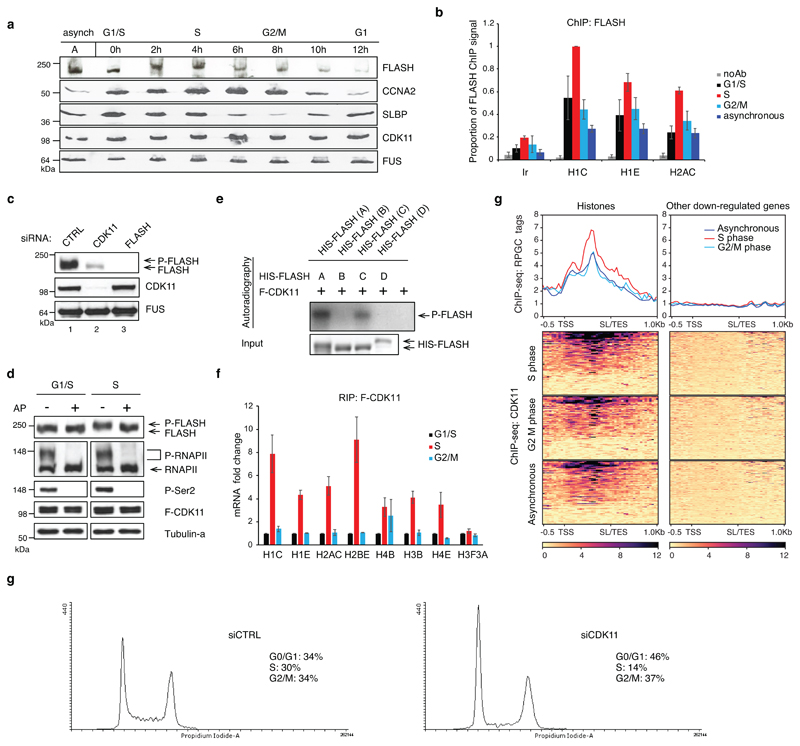
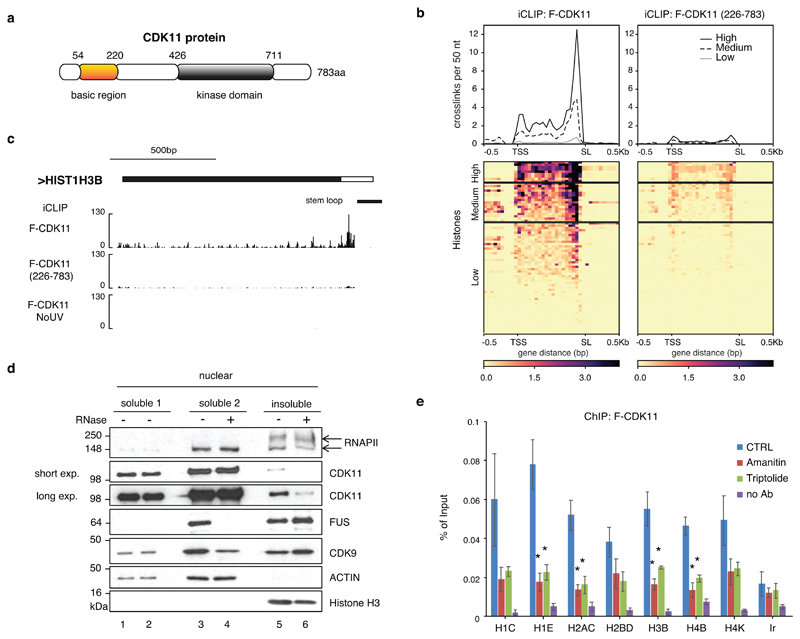
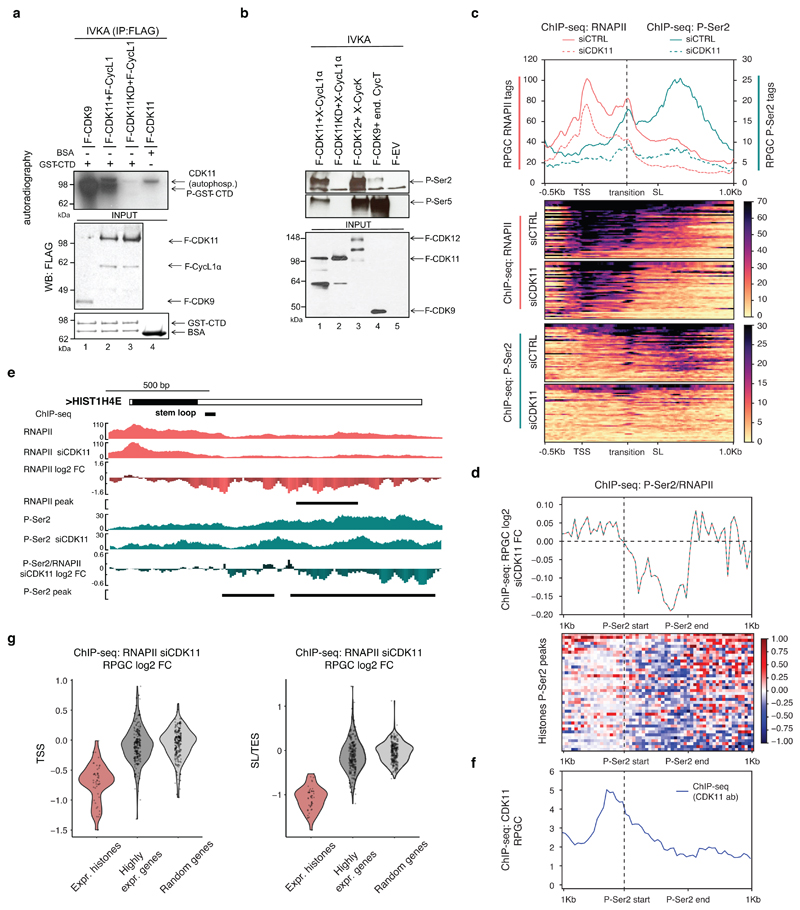
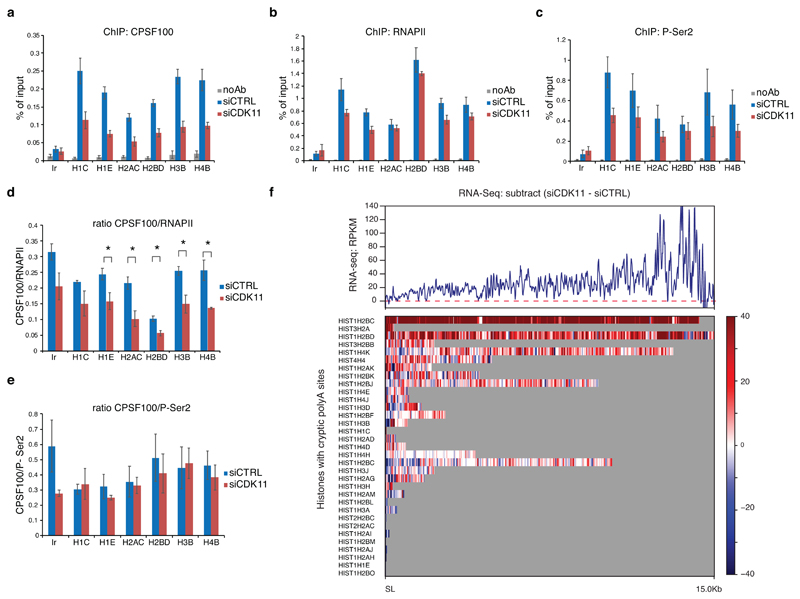
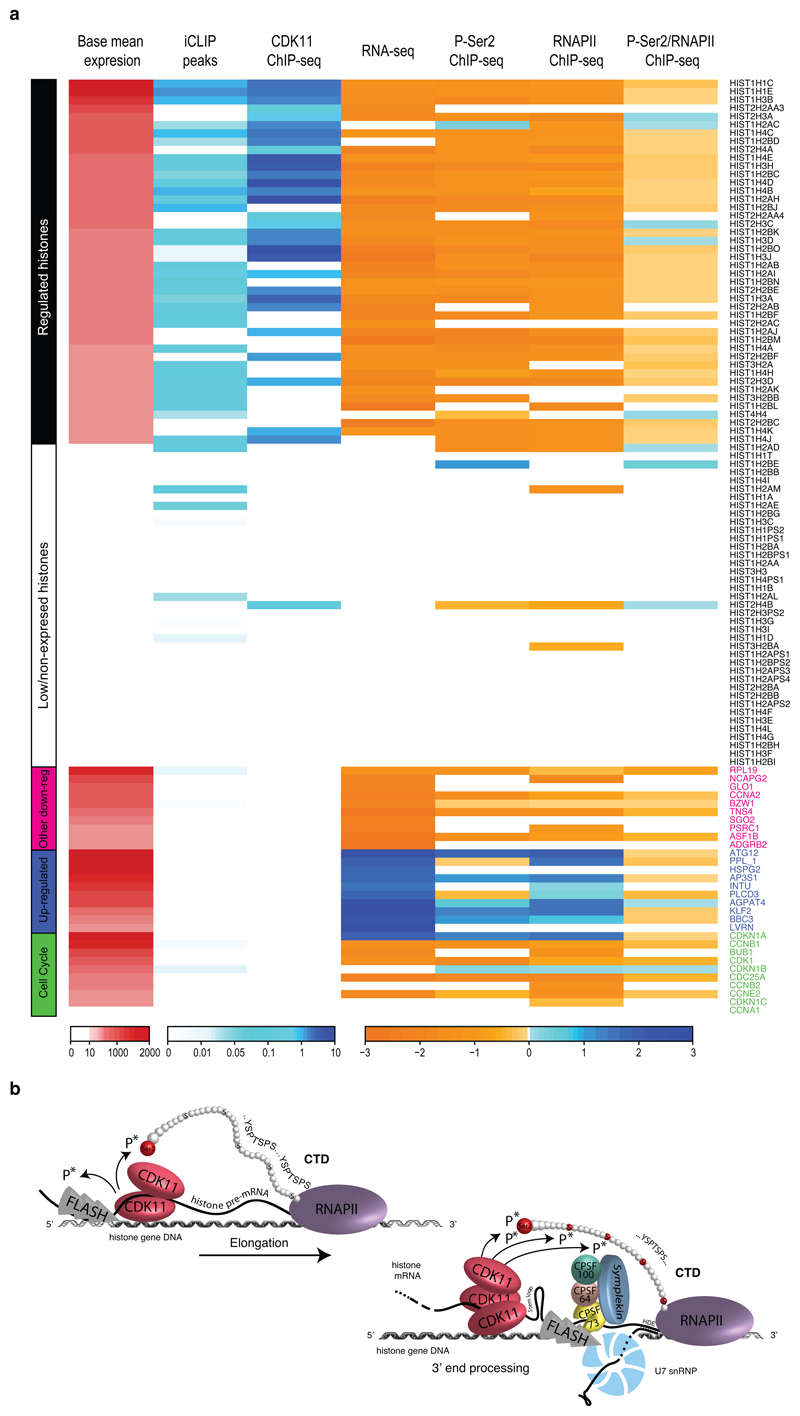
Replication-dependent histones (RDH) are required for packaging of newly synthetized DNA into nucleosomes during the S phase when their expression is highly upregulated. However, the mechanisms of this upregulation in metazoan cells remain poorly understood. Using iCLIP and ChIP-seq, we found that human cyclin-dependent kinase 11 (CDK11) associates with RNA and chromatin of RDH genes primarily in the S phase. Moreover, its amino-terminal region binds FLASH, an RDH-specific 3'-end processing factor, which keeps the kinase on the chromatin. CDK11 phosphorylates serine 2 (Ser2) of the carboxy-terminal domain of RNA polymerase II (RNAPII), which is initiated when RNAPII reaches the middle of RDH genes and is required for further RNAPII elongation and 3'-end processing. CDK11 depletion leads to decreased number of cells in S phase, likely owing to the function of CDK11 in RDH gene expression. Thus, the reliance of RDH expression on CDK11 could explain why CDK11 is essential for the growth of many cancers.


Conflict of interest statement

Competing interests

The authors declare no competing interests.

Figures

Extended Data Fig. 1
Extended Data Fig. 1. CDK11 is recruited to chromatin of RDH genes to regulate their transcription.
a, b, GO analyses of enriched cellular processes (a) and components (b) in genes down-regulated in the RNA-seq experiment. Total of 401 genes (log2FoldChange<-1.5; p-adj<0.01) were analysed by the Gorilla program. c, Depiction of histone mRNA and position of RT-qPCR primers. The stem shape and the black triangle depict SL and mRNA cleavage, respectively. Arrows display positions of total RT-qPCR primers. Blue and orange rectangle represents histone open reading frame (ORF) and histone downstream element (HDE), respectively d, Graph shows relative levels of total mRNAs of described genes in HCT116 cells treated with control (siCTRL) or CDK11 (siCDK11) siRNA. Total RNA was reverse transcribed using random hexamer primers. mRNA levels were normalized to PPIA mRNA expression. n=3 biologically independent experiments, error bars=SEM, *P<0.05, Student´s two-sided t-test. e, HCT116 cells were transfected with control or CDK11 siRNA and nascent mRNA from nuclear run-ons were measured by RT-qPCR. Graph shows fold change of RDH nascent mRNAs normalized to control knockdown and PPIA housekeeping gene (2-ΔΔCq). Results show mean ± standard deviation of four biological replicates. n=4 biologically independent experiments, error bars=SD. f, GO analyses of enriched cellular functions of genes occupied by CDK11 in HCT116 cells. 393 genes (log2FoldChange<-1.5; p<0.01) were chosen for the analyses by the Gorilla program. g, CDK11 ChIP-seq occupancy on HIST2H2BE, HIST2H2AC, HIST2H2AB (upper panel) and HIST1H1E, HIST1H2BD RDH cluster genes (lower panel). Black lines below the RDH schema and the gene tracks show positions of the SL and CDK11 ChIP-seq peaks identified by the MACS2 program (p<0.05), respectively. h, CDK11 ChIP-qPCR analyses on the indicated RDH genes in HCT116 cells transfected with mock or CDK11 siRNA. ChIP-qPCR was performed with either CDK11 or no antibody (no Ab) control. Ir1 represents intergenic region. n=4, error bars=SEM.
Extended Data Fig. 2
Extended Data Fig. 2. CDK11 and FLASH interact directly and are present on the chromatin of RDH genes.
a, b, Western blot analyses of immunoprecipitates of endogenous CDK11 (a) and flag-tagged FLASH (F-FLASH) (b) from HCT116 cells expressing F-FLASH. The blots were probed against proteins indicated on the side. c, Correlation analyses of CDK11 and FLASH co-occupancy genome-wide (10 kb bins) (top panel) and on RDH genes (bottom panel). Spearman correlation coefficient between indicated ChIP-seq samples is shown and correlation strength is indicated by colour code. FLASH ChIP-seq from hTERT and U2OS cells. d, Western blot analyses of FLASH and CDK11 protein levels in cell lysates used for the CDK11 and FLASH ChIP-qPCR experiments in Fig. 2e and Extended Data Fig. 2e, respectively. FUS is a loading control. Representative replicate is shown. e, Endogenous FLASH ChIP-qPCR on indicated RDH genes or control intergenic region (Ir) in HCT116 cells treated either with control (CTRL) or FLASH siRNAs for 24 h. n=3 biologically independent experiments, error bars=SEM, *P<0.05, Student´s two-sided t-test.
Extended Data Fig. 3
Extended Data Fig. 3. CDK11 is recruited to the RDH genes in S phase and maintains protein levels of FLASH.
a, Western blots show levels of indicated proteins in depicted cell cycle phases. FUS is a loading control and CCNE1 a G1/S phase marker. Endo and flag mark endogenous and F-CDK11, respectively. b, Graph presents mRNA levels of described histone genes in G1/S, S and G2/M phases. RT-qPCR is normalized relative to MAZ mRNA. n=3 biologically independent experiments, error bars=SEM. c, Histogram presents cell cycle profiles of either asynchronous or synchronized cells released in the indicated times after double thymidine synchronization. Cells in G1/S, S and G2/M phases were harvested at 0, 2 and 8 h after the release, respectively. d, Western blot analyses of FLASH protein levels in cells treated with control (CTRL) or CDK11 siRNAs for indicated times. e, Western blot analyses of CDK11 protein levels in lysates from HCT116 cells treated with control (CTRL) or FLASH siRNA for 72 h. f, Gene tracks of HIST1H4E and HIST1H1C showing CDK11 occupancy during the cell cycle. CDK11 ChIP-seq in asynchronous cells, synchronized G2/M and S phase and ChIP-seq with no antibody (no Ab) control are depicted.
Extended Data Fig. 4
Extended Data Fig. 4. CDK11 is an evolutionary conserved RNA-binding protein.
a, Alignment of CDK11 protein sequences from different species by the MultAlin program. CDK11 protein sequences from human (Homo-hCDK11B (NP_001778.2) and hCDK11A (NP_001300825.1)), mouse (Mus-mCDK11 (NP_031687.2)), cow (Bos-bCDK11 (NP_001007812.2)), chicken (Gallus-gCDK11 (NP_001026042.2)), frog (Xenopus-xCDK11(NP_001086696.1), and zebra fish (Danio-dCDK11 (NP_001008646.1)) were obtained from the NCBI database. Numbers above the alignment indicate amino acid numbering. Red, blue and black colored letters indicate amino acid consensus, similarity, and difference, respectively. b, Schema of iCLIP workflow. Big and small grey ovals correspond to a full length F-CDK11 protein and a CDK11 peptide, respectively crosslinked to RNA (black line). RE=restriction enzyme. c, 293 cell lines stably expressing flag-tag CDK11 (F-CDK11) or endogenous hnRNPC (used as iCLIP procedure positive control with the canonical RNA-binding protein) were treated with 4SU for 6 hr and irradiated with 200mJ/cm2 at 365nm. Lysates were either treated with decreasing concentrations of RNase I or left untreated. The RNA-protein complexes were resolved on SDS-PAGE and visualized by autoradiography. Clamps on the side of the panels and asterisk indicate RNA-protein complexes and collapsed RNA-protein band after high RNase I treatment, respectively. Band corresponding to autophosphorylated CDK11 is shown by the arrow. d, Significant iCLIP crosslinks (FDR > 0.05) were matched with their transcripts and correlated between the indicated biological replicates of depicted F-CDK11 and no Ab iCLIP libraries. Numbers inside blue balls correspond to R2 (Pearson correlation coefficient). e, Percentage of significant bound genomic regions (FDR > 0.05) normalized by region length. Biological replicates of F-CDK11 iCLIP libraries are labelled on the left, individual genomic regions are differentiated by a color code.
Extended Data Fig. 5
Extended Data Fig. 5. CDK11 binds predominantly RDH RNAs in cells.
a, GO analyses of enriched cellular processes in CDK11-bound mRNAs. 371 mRNAs (with CDK11 CLIP cDNA density > 0.01) were analysed by the Gorilla program. b,c,d, Biodalliance genome browser view of F-CDK11, F-CDK11(226-783) and uncrosslinked control (no UV) iCLIP binding at canonical RDH HIST1H1E (b), non-canonical histones H3F3A (upper panel) and H1F0 (lower panel) (c) and protein coding FOS (upper panel) and PPIA (lower panel) transcripts (d). For HIST1H1E, the expanded view of its 3´end sequence (stop codon and stem loop are indicated with black lines) and CDK11 binding there is shown (b). e, Highly expressed transcripts bind to CDK11 with much lower intensity when compared to RDH transcripts. Comparison of expression (upper panel) and binding to CDK11 (lower panel) of RDH (black line) and highly expressed genes (grey line). Data are based on RNA-seq normalized to reads per kilobase per million (RPKM) and CDK11 iCLIP experiments in 293 cells. f, g, Graph represents RIP analyses of endogenous CDK11 binding to indicated RNAs in HCT116 cells. Immunoprecipitations were performed with either CDK11 or no antibody (Ab) in cell lysates treated with mock or CDK11 siRNA (siCDK11). n=4 biologically independent experiments, error bars=SEM. (f). Western blot analyses of efficiency of CDK11 depletion with indicated siRNAs (lanes 1, 2) and immunoprecipitations with shown antibodies (lanes 3, 4, 5) in cell lysates used for the RIP experiment. Antibodies used for western blotting are displayed on the right of the panel (g). h, i, Graph displays RIP analyses carried out in cell lysates from HCT116 cells stably expressing indicated F-CDK11 proteins. Immunoprecipitations were done with flag or no antibody (no Ab); qPCR was performed in triplicate for each biological replicate. n=4 biologically independent experiments, error bars=SEM (h). Western blot analyses of levels of doxycycline induced F-CDK11 proteins in cell lysates input into the RIP (left panel, lanes 1-3); efficiency of immunoprecipitation of the proteins with flag antibody in RIP (lane 4-6, right panel). Anti-flag antibody was used for western blotting (i). j, Myc-tagged CDK11 (M-CDK11) protein was either expressed (lanes 1, 3, and 4) or not (lane 2) in 293 cells carrying indicated stably integrated flag-tagged proteins. Lysates were immunoprecipitated with anti-flag agarose and immunoprecipitates of M-CDK11 and flag-tagged proteins were identified as presented on the lower and middle western blots, respectively. The upper western blot shows amounts of M-CDK11 proteins in 5% input into the immunoprecipitations (IP). F-EV corresponds to cell line stably expressing flag tag alone.
Extended Data Fig. 6
Extended Data Fig. 6. RNA promotes CDK11 recruitment to the FLASH-containing RDH chromatin.
a, Workflow of nuclear pellet fractionation procedure. b,c, Western blot analysis of: immunoprecipitates of endogenous FLASH from cell lysates either treated or not with RNase A (b), association of indicated factors in soluble and insoluble fractions of chromatin either treated or not with RNase A/T1 (c) Antibodies are shown on the side of the panels. d, Western blot analysis of immunoprecipitates of endogenous FLASH from HCT116 cells carrying stably integrated flag-tagged CDK11 (F-CDK11), its indicated deletion mutants and control flag-tagged empty vector (F-EV) (right panel). Western blot analyses of inputs into FLASH immunoprecipitations are shown (left panel). Amounts of flag-tagged CDK11 proteins were monitored by anti-flag antibody. e, Western blot analysis of endogenous (endo) and flag-tagged CDK11 protein levels in the cells treated with amanitin or triptolide or untreated control (CTRL) used for F-CDK11 ChIP-qPCR (Fig. 4e). Antibodies are shown on the side of the panels.
Extended Data Fig. 7
Extended Data Fig. 7. CDK11 regulates Ser2 phosphorylation and RNAPII elongation specifically on the RDH genes.
a, ChIP-seq analyses of P-Ser2 occupancies on highly expressed (n=200) and other genes (except RDH, up- and down-regulated genes, n= 56751 genomic features) in HCT116 cells treated with either control (siCTRL) or CDK11 (siCDK11) siRNA. P-Ser2 noAb=control input into P-Ser2 ChIP-seq. b, HIST1H1C and HIST1H2AJ gene tracks as in Fig. 5e. c, ChIP-seq analyses of RNAPII occupancies as in Extended Data Fig. 7a d,e,f, ChIP-qPCR analyses of RNAPII (d) and phosphorylated Ser5 (e) occupancies on coding regions of the indicated RDH genes in HCT116 cells transfected with control (siCTRL) or CDK11 (siCDK11) siRNA. Ratio of P-Ser5 and total RNAPII ChIP-qPCR signals is displayed (f). n=3 biologically independent experiments, error bars=SEM, Ir=intergenic region. g, ChIP-qPCR analyses of P-Thr4 occupancies on coding regions of the indicated RDH and protein coding genes in HCT116 cells transfected with control (siCTRL) or CDK11(siCDK11) siRNA. n=5 biologically independent experiments, error bars=SEM, Ir=intergenic region.
Extended Data Fig. 8
Extended Data Fig. 8. Depletion of CDK11 leads to changes in transcriptional read-through and/or use of cryptic polyadenylation sites in RDH genes
a, b Depiction of histone mRNA and position of RT-qPCR primers. Blue and orange rectangle represents histone open reading frame (ORF) and histone downstream element (HDE), respectively. The stem shape depicts SL RNA and the black triangle indicates position of mRNA cleavage. Solid and dotted arrows display positions of total and read-through RT-qPCR primers, respectively (a). Graph shows relative levels of read-through mRNA of described genes in HCT116 cells transfected with control (CTRL) or CDK11 siRNA. Total RNA was reverse transcribed using random hexamer primers. Read-through mRNA levels are normalized to the total mRNA levels of the corresponding gene. The read-though transcription in CTRL cells was set as 1. n=4 biologically independent experiments, error bars=SEM. *P<0.05, Student´s two-sided t-test (b). c, RNase protection assay shows levels of differentially 3’ end processed HIST1H1C transcripts in HCT116 cells treated with control (CTRL), CDK11 or SLBP siRNA. Total HCT116 or yeast RNA was incubated with an antisense RNA probe targeting canonically processed and polyadenylated HIST1H1C transcripts. The mix was treated with RNase T1, resolved on denaturing gel and visualized. The arrows on the left indicate positions of full-length probe (probe) and polyadenylated (polyA) or canonically processed (stem loop) HIST1H1C transcripts. No RNase sample shows full-length anti-sense probe without RNase T1 treatment. d,e,f,g, Schema of alternative 3´end processing pathways of histone mRNA and position of RT-qPCR primers. The stem shape depicts stem-loop RNA and the black triangle indicates position of mRNA cleavage. Absence of proper cleavage results in polyadenylated histone mRNA, proper cleavage produces mature non-polyadenylated histone mRNA. Solid arrows display positions of total RT-qPCR primers (d). Graphs show relative levels of mRNA of described genes in HCT116 cells treated with either control (CTRL), CDK11, SLBP or ARS2 siRNA. Total RNA was reverse transcribed using oligo(dT) primers. mRNA levels were normalized to PPIA mRNA expression. n=3 biologically independent experiments, *P<0.05, Student´s two-sided t-test (e, f). Depletion of proteins was verified by western blotting with indicated antibodies. Tubulin is a loading control (g).
Extended Data Fig. 9
Extended Data Fig. 9. Presentation of iCLIP and ChIP-seq data on example RDH genes.
a,b,c,d,e,f Biodalliance genome browser view of HIST1H1E, HIST1H2BD (a); HIST1H4AJ (b); HIST2H2BE, HIST2H2AC, HIST2H2AB (c); HIST1H2AM, HIST1H1BO (d); HIST1H3A, HIST1H4A, HIST1H4B, HIST1H3B, HIST1H2AB (e); HIST1H2BL, HIST1H2AI, HIST1H3H, HIST1H2AJ and HIST1H2BM (f) genes with the indicated iCLIP and ChIP-seq data in control and CDK11 depleted cells.
Figure 1
Figure 1. CDK11 binds chromatin of RDH genes and promotes their transcription.
a, RNA-seq analysis of HCT116 cells following siRNA-mediated CDK11 knockdown. Down- and up-regulated genes (-1>log2FoldChange>1; p-adj<0.01) are shown in red and blue, respectively. Symbols of 41 down-regulated RDH and 5 most up-regulated genes are shown for n=3 biologically independent experiments. b, RNA-seq metaplots (top) and heatmaps (bottom) of the RDH genes in control (siCTRL) and CDK11 (siCDK11) siRNA treated cells. TSS=transcription start site; SL=stem loop. c, CDK11 ChIP-seq on RDH and 200 other down-regulated genes. CDK11 and input data are from n=4 and n=3 biologically independent experiments, respectively. TSS=transcription start site, SL/TES=stem loop/transcription end site.
Figure 2
Figure 2. FLASH recruits CDK11 to the RDH genes.
a, Western blot analyses of immunoprecipitates of endogenous FLASH from HCT116 cells. The blots were probed with the indicated antibodies. b, Depiction of human FLASH protein and four his-tagged deletion mutants expressed in bacteria. Deletion mutants A and B have an overlapping region between amino acids 490-571. c, Western blot analyses of in vitro binding assays of GST-CDK11 purified from insect cells and his-tagged FLASH (HIS-FLASH) deletion mutants expressed in bacteria and depicted in Figure 2b. d, FLASH ChIP-seq in hTERT cells (GSE69149) (left panel) in comparison to CDK11 ChIP-seq (middle panel) and no Ab input control (right panel) on 44 regulated (expressed) RDH (RDH with base mean expression>10), all RDH and 200 other downregulated genes. e, Endogenous CDK11 ChIP-qPCR on indicated RDH genes or control intergenic region (Ir) in HCT116 cells treated either with control (CTRL) or FLASH siRNAs for 24 h. n=3 biologically independent experiments, error bars=SEM, *P<0.05, Student´s two-sided t-test. Source Data for graphs in panel e are available with the paper on line.
Figure 3
Figure 3. CDK11 is recruited to RDH genes predominantly in S-phase.
a, Western blot analyses of extracts of HCT116 cells released from double thymidine synchronization. Time points after the release and cell cycle phases are indicated. Cell cycle phase markers: CCNA2=cyclin A2, SLBP. A=asynchronous cells, 0 h=time of the release. b, FLASH ChIP-qPCR on selected RDH genes in asynchronous and G1/S, S and G2/M synchronised HCT116 cells. FLASH ChIP-qPCR signals are normalised to the maximum signal which was set as 1. n=3 biologically independent experiments, error bars=SEM, Ir=intergenic region. c, Western blot analyses of FLASH and phosphorylated FLASH (P-FLASH) in cell lysates of HCT116 cells treated with either control or CDK11 or FLASH siRNAs for 48 h. d, Western blot analyses of lysates of HCT116 cells synchronized by double thymidine treatment in G1/S-phase and released 2 h into the S-phase. The lysates were treated or were not with alkaline phosphatase (AP). The phosphorylated and dephosphorylated forms of FLASH and control RNAPII and Ser2 are indicated at right by clip marks and arrows, respectively. The blots were probed with indicated antibodies. P-FLASH, P-RNAPII and F-CDK11 are phosphorylated FLASH, RNAPII and Flag-tagged CDK11, respectively. e, IVKA visualized by autoradiography (upper panel). His-tagged deletion mutants of FLASH expressed in bacteria were incubated with purified CDK11 in the presence of [γ-32P] ATP. P-FLASH=phosphorylated FLASH. Western blotting of inputs of FLASH deletion mutants (lower panel). f, Graph displays RNA immunoprecipitation (RIP) of histone transcripts with F-CDK11 from HCT116 cells synchronized in G1/S-, S- and G2/M-phases. Graph shows fold change of CDK11 binding to RDH mRNA normalized to MAZ mRNA binding. mRNA levels in G1/S were set as 1 for each transcript. n=3 biologically independent experiments, error bars=SEM. g, CDK11 ChIP-seq on the RDH and 200 other down-regulated genes in either HCT116 cells asynchronous or synchronized in S- or G2/M-phases. For asynchronous and S or G2/M n=4 and 2 biologically independent experiments, respectively. h, Histograms of cell cycle analyses of HCT116 cells transfected with control (CTRL) or CDK11 siRNA for 36 h. Percentage of cells in G0/G1-, S- and G2/M-phases are displayed. Source data for panels b and f are available with the paper on line.
Figure 4
Figure 4. RNA promotes CDK11 recruitment to the RDH chromatin.
a, Schematic diagram highlighting the kinase domain and basic region of human CDK11 protein. b, Metagene analyses of F-CDK11 and F-CDK11 (226-783) iCLIP binding at all RDH transcripts from the TSS to the SL. iCLIP data k-means clustered, based on RNA-seq expression (high, medium and low). n=4 biologically independent experiments. c, Biodalliance genome browser view of F-CDK11, F-CDK11 (226-783) and uncrosslinked control (no UV) iCLIP binding at HIST1H3B transcript. Stem loop (SL) is indicated by a black line. d, Western blot analysis of association of the indicated factors in soluble and insoluble fractions of chromatin either treated or not treated with RNase A/T1. Arrows mark phosphorylated (upper) and non-phosphorylated (lower) forms of RNAPII. For CDK11, long and short exposures of the film are shown. e, CDK11 ChIP-qPCR on RDH genes in HCT116 cells expressing stably integrated F-CDK11 and treated either with Amanitin (4 μg/ml) or Triptolide (10 μM) or untreated (CTRL). n=4 biologically independent experiments, error bars=SEM, *P<0.05, Student´s t-test, Ir=intergenic region. Source data for panel e are available with the paper on line.
Figure 5
Figure 5. CDK11 promotes transcriptional elongation of RDH genes.
a, GST-CTD or BSA was incubated with the indicated cyclins/CDKs in the presence of [γ- 32P] ATP, the resulting kinase reactions (IVKA) were resolved on SDS-PAGE gel and visualized by autoradiography. Phosphorylated GST-CTD (P-GST-CTD) and autophosphorylated CDK11 is shown (upper panel). Equal input of flag-tagged cyclins/CDKs and GST-CTD to the IVKA were confirmed by western blotting with anti-flag antibody (middle panel) or by Coomassie staining (lower panel), respectively. b, Displayed cyclins/CDKs purified from HCT116 cells were incubated with GST-CTD in IVKA. Phosphorylation was monitored by the indicated antibodies by Western blotting (upper panel). Input of equal amounts of flag-tagged CDKs into IVKA was validated by flag antibody (lower panel). F=flag tag, X=xpress tag, KD=kinase dead mutant, end=endogenous, EV=empty vector. c, ChIP-seq analyses of RNAPII and P-Ser2 occupancies on expressed RDH genes in HCT116 cells treated with either control (CTRL) or CDK11 siRNA. Transcription elongation “transition” point is indicated by dashed line. n=3 biologically independent experiments. d, P-Ser2/RNAPII normalized ChIP-seq log2 fold change on RDH genes after CDK11 knockdown within differential P-Ser2 MACS2 peaks (depicted as P-Ser2 start (vertical dashed line) and P-Ser2 end). e, HIST1H4E gene tracks with raw RNAPII and P-Ser2 ChIP-seq data and RNAPII, P-Ser2 and P-Ser2/RNAPII log2 fold change after CDK11 depletion. Black line indicates differential peaks identified by MACS2 program (p<0.05). f, CDK11 ChIP-seq occupancy is most abundant just upstream of the differential P-Ser2 MACS2 peaks in RDH genes. The start of the P-Ser2 peaks is indicated by vertical dashed line (see also Fig. 5d for metaplot and heatmap). g, Violin-plots measure RNAPII occupancy on the TSS (top panel, flank 500 nt) and SL or TES (bottom panel, 250 nt upstream and 750 nt downstream) of expressed RDH and 200 highly expressed and randomized genes.
Figure 6
Figure 6. Recruitment of 3´ end processing factor CPSF100 to the RDH genes depends on CDK11-mediated phosphorylation of Ser2.
a, b, c, Graphs present ChIP-qPCR data for CPSF100 (a), RNAPII (b) and P-Ser2 (c) in HCT116 cells transfected with control (siCTRL) or CDK11 (siCDK11) siRNA. qPCR primers were designed in coding regions of RDH genes. n=4, n=3 and n=3 biologically independent experiments for (a), (b) and (c), respectively; error bars=SEM, Ir = intergenic region. d, e. Graphs present ratios of CPSF100/RNAPII (d) and CPSF100/P-Ser2 (e) ChIP-qPCR signals. n=4 and 3 biologically independent experiments for (d) and (e), respectively; error bars=SEM, *P<0.05, Student´s two-sided t-test. f, Subtracted RNA-seq (siCDK11 - siCTRL) RPKM normalized downstream of the SL until the next conserved polyadenylation site (33 RDH genes; distance from 27 nt to 15 kb) (upper panel). The read-through is depicted for indicated individual RDH genes carrying cryptic polyadenylation site downstream of SL (lower panel). Source data for panels a-e are available with the paper on line.
Figure 7
Figure 7. Summary of iCLIP and ChIP-seq data and working model.
a, Each column in the table depicts distribution of iCLIP and ChIP-seq peaks over selected genes either affected or not in CDK11 RNA-seq (Fig. 1a). See Online Methods for further description. The colors of each column represent the following: the density of iCLIP significant cDNA crosslinks (FDR > 0.01), normalized by gene length; the density of CDK11 ChIP–seq bound RPGS inside MACS2 significant peaks (P < 0.05; Supplementary Table 2); log2(fold change) of differentially expressed genes in CDK11 RNA-seq (–1 > log2(fold change) > 1; adjusted P < 0.01; Supplementary Table 1); log2(fold change) of P-Ser2 ChIP–seq RPGC after CDK11 depletion inside the MACS2 differential peaks (P < 0.05; Supplementary Table 5); log2(fold change) of RNAPII ChIP–seq RPGC after CDK11 depletion inside the MACS2 differential peaks (P < 0.05; Supplementary Table 6); and log2(fold change) of P-Ser2/RNAPII-normalized ChIP–seq RPGC after CDK11 depletion inside the MACS2 P-Ser2 differential peaks (P < 0.05; Supplementary Table 5). The groups of genes: 44 regulated RDH (base mean expression>10); 39 low- and non-expressed RDH (base mean expression<10); 10 most down- and up-regulated genes in CDK11 RNA-seq (in fuchsia and blue, respectively), 10 selected cell cycle-related genes (in green). All genes were sorted by base mean expression within each group. Gene symbols are shown on the right. b, Schematic working model. CDK11 regulates transcription elongation of RDH genes and contributes to their 3´end processing. FLASH (grey flash) recruits CDK11 (red oval) collaboratively with nascent RDH mRNAs (black line) to chromatin of RDH genes (grey double helix) and phosphorylates (arrow) Ser2 (red ball) in the CTD (red and grey balls) of RNAPII (violet oval). The Ser2 phosphorylation promotes the RNAPII elongation on RDH genes. CDK11 also phosphorylates FLASH in S-phase which may be needed for its stability and/or yet unknown function in transcription/3´end processing of RDH genes. CDK11 is bound abundantly at the 3´end of RDH mRNAs and this binding likely occurs on or in the close vicinity of RDH chromatin. CDK11-dependent phosphorylation of Ser2 contributes to the recruitment of 3´end processing HCC complex (SYMPLEKIN (blue oval), CPSF100 (green circle), CstF64 (brown circle) and CPSF73 (yellow circle) allowing CPSF73 to cleave nascent RDH mRNA (black line). FLASH interaction with U7 snRNP (white/blue circular complex) also contributes to the recruitment of the HCC to pre-mRNA .

References

    1. Adelman K, Lis JT. Promoter-proximal pausing of RNA polymerase II: emerging roles in metazoans. Nat Rev Genet. 2012;13:720–31. - PMC - PubMed
    1. Fuda NJ, Ardehali MB, Lis JT. Defining mechanisms that regulate RNA polymerase II transcription in vivo. Nature. 2009;461:186–92. - PMC - PubMed
    1. Proudfoot NJ. Transcriptional termination in mammals: Stopping the RNA polymerase II juggernaut. Science. 2016;352 aad9926. - PMC - PubMed
    1. Eick D, Geyer M. The RNA polymerase II carboxy-terminal domain (CTD) code. Chem Rev. 2013;113:8456–90. - PubMed
    1. Harlen KM, Churchman LS. The code and beyond: transcription regulation by the RNA polymerase II carboxy-terminal domain. Nat Rev Mol Cell Biol. 2017;18:263–273. - PubMed

Publication types

MeSH terms