. 2020 Oct;30(10):5446-5454.
doi: 10.1007/s00330-020-06879-6. Epub 2020 May 4.

Imaging features and evolution on CT in 100 COVID-19 pneumonia patients in Wuhan, China

Affiliations

Imaging features and evolution on CT in 100 COVID-19 pneumonia patients in Wuhan, China

Shuchang Zhou et al. Eur Radiol. 2020 Oct.

Abstract

Objectives: To investigate CT images of 100 confirmed COVID-19 pneumonia patients to describe the lesion distribution, CT signs, and evolution during different courses.

Methods: A retrospective study of 100 COVID-19 pneumonia patients without ARDS was performed, and CT scans were reviewed. A COVID-19 pneumonia course diagram was drawn. Mann-Whitney U test was used to compare the lesion distribution and CT scores, χ2 test was used to compare the CT findings between different stages.

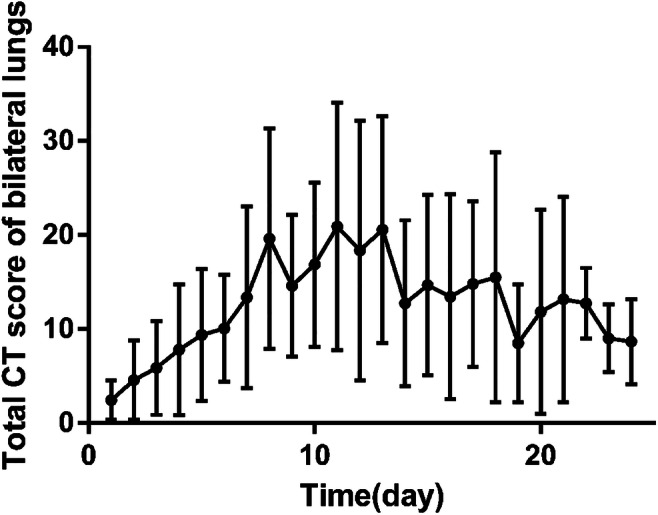
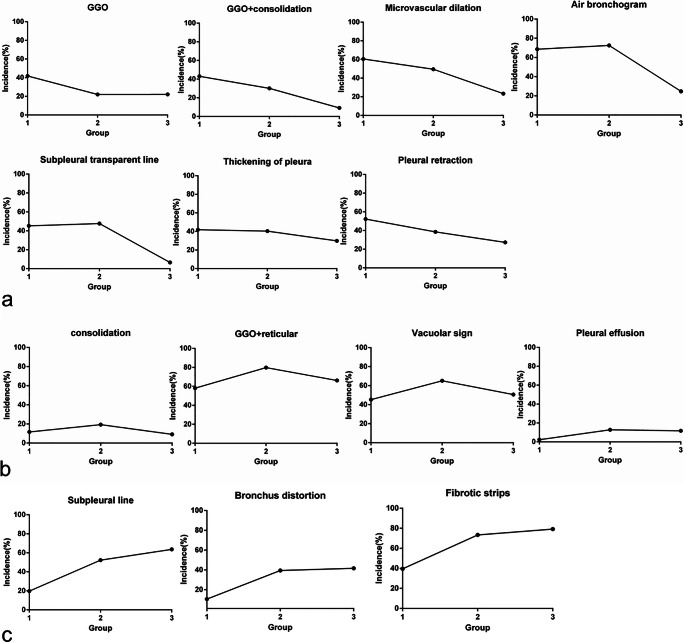
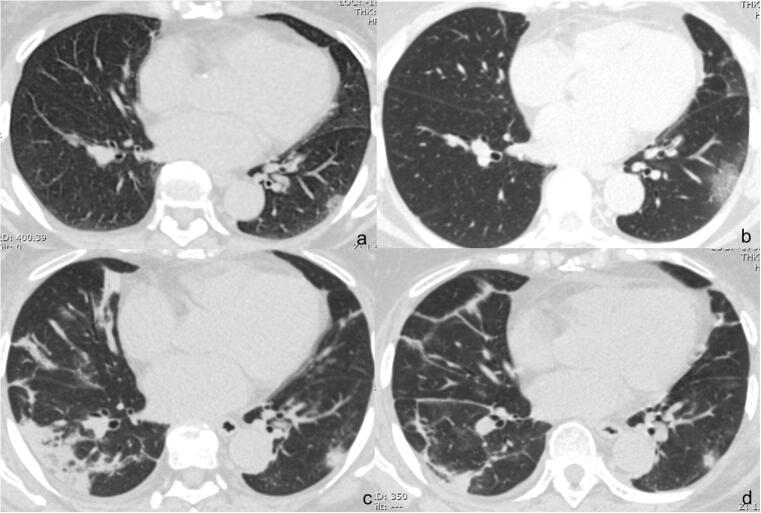
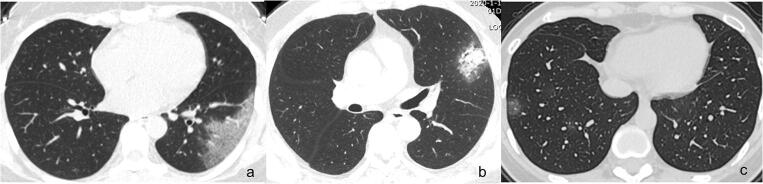
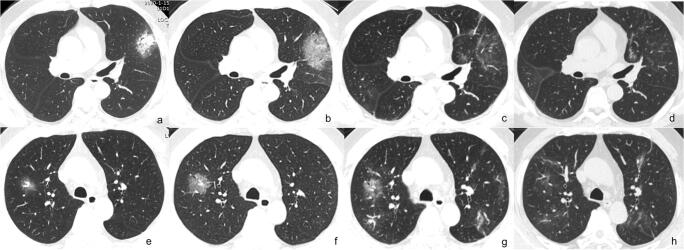
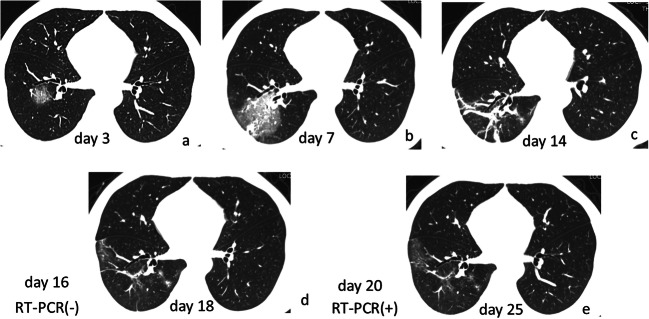
Results: A total of 272 CT scans from 100 patients (mean age, 52.3 years ± 13.1) were investigated. Four patients with lung abnormalities on CT first showed negative RT-PCR result and turned positive afterwards. One hundred sixty-nine (62.1%) showed predominantly peripheral distribution. The CT scores of the upper zone (3.4 ± 3.6) were significantly lower than those of the middle (5.0 ± 3.9) and lower (4.8 ± 3.6) zones (p < 0.001). The CT scores of the anterior zones (4.9 ± 4.7) were significantly lower than those of the posterior zones (8.4 ± 6.2) (p < 0.001). In the early rapid progressive stage (1~7 days), ground glass opacity (GGO) plus reticular pattern (58.1%), GGO plus consolidation (43.0%), and GGO (41.9%) were all common. In the advanced stage (8~14 days), GGO plus consolidation (79.8%) and repairing CT signs (subpleural line, bronchus distortion, and fibrotic strips) showed a significant increase (p < 0.05). In the absorption stage, GGO plus consolidation (9.1%) sharply decreased (p < 0.05).

Conclusion: CT imaging of COVID-19 pneumonia showed a predominantly peripheral, middle and lower, and posterior distribution. The early rapid progressive stage is 1~7 days from symptom onset, the advanced stage with peak levels of abnormalities on CT is 8~14 days, and the abnormalities started to improve after 14 days.

Key points: • The course of COVID-19 pneumonia consists of three stages: 1~7 days is the early rapid progressive stage, 8~14 days is the advanced stage, and after 14 days, the abnormalities started to decrease. • In the early rapid progressive stage, GGO plus a reticular pattern, GGO plus consolidation, and GGO were all common signs; in the advanced stage, signs of progression and absorption coexisted; lung abnormalities showed an asynchronous process with parts with absorption and parts progressing. • Lung abnormalities mainly showed predominantly peripheral, middle, and lower distribution.

Keywords: Computed tomography; Coronavirus; Pneumonia.


Conflict of interest statement

The authors declare that they have no competing interests.

Figures

Fig. 1
Fig. 1
Changes of lung involvement extent on CT according to the time from symptom onset; 1~7 days showed the early rapid progressive stage with involving extent fast progressing, 8~14 days is the advanced stage with the involving extent maintaining a peak plateau level, and after 14 days, the involving extent started to decrease
Fig. 2
Fig. 2
a Seven CT signs decreasing with the course of the disease. GGO, GGO + consolidation, microvascular dilation, air bronchogram, subpleural transparent line, thickening of the pleura, and pleural retraction showed a downward trend with the course of the disease; b 4 CT signs first ascending then descending with the course of the disease. The incidence of consolidation, GGO + reticular, vacuolar sign, and pleural effusion showed a trend of rising first and then falling; c repairing CT signs increasing with the course of the disease. The incidence of the subpleural line, bronchus distortion, and fibrotic strips showed a continuing upward trend
Fig. 3
Fig. 3
Dynamic changes on CT in a COVID-19 pneumonia patient. Female, 46 years old. a A small patch of GGO under the pleura in the lower lobe of the left lung on day 6 from symptom onset; b the range of GGO expanded and manifested as GGO plus reticular pattern on day 9; c the range of GGO plus reticular pattern in the lower lobe of the left lung narrowed and the density became solid; consolidation newly occurred in the lower lobe of the right lung with vacuolar signs inside on day 13; d all previous lung abnormalities obviously absorbed on day 20
Fig. 4
Fig. 4
Main signs in early on CT in the early rapid progressive stage of COVID-19 pneumonia patients. a GGO plus reticular pattern on day 4; b GGO plus consolidation on day 3; c GGO on day 2
Fig. 5
Fig. 5
Asynchronous changes of lung abnormality on CT during the course. Male, 46 years old. a GGO plus consolidation in the upper lobe of the left lung on day 3; b GGO plus consolidation turned into GGO plus reticular pattern on day 8; c, d GGO plus reticular pattern obviously absorbed on day 11 and 14; e GGO in the upper lobe of the right lung on day 3; f increased GGO size on day 8; g GGO plus reticular pattern slightly absorbed but GGO newly occurred in other areas of the upper lobes of both lungs on day 11; h all previous abnormalities obviously absorbed on day 14. On day 11, GGO plus reticular pattern obviously absorbed with GGO progressing in the upper lobes of both lungs, manifested as asynchronous change
Fig. 6
Fig. 6
CT changes in RT-PCR result from negative to positive patient. Male, 41 years old. a GGO in the lower lobe of the right lung on day 3; b GGO plus consolidation with increased size and intensity on day 7; c fibrotic strips on day 14; RT-PCR (−) on day 16; d obvious absorption of fibrotic strips on day 18; RT-PCR turned (+) on day 20; e further absorption of lung abnormalities on day 25

References

    1. World Health Organization. Corona-virus disease (COVID-19) outbreak (https://www.who.int). Accessed 15 Feb 2020
    1. Guan WJ, Ni ZY, Hu Y et al (2020) Clinical characteristics of coronavirus disease 2019 in China. N Engl J Med. 10.1056/NEJMoa2002032 - PMC - PubMed
    1. Huang C, Wang Y, Li X, et al. Clinical features of patients infected with 2019 novel coronavirus in Wuhan, China. Lancet. 2020;395:497–506. doi: 10.1016/S0140-6736(20)30183-5. - DOI - PMC - PubMed
    1. National Health Commission of the People’s Republic of China. http://www.nhc.gov.cn/. Accessed 15 Feb 2020 - PMC - PubMed
    1. Wang D, Hu B, Hu C et al (2020) Clinical characteristics of 138 hospitalized patients with 2019 novel coronavirus-infected pneumonia in Wuhan, China. JAMA. 10.1001/jama.2020.1585 - PMC - PubMed

MeSH terms