Review
. 2020 Apr 29;50(2):99-106.
doi: 10.4274/tjo.galenos.2019.78000.

Artifacts and Anatomic Variations in Optical Coherence Tomography

Affiliations
Review

Artifacts and Anatomic Variations in Optical Coherence Tomography

Atilla Bayer et al. Turk J Ophthalmol. .

Abstract

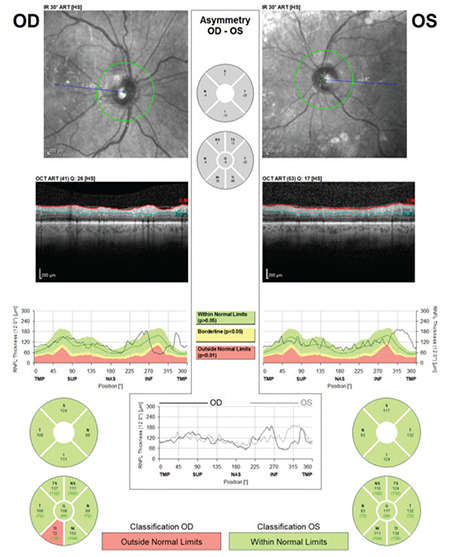
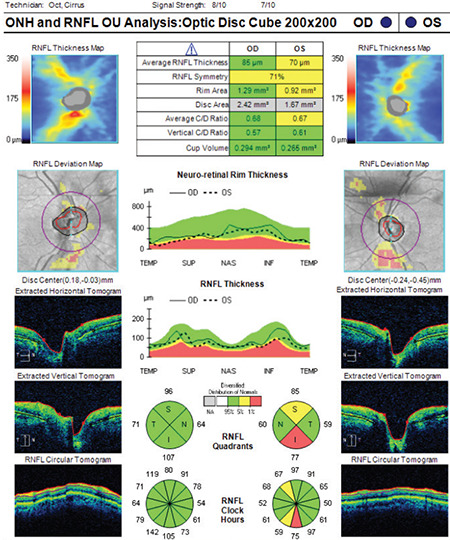
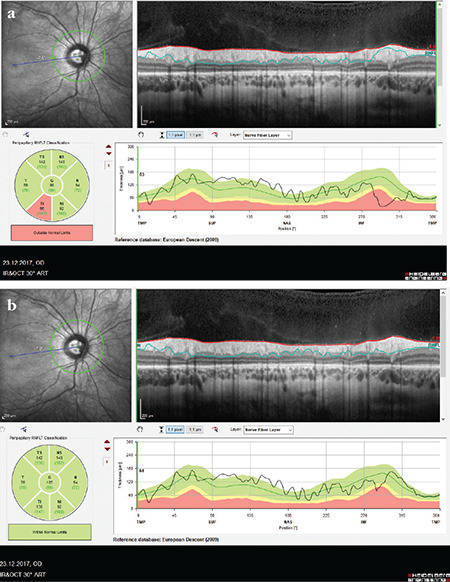
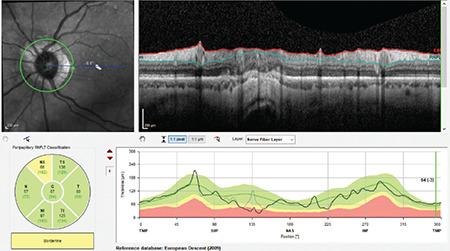
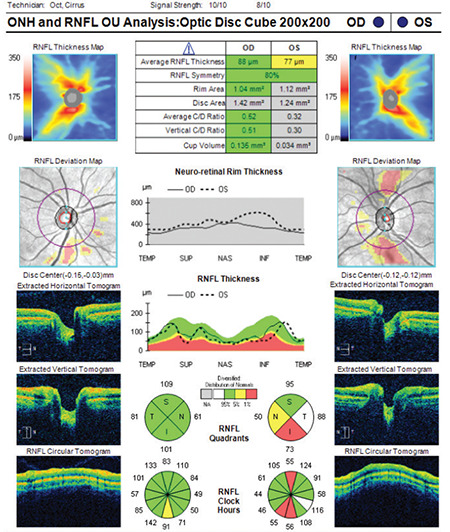
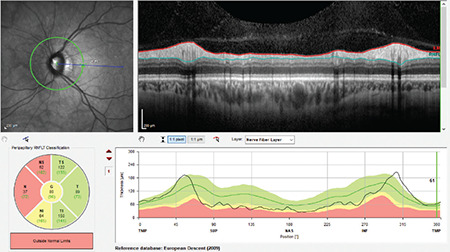
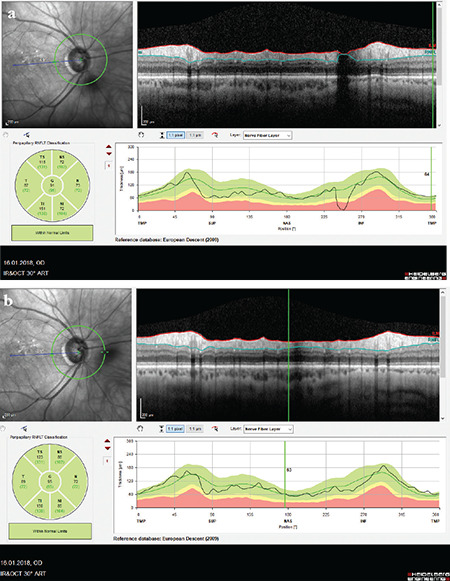
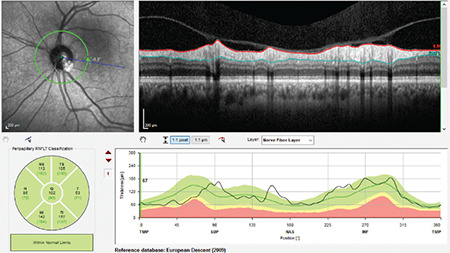
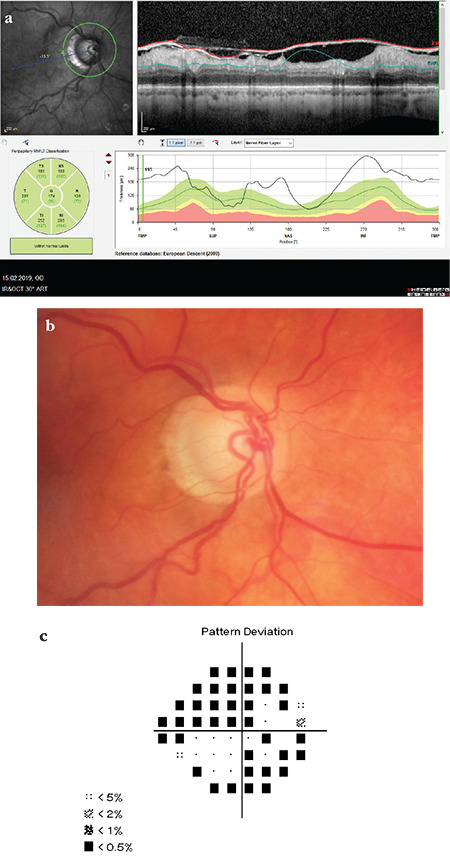
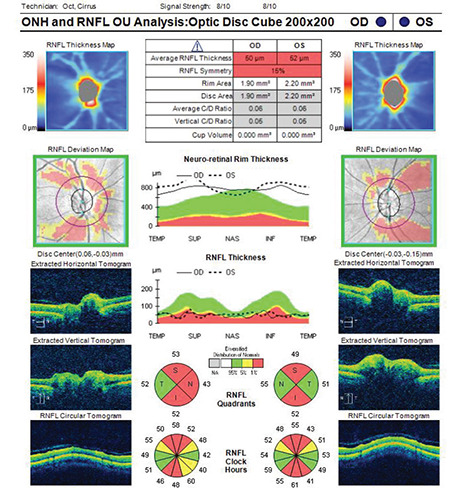
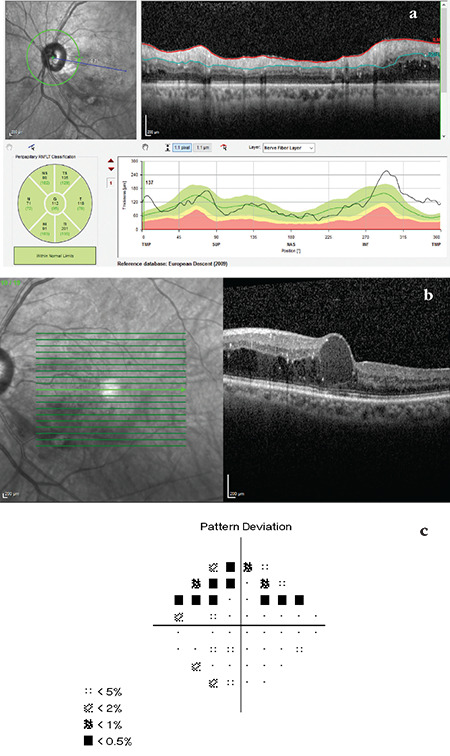
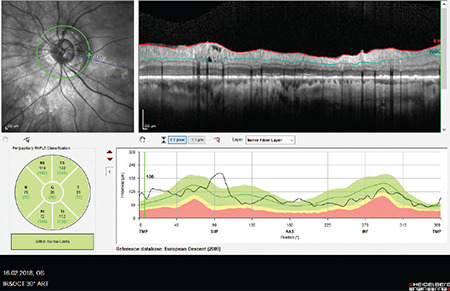
In recent years, ophthalmologists widely depend on optical coherence tomography (OCT), which is an objective, reliable, and repeatable structural test for both early diagnosis of glaucoma and detecting progression of the disease. Using this technology, it is now possible to take measures of various anatomic structures and layers of the optic nerve head, peripapillary retinal nerve fiber layer, and macular area. Although OCT has these powerful capabilities in general, anatomical variations, artifacts related to the ocular pathologies, and issues with image acquisition can be present in up to one-third of scans. These anatomical variations and artifacts can be misleading to an interpreter and may lead to erroneous conclusions. This review focuses on the realization and prevention of most common anatomical variations and artifacts observed with OCT imaging. The concepts of floor effect and red and green diseases are also investigated.

Keywords: OCT anatomic variations; OCT artifacts; Optical coherence tomography; green disease; red disease.


Conflict of interest statement

Conflict of Interest: No conflict of interest was declared by the authors.

Figures

Figure 1
Figure 1
(Spectralis OCT) Example of a scan with low quality score for the left eye of a patient with cataract. Note that the quality coefficient (Q) is 26 on the right and 17 on the left. In the RNFL profile image of the left eye, RNFL thickness measurements are artificially high in the inferior and temporal regions due to incorrect detection of the RNFL border by the device algorithm RNFL: Retinal nerve fiber layer, OCT: Optical coherence tomography
Figure 2
Figure 2
(Cirrus HD-OCT) Although signal strength is within normal range (≥ 6), there are significant motion artifacts in the deviation map of the right eye (note the breaks in the blood vessels). Similar motion artifacts are also present in the RNFL deviation map of the left eye. Average RNFL thickness is 85 μm in the right eye and 70 μm in the left eye. While the TSNIT profile and RNFL classification are within normal limits in the right eye, there are abnormalities in some sectors of the left eye RNFL: Retinal nerve fiber layer, OCT: Optical coherence tomography
Figure 3
Figure 3
(Spectralis OCT) Segmentation artifact in the inferotemporal region in a myopic patient. Due to incorrect detection of the RNFL border by the device (in the upper right RNFL profile image), RNFL thickness measurement was artificially low in an area of approximately one sector, and peripapillary RNFL thickness was classified as abnormal in that sector. When the RNFL border is manually shifted to its normal position using the device settings, RNFL thickness returns to normal values and peripapillary RNFL thickness in the inferotemporal sector is also classified as normal RNFL: Retinal nerve fiber layer, OCT: Optical coherence tomography
Figure 4
Figure 4
(Spectralis OCT) Segmentation error resulting from the passage of the scanning ring over an atrophic area in the superonasal region of a myopic patient with peripapillary atrophy. Values on the TSNIT profile are close to zero and peripapillary RNFL classification is borderline in that area RNFL: Retinal nerve fiber layer, OCT: Optical coherence tomography
Figure 5
Figure 5
(Cirrus HD-OCT) The superior RNFL bundles of both eyes of this patient show split RNFL defect. On the TSNIT profile, the superior vertex in both eyes is split into two peaks separated by a valley. In addition, a displaced RNFL configuration which is more prominent in the left eye is observed in the inferior quadrants of both eyes. Average RNFL thickness is within normal limits on the right and borderline on the left RNFL: Retinal nerve fiber layer, OCT: Optical coherence tomography
Figure 6
Figure 6
(Spectralis OCT) In the TSNIT profile of a myopic patient, RNFL thickness values in the nasal sectors appear low due to temporal displacement of the RNFL peaks. This occurs because the peaks do not align with expected positions in TSNIT graphs based on the normative database RNFL: Retinal nerve fiber layer, OCT: Optical coherence tomography
Figure 7
Figure 7
(Spectralis OCT) A Weiss ring coinciding with the laser scanning region causes a segmentation artifact in the inferonasal sector of the right optic disc due to shadowing. On the TSNIT profile, it is seen that RNFL thickness has a value of 0 in this region (a). Upon movement of the eye, the Weiss ring also moved and the device’s algorithm performed segmentation correctly in the inferonasal region. The Weiss ring in the nasal region produces minimal shadowing that does not impair segmentation (b) RNFL: Retinal nerve fiber layer, OCT: Optical coherence tomography
Figure 8
Figure 8
(Spectralis OCT) Areas of pronounced vitreoretinal traction are seen upon examination of the vitreoretinal interface in the RNFL profile of a patient being followed due to ocular hypertension. In the TSNIT profile, RNFL thickness is higher than expected normal values in certain areas in the superonasal region. Peripapillary RNFL thickness is classified as above normal in most sectors RNFL: Retinal nerve fiber layer, OCT: Optical coherence tomography
Figure 9
Figure 9
(Spectralis OCT) Segmentation is completely disrupted in a patient with substantial ILM thickening. Peripapillary RNFL classification appears to be within normal limits in all sectors, and analysis of the sectors shows that average RNFL thickness values are much higher than expected average values. The same findings are seen in the TSNIT profile (a). Disc photography shows prominent glaucomatous pitting and peripapillary atrophy (b). There is significant glaucomatous visual field loss in the same eye (c). Note that OCT RNFL classification appears to be within normal limits in all sectors RNFL: Retinal nerve fiber layer, OCT: Optical coherence tomography
Figure 10
Figure 10
(Cirrus HD-OCT) Quality score is within normal limits in a scan from a patient with optic nerve head drusen. However, note that although the diameter of the disc is normal, the cup volume value is 0. Despite significant RNFL thinning, neuroretinal rim thickness is higher than normal values in optic nerve head measurements RNFL: Retinal nerve fiber layer, OCT: Optical coherence tomography
Figure 11
Figure 11
(Spectralis OCT) All sectors are green in the RNFL classification graph of a glaucoma patient with diabetic retinopathy and macular edema. In the TSNIT profile, the thickness curve is seen to be above normal limits in the inferotemporal, temporal, and superotemporal regions (a). Macular OCT analysis shows diabetic macular edema (b). Central 24-2 visual field testing demonstrates glaucomatous superior arcuate defect (c). Note that the sector classifications are completely within normal limits in the OCT RNFL examination of this patient RNFL: Retinal nerve fiber layer, OCT: Optical coherence tomography
Figure 12
Figure 12
(Spectralis OCT) Peripapillary retinoschisis in the superior quadrant is apparent in a myopic patient (see RNFL profile image in the upper right). Note that the RNFL thickness curve is well above expected values in the location corresponding to the region of retinoschisis in the TSNIT profile RNFL: Retinal nerve fiber layer, OCT: Optical coherence tomography

References

    1. Stein JD, Talwar N, Laverne AM, Nan B, Lichter PR. Trends in use of ancillary glaucoma tests for patients with open-angle glaucoma from 2001 to 2009. Ophthalmology. 2012;119:748–758. - PMC - PubMed
    1. Gabriele ML, Wollstein G, Ishikawa H, Kagemann L, Xu J, Folio LS, Schuman JS. Optical coherence tomography: history, current status, and laboratory work. Invest Ophthalmol Vis Sci. 2011;52:2425–2436. - PMC - PubMed
    1. Dong ZM, Wollstein G, Schuman JS. Clinical utility of optical coherence tomography in glaucoma. Invest Ophthalmol Vis Sci. 2016;57:556–567. - PMC - PubMed
    1. Güngör SG, Akman A. Are all retinal nerve fiber layer defects on optic coherence tomography glaucomatous? Turk J Ophthalmol. 2017;47:267–273. - PMC - PubMed
    1. Asrani S, Essaid L, Alder BD, Santiago-Turla C. Artifacts in spectraldomain optical coher-ence tomography measurements in glaucoma. JAMA Ophthalmol. 2014;132:396–402. - PubMed