. 2020 May 5:9:e54160.
doi: 10.7554/eLife.54160.

Synergistic and antagonistic drug interactions in the treatment of systemic fungal infections

Affiliations

Synergistic and antagonistic drug interactions in the treatment of systemic fungal infections

Morgan A Wambaugh et al. Elife. .

Abstract

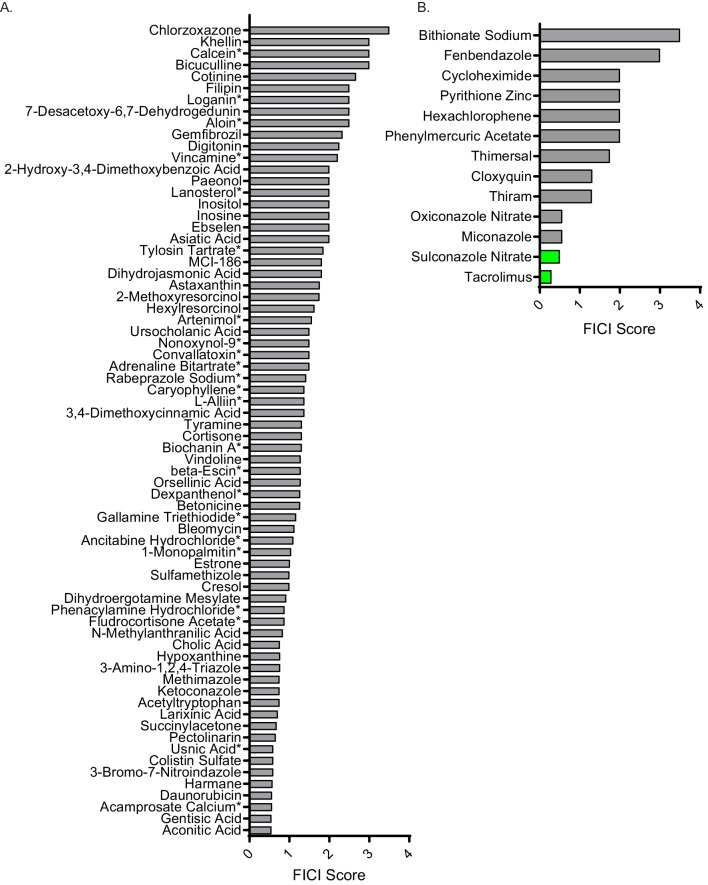
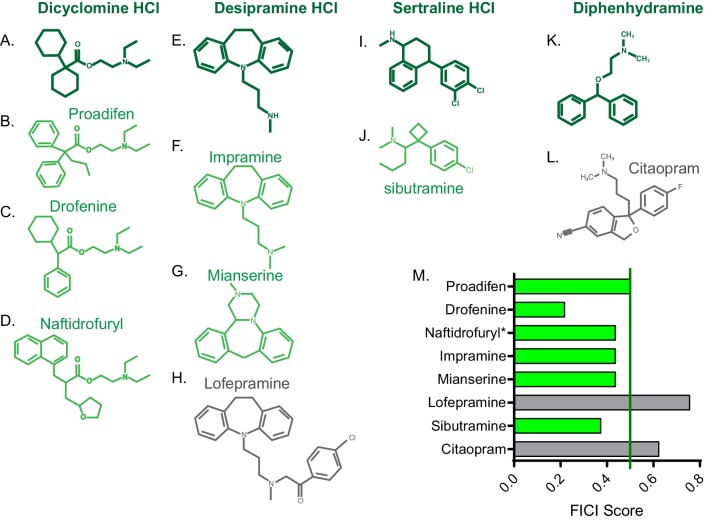
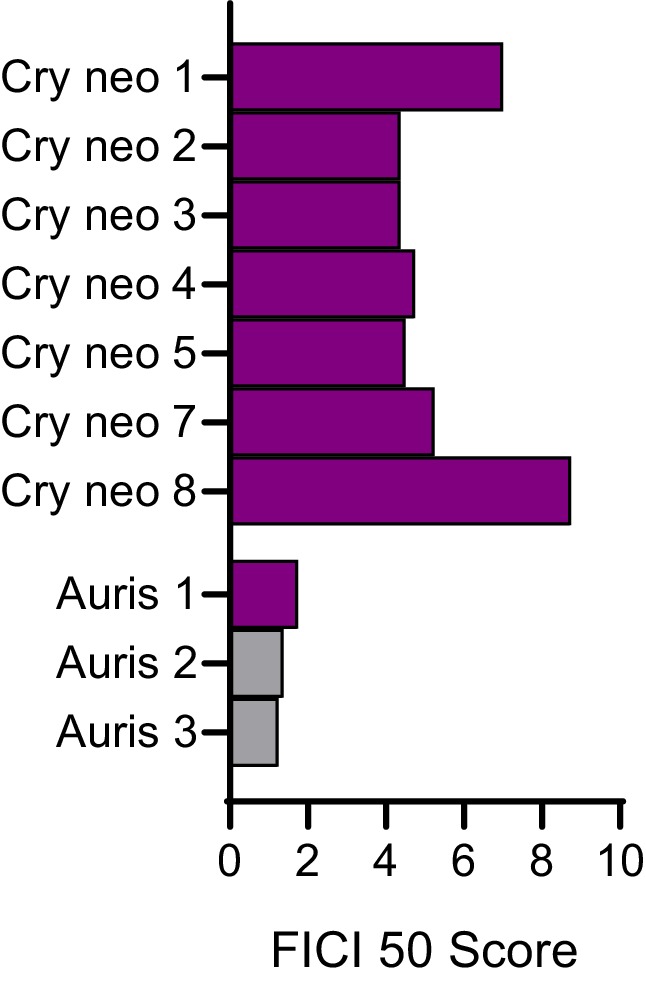
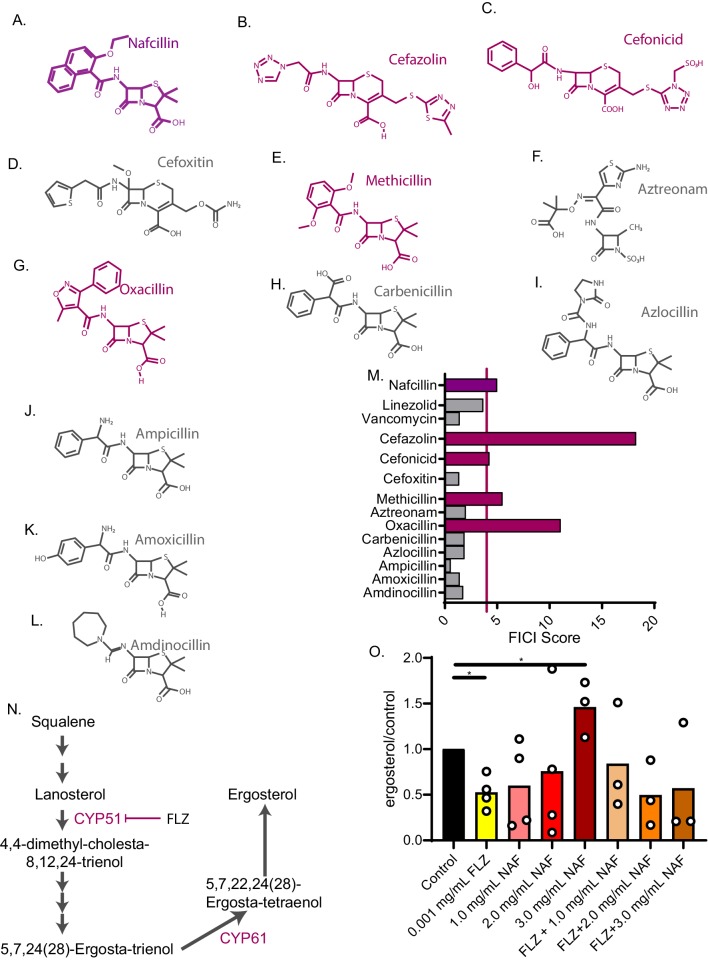
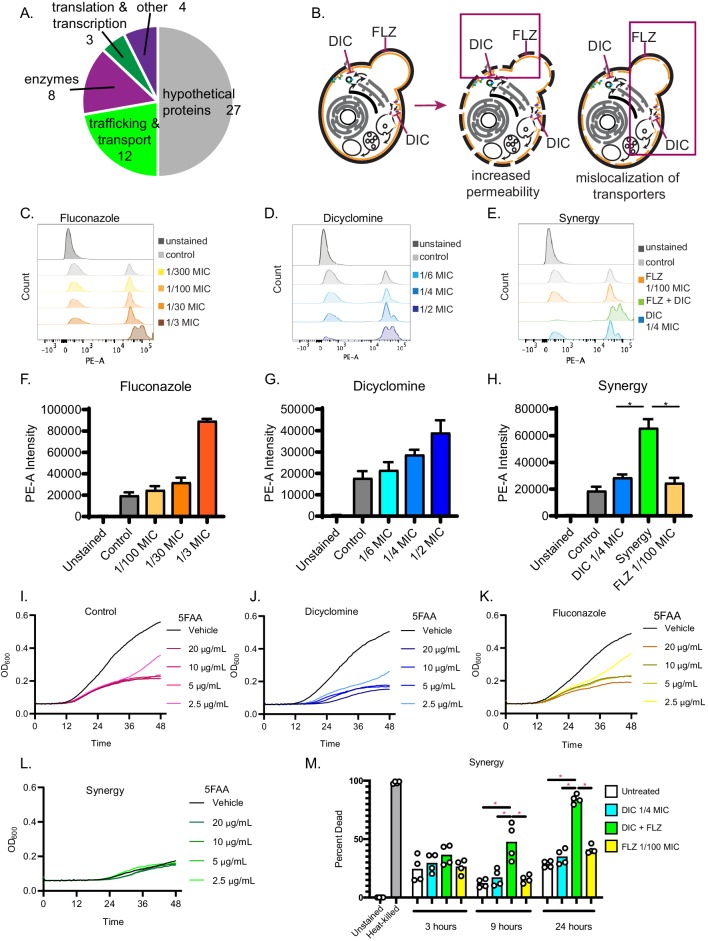
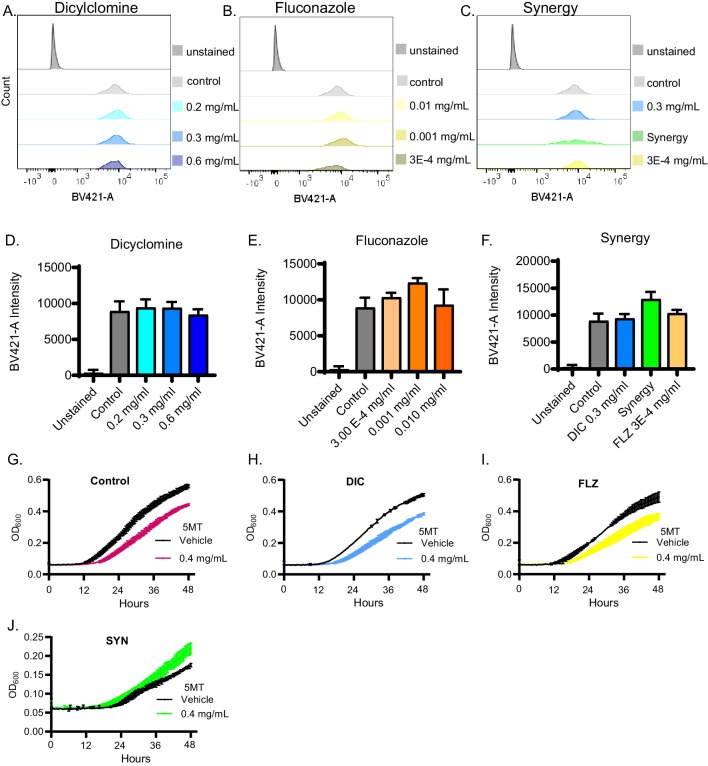
Invasive fungal infections cause 1.6 million deaths annually, primarily in immunocompromised individuals. Mortality rates are as high as 90% due to limited treatments. The azole class antifungal, fluconazole, is widely available and has multi-species activity but only inhibits growth instead of killing fungal cells, necessitating long treatments. To improve treatment, we used our novel high-throughput method, the overlap2 method (O2M) to identify drugs that interact with fluconazole, either increasing or decreasing efficacy. We identified 40 molecules that act synergistically (amplify activity) and 19 molecules that act antagonistically (decrease efficacy) when combined with fluconazole. We found that critical frontline beta-lactam antibiotics antagonize fluconazole activity. A promising fluconazole-synergizing anticholinergic drug, dicyclomine, increases fungal cell permeability and inhibits nutrient intake when combined with fluconazole. In vivo, this combination doubled the time-to-endpoint of mice with Cryptococcus neoformans meningitis. Thus, our ability to rapidly identify synergistic and antagonistic drug interactions can potentially alter the patient outcomes.

Keywords: Cryptococcus neoformans; drug combination; drug discovery; fungal infection; genetics; genomics; infectious disease; microbiology.

Plain language summary

Individuals with weakened immune systems – such as recipients of organ transplants – can fall prey to illnesses caused by fungi that are harmless to most people. These infections are difficult to manage because few treatments exist to fight fungi, and many have severe side effects. Antifungal drugs usually slow the growth of fungi cells rather than kill them, which means that patients must remain under treatment for a long time, or even for life. One way to boost efficiency and combat resistant infections is to combine antifungal treatments with drugs that work in complementary ways: the drugs strengthen each other’s actions, and together they can potentially kill the fungus rather than slow its progression. However, not all drug combinations are helpful. In fact, certain drugs may interact in ways that make treatment less effective. This is particularly concerning because people with weakened immune systems often take many types of medications. Here, Wambaugh et al. harnessed a new high-throughput system to screen how 2,000 drugs (many of which already approved to treat other conditions) affected the efficiency of a common antifungal called fluconazole. This highlighted 19 drugs that made fluconazole less effective, some being antibiotics routinely used to treat patients with weakened immune systems. On the other hand, 40 drugs boosted the efficiency of fluconazole, including dicyclomine, a compound currently used to treat inflammatory bowel syndrome. In fact, pairing dicyclomine and fluconazole more than doubled the survival rate of mice with severe fungal infections. The combined treatment could target many species of harmful fungi, even those that had become resistant to fluconazole alone. The results by Wambaugh et al. point towards better treatments for individuals with serious fungal infections. Drugs already in circulation for other conditions could be used to boost the efficiency of fluconazole, while antibiotics that do not decrease the efficiency of this medication should be selected to treat at-risk patients.


Conflict of interest statement

MW, SD, MA, BB, MS, JB No competing interests declared

Figures

Figure 1.
Figure 1.. High-throughput screening for fluconazole interacting molecules using synergy prediction mutants.
(A) Outline of overlap2 method (O2M), which is also presented in Brown et al., Wambaugh et al., and Wambaugh and Brown. O2M requires a chemical-genetic dataset which can be generated by growing a collection of mutants in the presence of >100 small molecules individually. Growth scores are then calculated for each small molecule + mutant combination. In the heatmaps, the vertical line represents a different mutant. Blue represents slower growth compared to wild-type cells and yellow represents faster growth compared to wild-type cells. Comparing our starting drug (FLZ) and known synergistic molecules, we can identify genes whose knockout mutants show similar growth scores to the starting drug and all known synergistic partners (red arrows). These are the synergy prediction mutants. (B) Screening method to identify molecules that synergize with FLZ as well as anti-C. neoformans molecules. Synergy prediction mutants are created (red chromosome indicates gene knockout) and both synergy prediction mutant and wild type are grown in the library of small molecules (top section). Growth of wild type and synergy prediction mutants are accessed. Greyed out dotted yeast cell indicates differential growth compared to wild type (middle section). These molecules are then validated in a checkerboard assay (bottom section).
Figure 2.
Figure 2.. Synergistic and antagonistic molecules identified from high-throughput screen.
(A) Average fractional inhibitory concentration index (FICI) score of synergistic molecules identified from our high-throughput screen. Color of bar corresponds with bioactivities listed in B. FICIs are listed in linear scale. Source data are in Figure 2—source data 1. (B) Categories of bioactivities of synergistic molecules with the corresponding number of molecules in each category. (C) FICI scores in log2 scale of antagonistic molecules from screen. Colors correspond with bioactivities listed in D. Source data are in Figure 2—source data 2 (D) Categories of bioactivities of antagonistic molecules with corresponding number of molecules. All bioactivities came from Microsource Spectrum molecule list which is also seen in Table 1. (E) Representation of percentage of molecules from the entire Microsource Spectrum Library predicted to synergize with fluconazole based on screening results (top), molecules tested in various assays (middle), and molecules yielding an interaction from checkerboards (bottom). * represents FICI for 50% inhibition of C. neoformans (when 90% inhibition was not found). All other scores listed are the FICI for 90% inhibition (FICI90) unless otherwise stated. Molecules not tested were not available commercially. All average FICI scores represent an average of at least two independent tests, performed in our prior works (Brown et al., 2014; Wambaugh and Brown, 2018; Wambaugh et al., 2017). All data are against C. neoformans strain CM18.
Figure 2—figure supplement 1.
Figure 2—figure supplement 1.. Bliss independence scores of non-single agent molecules.
Average bliss independence score of molecules at (A) 10 µM and (B) 100 nM. Molecules were considered synergistic if they exhibited a negative score in both concentrations the majority of times tested (green labels). Average scores represent a minimum of two independent replicates. Error bars represent the standard deviation. Source data are in Figure 2—source data 3.
Figure 2—figure supplement 2.
Figure 2—figure supplement 2.. FICI scores of non-interacting molecules and general antifungals.
(A) Fractional inhibitory concentration index (FICI) of molecules identified from our high-throughput screen that did not interact with FLZ. (B) FICI scores of molecules identified as general anti-C. neoformans molecules from our high-throughput screen. Synergistic interactions with FLZ labeled in green and non-interacting molecules labeled in grey. * represents FICI for 50% inhibition of C. neoformans all others are FICI for 90% inhibition. Average FICI scores represent a minimum of two independent replicates. Source data are in Figure 2—source data 4. All data are against C. neoformans strain CM18.
Figure 3.
Figure 3.. FICI scores of structurally similar molecules.
Chemical structure of (A) dicyclomine HCl and structurally similar molecules (B) proadifen, (C) drofenine, and (D) naftidrofuryl. Chemical structure of (E) desipramine HCl and structurally similar molecules (F) impramine, (G) mianserine, and H) lofepramine. Chemical structure of (I) sertraline HCl and structurally similar (J) sibutramine. Chemical structure of (K) diphenhydramine HCl and structurally similar (L) citalopram. (M) Fractional inhibitory concentration index (FICI) score of structurally similar molecules. Synergistic interactions with FLZ labeled in green and non-interacting molecules labeled in grey. * represents FICI for 50% inhibition of C. neoformans strain CM18 all others listed are FICI for 90% inhibition. Average FICI scores represent a minimum of two independent replicates. All average FICI scores represent an average of at least two independent tests. Source data are Figure 3—source data 1.
Figure 4.
Figure 4.. Synergistic and antagonistic combinations affect other fungal strains and species.
Fractional inhibitory concentration index (FICI) scores of synergistic and antagonistic combinations with FLZ in other fungal strains/species for (A) Sertraline (B) Clomipramine HCl (C) Benzalkonium Cl (D) Berbamine HCl (E) Dicyclomine HCl (F) Fluocinolone Acetonide (G) Xylometazoline HCl (H) Dehydroepiandrosterone (I) 3-Amino-beta-pinene (J) Ivermectin (K) Bismuth Subsalicylate (L) Estriol (M) Nafcillin Sodium. * represents FICI for 50% inhibition all other scores listed are the FICI90. Strains/species listed on left and Supplementary file 4. CM18 (top) represents original result. Green bars represent FICI scores ≤ 0.5 yielding a synergistic result. Violet bars represent FICI scores ≥ 4 yielding an antagonistic result. No interactions are in grey bars. FICI Scores presented in either linear or log2 scale. HCl = hydrochloride, Cl = chloride. All average FICI scores represent an average of at least two independent tests. Source data are Figure 4—source data 1.
Figure 4—figure supplement 1.
Figure 4—figure supplement 1.. Nafcillin is antagonistic in most FLZ resistant strains and species.
Fractional inhibitory concentration index (FICI) scores of nafcillin in combination with FLZ in clinical isolates of C. neoformans and Candida auris that are considered FLZ resistant. All scores are FICI 50. Violet bars represent FICI scores ≥ 4 yielding an antagonistic result. No interactions are in grey bars. Source data are available in Figure 4—source data 5.
Figure 4—figure supplement 2.
Figure 4—figure supplement 2.. Dicyclomine is synergistic in most FLZ resistant strains and species.
Fractional inhibitory concentration index (FICI) scores of dicyclomine in combination with FLZ in clinical isolates of C. neoformans and Candida auris that are considered FLZ resistant. * represent FICI 50 all others are FICI 90. Green bars represent FICI scores ≤ 0.5 yielding a synergistic result. Source data are available in Figure 4—source data 3.
Figure 5.
Figure 5.. Nafcillin Sodium affects ergosterol levels.
Molecular structures of beta-lactam antibiotics shown for (A) Nafcillin Sodium (B) Cefazolin (C) Cefonicid (D) Cefoxitin (E) Methicillin (F) Aztreonam (G) Oxacillin (H) Carbenicillin (I) Azlocillin (J) Ampicillin (K) Amoxicillin (L) Amdinocillin. (M) FICI scores for 50% inhibition of C. neoformans of various antibiotics related to nafcillin sodium tested with fluconazole. Violet bars over the red line illustrate a FICI score of ≥4 indicating antagonism. (N) Ergosterol biosynthesis pathway illustrating cytochrome P450 enzymes. (O) Ergosterol quantification from cell treated with Nafcillin (NAF), FLZ, or NAF+FLZ. Data normalized to control treated. *=p value is 0.03 (Mann-Whitney test). All average FICI scores represent an average of at least two independent tests (technical and biological replicates). Source data are in Figure 5—source data 1.
Figure 6.
Figure 6.. Dicyclomine affects permeability and nutrient transporters.
(A) Pie chart with processes of deletion mutants that were resistant to dicyclomine. Numbers represent number of mutants. (B) Prediction for dicyclomine (DIC) + FLZ synergy mechanism. (C–E) Representative flow plots of propidium iodide staining. (F–H) Quantification of propidium iodide staining. Data are averages of three independent replicates. (I–L) Growth curves of C. neoformans with and without various concentrations of 5-FAA in addition to control (1x YNB + 2% glucose), dicyclomine (0.3 mg/mL or ¼ MIC), fluconazole (0.1 µg/mL or 1/100 MIC), or synergy (0.3 mg/mL dicyclomine + 0.1 µg/mL FLZ) treatment. Each experiment contained four technical replicates that were inoculated from the same culture. The lines represent the average of two experiments are presented in the figure. Source data are in Figure 6—source data 1. (M) Quantification of percent of dead cells after treatment with dicyclomine, FLZ, or synergy after 3, 9, and 24 hr. *=p value is 0.0286 (Mann-Whitney).
Figure 6—figure supplement 1.
Figure 6—figure supplement 1.. Dicyclomine additional effects on fungal chitin staining and nutrient intake.
(A–C) Representative flow cytometry of Calcofluor white staining with various concentrations of Dicyclomine (DIC) (blue), FLZ (yellow), or synergy (green). (D–F) Quantification of average fluorescence intensity of calcofluor white staining flow cytometry. Average of three replicates shown. (G–J) Growth curves of C. neoformans with or without 0.4 mg/mL of 5-MT after treatment with (G) control, (H) dicyclomine, (I) FLZ, or (J) Synergy (SYN). Source data are in Figure 6—figure supplement 1—source data 1. 100,00 cells were counted for each flow cytometry sample.
Figure 6—figure supplement 2.
Figure 6—figure supplement 2.. Fungicidal effects of dicyclomine and combination treatment.
Representative flow plots for dicyclomine (A) fluconazole (B) synergistic combination (C) and amphotericin B (AMB) (D) showing the gates for live and dead cells. Quantification of percent of dead cells for dicyclomine (E) fluconazole (F) synergistic combination (G) and amphotericin B (H). **** represent p<0.0001 compared to untreated (uncorrected Fisher’s LSD). Quantification of percent of dead cells after treatment for 3 hr (I) 9 hr (J) and 24 hr (K). * represents p=0.02, ** represents p=0.008, *** represent p>0.001 and<0.001 , **** represents p<0.0001 compared to untreated (uncorrected Fisher’s LSD). Heat-killed cells were plated out for survival (Figure 6—source data 2).
Figure 7.
Figure 7.. Dicyclomine + FLZ synergy increases survival of mice with cryptococcosis Survival of CD-1 outbred mice given FLZ (8 mg/kg), DIC low (1.15 mg/kg), DIC high (2.30 mg/kg), Synergy (SYN) low (FLZ + 1.15 mg/kg DIC), SYN high (FLZ + 2.30 mg/kg DIC) or PBS treatments.
N = 10. ; **=p value is 0.0036 (Mantel-Cox test).
Figure 7—figure supplement 1.
Figure 7—figure supplement 1.. C. neoformans disseminates by 8 days in CD-1 outbred mice.
Fungal burden of C. neoformans in CD-1 outbred mice at 8 days post infection.

Similar articles

Cited by

References

    1. Ahmad A, Khan A, Khan LA, Manzoor N. In vitro synergy of eugenol and methyleugenol with fluconazole against clinical candida isolates. Journal of Medical Microbiology. 2010;59:1178–1184. doi: 10.1099/jmm.0.020693-0. - DOI - PubMed
    1. Almeida F, Rodrigues ML, Coelho C. The still underestimated problem of fungal diseases worldwide. Frontiers in Microbiology. 2019;10:214. doi: 10.3389/fmicb.2019.00214. - DOI - PMC - PubMed
    1. Anderson TM, Clay MC, Cioffi AG, Diaz KA, Hisao GS, Tuttle MD, Nieuwkoop AJ, Comellas G, Maryum N, Wang S, Uno BE, Wildeman EL, Gonen T, Rienstra CM, Burke MD. Amphotericin forms an extramembranous and fungicidal sterol sponge. Nature Chemical Biology. 2014;10:400–406. doi: 10.1038/nchembio.1496. - DOI - PMC - PubMed
    1. Applen Clancey S, Ciccone EJ, Coelho MA, Davis J, Ding L, Betancourt R, Glaubiger S, Lee Y, Holland SM, Gilligan P, Sung J, Heitman J. Cryptococcus deuterogattii VGIIa infection associated with travel to the Pacific northwest outbreak region in an Anti-Granulocyte-Macrophage Colony-Stimulating factor Autoantibody-Positive patient in the united states. mBio. 2019;10:e02733. doi: 10.1128/mBio.02733-18. - DOI - PMC - PubMed
    1. Arthington-Skaggs BA, Lee-Yang W, Ciblak MA, Frade JP, Brandt ME, Hajjeh RA, Harrison LH, Sofair AN, Warnock DW, Candidemia Active Surveillance Group Comparison of visual and spectrophotometric methods of broth microdilution MIC end point determination and evaluation of a sterol quantitation method for in vitro susceptibility testing of fluconazole and itraconazole against trailing and nontrailing candida isolates. Antimicrobial Agents and Chemotherapy. 2002;46:2477–2481. doi: 10.1128/AAC.46.8.2477-2481.2002. - DOI - PMC - PubMed

Publication types