. 2020 Apr 20:13:3277-3287.
doi: 10.2147/OTT.S246031. eCollection 2020.

Chrysin Induced Cell Apoptosis and Inhibited Invasion Through Regulation of TET1 Expression in Gastric Cancer Cells

Affiliations

Chrysin Induced Cell Apoptosis and Inhibited Invasion Through Regulation of TET1 Expression in Gastric Cancer Cells

Xiaowei Zhong et al. Onco Targets Ther. .

Erratum in

Abstract

Objective: Ten-eleven translocation (TET) enzymes that oxidize a 5-methylcytosine (5mC) to yield 5-hydroxymethylcytosine (5hmC) have been responsible for fine-tuning methylation patterns and exhibit role in epigenetic modifications. Chrysin, a natural flavone frequently present in honey, has been recognized to exhibit anti-tumor properties. In this study, we investigated the effects of Chrysin in the expression pattern of TET proteins in gastric cancer (GC) cells.

Materials and methods: Using qRT-PCR and Western blot analysis, we analyzed the expression of TET1 in GC cells in vitro following treatment with Chrysin. Immunofluorescence staining detected the expression levels of 5mC and 5hmC. Flow cytometry, wound healing, and Matrigel invasion assays were performed to determine cell proliferation, cell cycle, apoptosis, and migration and invasion of GC cells following treatment with Chrysin, si-TET1, and TET1-KO. Furthermore, a xenograft model was developed to analyze the expression pattern of TET1 on tumor development in vivo.

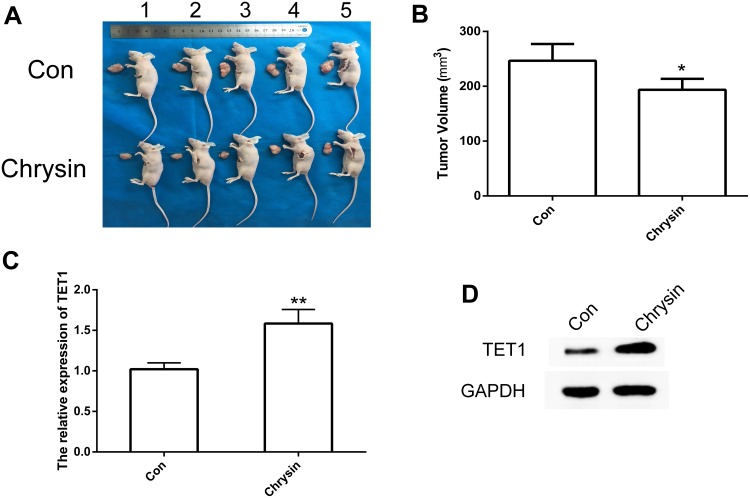
Results: qRT-PCR and Western blot assays indicated that treatment with Chrysin significantly promoted the expression of TET1 in GC cells. Immunofluorescence study further confirmed that TET1 and 5hmC levels were significantly enhanced following treatment with Chrysin in MKN45 cells. Moreover, our results suggested that Chrysin could noticeably induce cell apoptosis and inhibit cell migration and invasion. Further, knockdown and overexpression of TET1 were conducted to investigate whether TET1 expression affected cell apoptosis, and cell migration and invasion in MKN45 cells. The results indicated that overexpression of TET1 markedly promoted cell apoptosis and inhibited cell migration and invasion. Furthermore, the TET1 gene knocked out was generated using the CRISPR/Cas9 system. Our data suggested that TET1 expression was associated with GC tumor growth in vivo.

Conclusion: This study indicated that Chrysin exerted anti-tumor effects through the regulation of TET1 expression in GC and presented TET1 as a novel promising therapeutic target for GC therapy.

Keywords: 5hmC; Chrysin; TET1; cell apoptosis; cell invasion.


Conflict of interest statement

The authors declare that they have no competing interests in this work.

Figures

Figure 1
Figure 1
Analysis of TET1 expression pattern after treatment with Chrysin. Relative expression of TET1 between GES-1 and MKN45 cells (A). The cell growth was analyzed by CCK8 assay (B). Relative expression of TETs was analyzed by qRT-PCR after treatment with Chrysin in MKN45 cells (C). The expression of TET1 was analyzed by Western blot assay (D). Immunofluorescence localization of TET1 after treatment with Chrysin (E). Green, indicates TET1. Blue, indicates Hoechst. Statistical analyses of TET1 fluorescence intensity (F). Immunofluorescence localization of 5mC and 5hmC (G). Green, indicates 5mC. Red, indicates 5hmC. Blue, indicates Hoechst. Statistical analyses of 5mC and 5hmC+ fluorescence intensity (H). The bar represents 50 μm. * (p < 0.05), **  (p < 0.01) and *** (p < 0.005) indicate statistically significant differences.
Figure 2
Figure 2
Analysis of cell apoptosis, cell cycle, and cell migration and invasion in GC cells. Cell apoptosis was analyzed after treatment with Chrysin (A). Statistical analysis of the percentage of cell apoptosis (B). The cell cycle was analyzed after treatment with Chrysin (C). Statistical analysis of the percentage of cells in the major phases of the cell cycle (D). Cell migration was analyzed after treatment with Chrysin (E). Statistical analysis of cell migration with wound closure assay (F). The cell invasion was analyzed after treatment with Chrysin (G). Statistical analysis of the cell invasion (H). * (p < 0.05), ** (p < 0.01) and *** (p < 0.005) indicate statistically significant differences.
Figure 3
Figure 3
Analysis of TET1 expression pattern in MKN45 cells. Relative expression of TET1 in Nc, FH-TET1-pEF, and si-TET1 groups (A) using qPCR. The expression of TET1 using Western blot assay (B). The cell growth was analyzed by CCK8 assay (C). Immunofluorescence localization of TET1 (D). Green, indicates TET1. Blue, indicates Hoechst. Statistical analyses of TET1 fluorescence intensity (E). Immunofluorescence localization of 5mC and 5hmC (F). Green, indicates 5mC. Red, indicates 5hmC. Blue, indicates Hoechst. Statistical analyses of 5mC and 5hmC fluoressence intensity (G). The bar represents 50 μm. * (p< 0.05) and ** (p < 0.01) indicate statistically significant differences.
Figure 4
Figure 4
Analysis of cell apoptosis and cell cycle after knockdown and overexpression of TET1. The cell apoptosis was analyzed in Nc, FH-TET1-pEF, and si-TET1 groups (A). Statistical analysis of the percentage of cell apoptosis (B). The cell cycle was analyzed in Nc, FH-TET1-pEF, and si-TET1 groups (C). Statistical analysis of the percentage of cell apoptosis (D). The data represents the mean ± SD of three independent experiments. ** (p < 0.01) indicate statistically significant differences.
Figure 5
Figure 5
Analysis of cell migration and invasion in GC cells with after knockdown and overexpression of TET1. The cell migration was analyzed in Nc, FH-TET1-pEF and si-TET1 groups (A). Statistical analysis of cell migration with wound closure assay (B). The cell invasion was analyzed in Nc, FH-TET1-pEFs and si-TET1 groups (C). Statistical analysis of the percentage of cell invasion (D). The data represents the mean ± SD of three independent experiments.* (p< 0.05), ** (p < 0.01) and *** (p < 0.005) indicate statistically significant differences.
Figure 6
Figure 6
Analysis of the tumor volume and TET1 expression in vivo. Morphological alterations in mouse tumor tissue after treatment with chrysin (20 mg/kg) (A). Analysis of tumor volume (B). Relative expression of TET1 using qRT-PCR in the tumor of mice (C). The expression of TET1 by Western blot assay (D). * (p < 0.05) and ** (p < 0.01) indicate statistically significant differences.
Figure 7
Figure 7
CRISPR/Cas9-mediated gene targeting of TET1. Schematic representation of sgRNA targeting the TET1 gene loci (A). The expression of TET1 using qRT-PCR (B) and Western blot (C). The tumor morphology (D) and volume (E). E indicated Exon. ** (p < 0.01), *** (p < 0.005) and **** (p < 0.001) indicate statistically significant differences.

Similar articles

Cited by

References

    1. Bray F, Ferlay J, Soerjomataram I, Siegel RL, Torre LA, Jemal A. Global cancer statistics 2018: GLOBOCAN estimates of incidence and mortality worldwide for 36 cancers in 185 countries. CA Cancer J Clin. 2018;68(6):394–424. doi:10.3322/caac.21492 - DOI - PubMed
    1. Zhang C, Zou Y, Dai DQ. Downregulation of microRNA-27b-3p via aberrant DNA methylation contributes to malignant behavior of gastric cancer cells by targeting GSPT1. Biomed Pharmacother. 2019;119:109417. doi:10.1016/j.biopha.2019.109417 - DOI - PubMed
    1. He YF, Li BZ, Li Z, et al. Tet-mediated formation of 5-carboxylcytosine and its excision by TDG in mammalian DNA. Science. 2011;333(6047):1303–1307. doi:10.1126/science.1210944 - DOI - PMC - PubMed
    1. Yatagai N, Saito T, Akazawa Y, et al. TP53 inactivation and expression of methylation-associated proteins in gastric adenocarcinoma with enteroblastic differentiation. Virchows Arch Int J Pathol. 2019;474(3):315–324. doi:10.1007/s00428-018-2508-9 - DOI - PubMed
    1. He Z, Wang X, Huang C, et al. The FENDRR/miR-214-3P/TET2 axis affects cell malignant activity via RASSF1A methylation in gastric cancer. Am J Transl Res. 2018;10(10):3211–3223. - PMC - PubMed