. 2020 Apr 29:20:140.
doi: 10.1186/s12935-020-01216-9. eCollection 2020.

Integrated nomogram based on five stage-related genes and TNM stage to predict 1-year recurrence in hepatocellular carcinoma

Affiliations

Integrated nomogram based on five stage-related genes and TNM stage to predict 1-year recurrence in hepatocellular carcinoma

Haohan Liu et al. Cancer Cell Int. .

Abstract

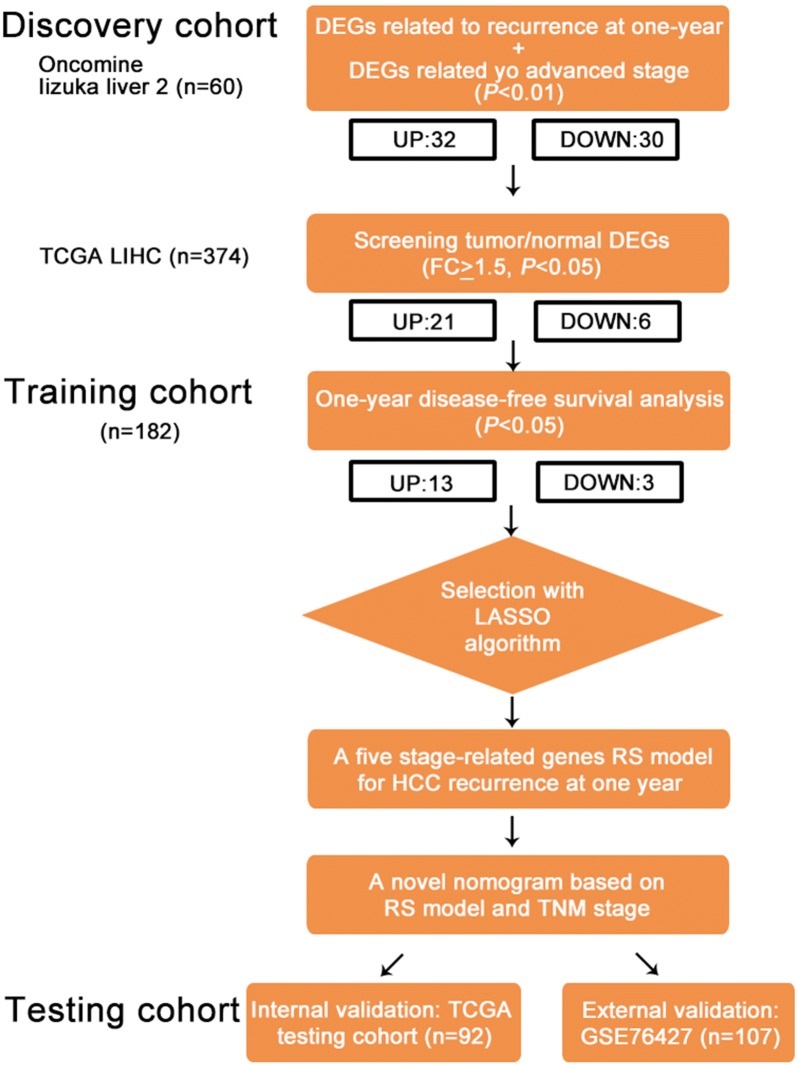
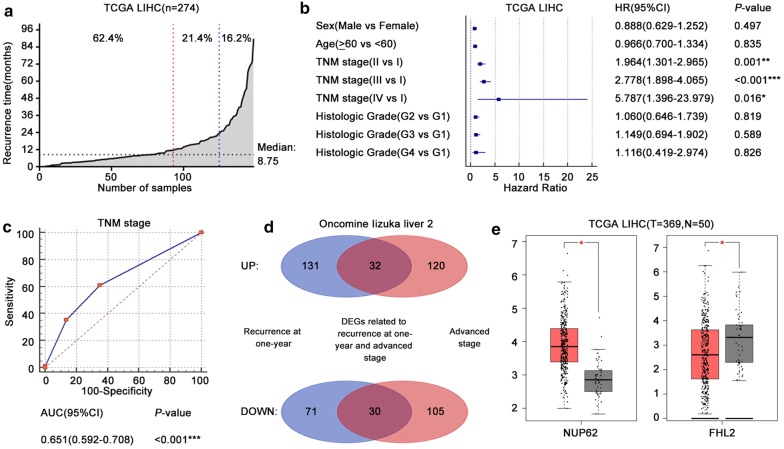
Background: The primary tumor, regional lymph nodes and distant metastasis (TNM) stage is an independent risk factor for 1-year hepatocellular carcinoma (HCC) recurrence but has insufficient predictive efficiency. We attempt to develop and validate a nomogram to predict 1-year recurrence in HCC and improve the predictive efficiency of the TNM stage.

Methods: A total of 541 HCC patients were enrolled in the study. The risk score (RS) model was established with the logistic least absolute shrinkage and selector operation algorithm. The predictive nomogram was further validated in the internal testing cohort and external validation cohort. The area under the receiver operating characteristic curves (AUCs), decision curves and clinical impact curves were used to evaluate the predictive accuracy and clinical value of the nomogram.

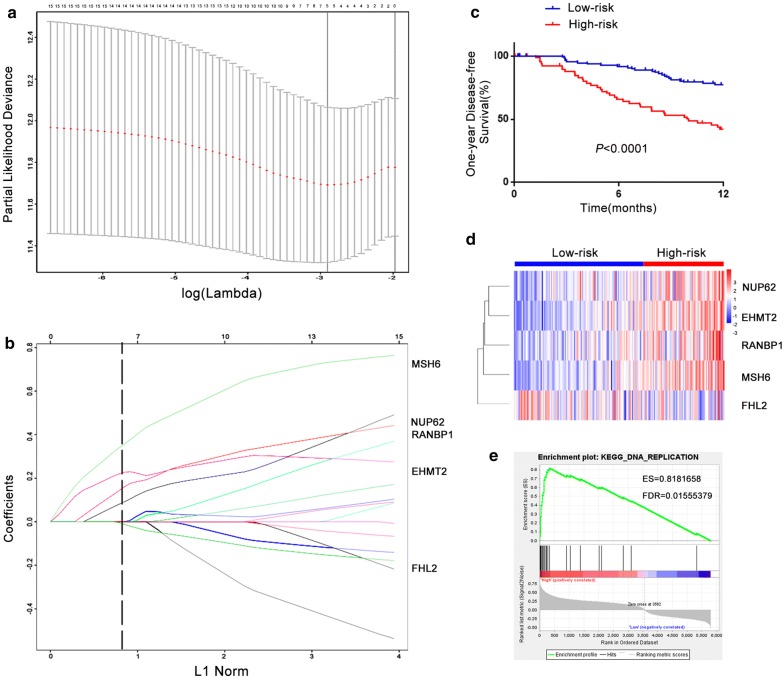
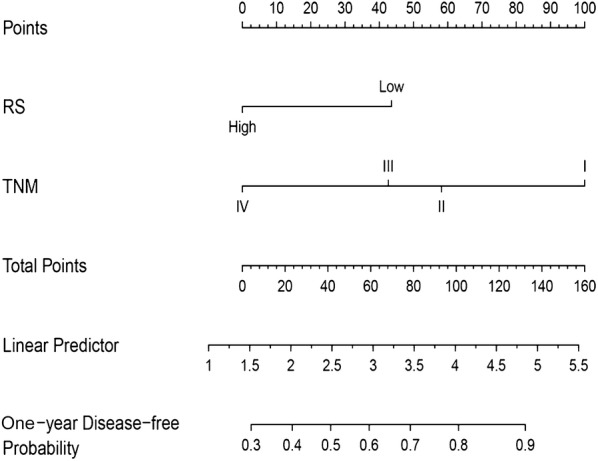
Results: In the training cohort, we identified a RS model consisting of five stage-related genes (NUP62, EHMT2, RANBP1, MSH6 and FHL2) for recurrence at 1 year. The 1-year disease-free survival of patients was worse in the high-risk group than in the low-risk group (P < 0.0001), and 1-year recurrence was more likely in the high-risk group (Hazard ratio: 3.199, P < 0.001). The AUC of the nomogram was 0.739, 0.718 and 0.693 in the training, testing and external validation cohort, respectively, and these values were larger than the corresponding AUC of the TNM stage (0.681, 0.688 and 0.616, respectively).

Conclusions: A RS model consisting of five stage-related genes was successfully identified for predicting 1-year HCC recurrence. Then, a novel nomogram based on the RS model and TNM stage to predict 1-year HCC recurrence was also developed and validated.

Keywords: 1-year recurrence; Hepatocellular carcinoma; Nomogram; Risk score model; TNM stage.


Conflict of interest statement

Competing interestsThe authors declare that they have no competing interests.

Figures

Fig. 1
Fig. 1
Study flowchart. The design and procedure of our study were shown. Stage-related genes are screened from discovery cohort (n = 434). Novel RS model and nomogram are constructed with TCGA training cohort (n = 182). Testing cohort consists of internal validation cohort (n = 92) and external validation cohort (n = 107)
Fig. 2
Fig. 2
Independent risk factors for 1-year recurrence and stage-related gene identification in the discovery cohort. a The red line vertical to the X axis highlights the 1-year cutoff for samples showing recurrence, and the blue line highlights the 2-year cutoff. The black line vertical to the Y axis indicates the median recurrence time. b HRs and 95% CIs for risk factors are respectively represented by blue blocks and lines. c The ROC curve of the TNM stage for predicting 1-year recurrence was plotted, and the AUC was calculated. d Blue circles represent DEGs associated with recurrence at 1 year, and red circles represent DEGs associated with advanced stages. Purple areas indicate overlapping DEGs, and the counts of DEGs are shown. e Representative box plots of tumor/normal DEGs are shown. Red boxes: tumors, gray boxes: normal tissues, black dots: samples, black bars: means and standard deviations. *P < 0.05, **P < 0.01, ***P < 0.001
Fig. 3
Fig. 3
Construction of the prognostic RS model in the training cohort. a Selection of the tuning parameter (lambda) in the LASSO model by tenfold cross-validation based on minimum criteria for 1-year recurrence; the lower X axis shows the log (lambda), and the upper X axis shows the average number of stage-related genes. The Y axis indicates the partial likelihood deviance error. The red dots represent the average partial likelihood deviances for every model with a given lambda, and the vertical bars indicate the upper and lower values of the partial likelihood deviance error. The vertical gray lines define the optimal values of lambda, which provide the best fit. b LASSO coefficient profiles of 16 stage-related genes. The vertical black dotted lines are plotted at the value selected. c Kaplan–Meier analysis of 1-year DFS between the high-risk group (red) and the low-risk group (blue). d Heat map of five stage-related genes in the prognostic signature. e Representative GSEA plot (DNA replication KEGG pathway) of the high-risk group versus the low-risk group. ES and FDR were also shown
Fig. 4
Fig. 4
Nomogram based on the TNM stage and RS model for predicting 1-year recurrence in the training cohort. All points assigned on the top point scale for each factor are summed together to generate a total point score. The total point score is projected on the bottom scale to determine the 1-year DFS probability for an individual
Fig. 5
Fig. 5
ROC curve analysis, DCA and clinical impact curve analysis in the training cohort, the testing cohort and the external validation cohort. a–c Comparisons of the predictive value of the nomogram (orange), TNM stage (blue) and RS (green) for 1-year recurrence according to ROC analysis. ROC curves in the training cohort (a), the testing cohort (b) and the external validation cohort (c). The AUC and 95% CI were calculated. df DCA of the nomogram (red) and TNM stage (blue) for predicting 1-year recurrence in the training cohort (d), the testing cohort (e) and the external validation cohort (f). The X axis shows the high-risk threshold, and the Y axis represents the standardized net benefit. g–i Clinical impact curves of the nomogram for predicting 1-year recurrence in the training cohort (g), the testing cohort (h) and the external validation cohort (i). The number of high-risk patients (black dotted line) and the number of high-risk patients with events (red solid line) are plotted

References

    1. Bray F, Ferlay J, Soerjomataram I, Siegel RL, Torre LA, Jemal A. Global cancer statistics 2018: gLOBOCAN estimates of incidence and mortality worldwide for 36 cancers in 185 countries. CA Cancer J Clin. 2018;68(6):394–424. - PubMed
    1. Forner A, Reig M, Bruix J. Hepatocellular carcinoma. Lancet. 2018;391(10127):1301–1314. - PubMed
    1. Tabrizian P, Jibara G, Shrager B, Schwartz M, Roayaie S. Recurrence of hepatocellular cancer after resection. Ann Surg. 2015;261(5):947–955. - PubMed
    1. Bruix J, Gores GJ, Mazzaferro V. Hepatocellular carcinoma: clinical frontiers and perspectives. Gut. 2014;63(5):844–855. - PMC - PubMed
    1. Poon RT. Differentiating early and late recurrences after resection of HCC in cirrhotic patients: implications on surveillance, prevention, and treatment strategies. Ann Surg Oncol. 2009;16(4):792–794. - PubMed

LinkOut - more resources