RNA m6 A methylation regulates sorafenib resistance in liver cancer through FOXO3-mediated autophagy
- PMID: 32368828
- PMCID: PMC7298296
- DOI: 10.15252/embj.2019103181
RNA m6 A methylation regulates sorafenib resistance in liver cancer through FOXO3-mediated autophagy
Abstract
N6-methyladenosine (m6 A) is an abundant nucleotide modification in mRNA, known to regulate mRNA stability, splicing, and translation, but it is unclear whether it is also has a physiological role in the intratumoral microenvironment and cancer drug resistance. Here, we find that METTL3, a primary m6 A methyltransferase, is significantly down-regulated in human sorafenib-resistant hepatocellular carcinoma (HCC). Depletion of METTL3 under hypoxia promotes sorafenib resistance and expression of angiogenesis genes in cultured HCC cells and activates autophagy-associated pathways. Mechanistically, we have identified FOXO3 as a key downstream target of METTL3, with m6 A modification of the FOXO3 mRNA 3'-untranslated region increasing its stability through a YTHDF1-dependent mechanism. Analysis of clinical samples furthermore showed that METTL3 and FOXO3 levels are tightly correlated in HCC patients. In mouse xenograft models, METTL3 depletion significantly enhances sorafenib resistance of HCC by abolishing the identified METTL3-mediated FOXO3 mRNA stabilization, and overexpression of FOXO3 restores m6 A-dependent sorafenib sensitivity. Collectively, our work reveals a critical function for METTL3-mediated m6 A modification in the hypoxic tumor microenvironment and identifies FOXO3 as an important target of m6 A modification in the resistance of HCC to sorafenib therapy.
Keywords: FOXO3; METTL3; N6-methyladenosine; autophagy; hypoxia.
© 2020 The Authors. Published under the terms of the CC BY 4.0 license.
Conflict of interest statement
The authors declare that they have no conflict of interest.
Figures
- A
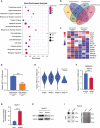
Gene enrichment analysis on differentially expressed genes between sorafenib‐sensitive and sorafenib‐resistant human liver tumors.
- B
Venn diagrams show overlapped genes in signaling pathways response to sorafenib.
- C
Heatmap of overlapped expressed genes in response to sorafenib resistance.
- D
The mRNA expression level of METTL3 in sorafenib‐sensitive (n = 3) and sorafenib‐resistant (n = 3) human liver tumors.
- E
Expression of METTL3 was significantly down‐regulated in advanced stage of liver cancer from TCGA.
- F
METTL3 RNA levels between naïve HepG‐2 cells (n = 3) and sorafenib‐resistant HepG‐2 cells (n = 10).
- G
The IC50 of sorafenib‐resistant HepG‐2 cells treated with sorafenib under hypoxic condition (1% O2).
- H
The protein level of METTL3 in sorafenib‐resistant HepG‐2 cells treated with sorafenib under hypoxic condition (1% O2).
- I
The global RNA m6A level in naïve HepG‐2 and sorafenib‐resistant HepG‐2 determined by dot blotting assay under hypoxic condition (1% O2).

- A, B
Clonogenic survival of METTL3 knockdown (A) and METTL3 overexpression (B) in normal liver cell line WRL68 cells for 7 days in normoxic condition (21% O2) and quantification of clusters in A‐1 and B‐1, respectively.
- C, D
The IC50 of METTL3‐knockdown SMMC‐7721 cells (C) and Bel‐7402 cells (D) after treated with sorafenib for 24 h under hypoxic condition (1% O2).
- E
Overexpression of wild‐type METTL3 or catalytic mutant METTL3 in sorafenib‐resistant HepG‐2 cells.
- F
The global RNA m6A level in sorafenib‐resistant HepG‐2 cells with wild‐type METTL3 overexpression or catalytic mutant METTL3 overexpression by dot blotting assay.
- G–I
Rescue of shRNA‐resistant wild‐type METTL3 but not catalytic mutant METTL3 sensitized METTL3‐knockdown SMMC‐7721 cells (G), Bel‐7402 cells (H), and sorafenib‐resistant HepG‐2 cells (I) to sorafenib treatment. The IC50 of the cells was measured after treated with sorafenib for 24 h under hypoxic condition (1% O2).
- J
Cell survival assay of sorafenib‐resistant HepG‐2 cells with wild‐type METTL3 overexpression or catalytic mutant METTL3 overexpression after treated with sorafenib for 24 h under hypoxic condition (1% O2). Scale bar, 1 mm.
- K
Capillary‐like structures in HUVECs treated with the tumor‐conditioned medium (TCM) from control HCCs and METTL3‐knockdown HCCs cultured under hypoxic conditions for 48 h. Quantification of the number of tubes with ImageJ in K‐1.
- L, M
The relative mRNA expression levels of angiogenesis genes were detected in SMMC‐7721 cells (L) and Bel‐7402 cells (M) with METTL3 knockdown by RT–PCR assay.
- N
The protein levels of VEGF‐A in METTL3‐knockdown HCCs.
- O
The protein levels of PDGF‐B in METTL3‐knockdown HCCs.
- A
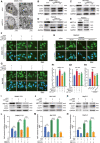
Electron micrographs of METTL3‐knockdown SMMC‐7721 cells under hypoxia for 48 h.
- B–D
Protein levels of LC3 I/II in METTL3‐knockdown SMMC‐7721 (B), Bel‐7402 (C), and HepG‐2 (D) cells under hypoxic condition for 48 h.
- E
Protein level of LC3 I/II in HepG‐2 and sorafenib‐resistant HepG‐2 cells under hypoxic condition for 48 h.
- F–H
Overexpression of shRNA‐resistant wild‐type METTL3 but not catalytic mutant METTL3 rescue autophagy phenotype in METTL3‐knockdown SMMC‐7721 cells (F), Bel‐7402 cells (G), and sorafenib‐resistant HepG2 cells (H) by representative immunostaining images of LC3 under hypoxic condition for 48 h. Scale bar, 200 μm. Quantification of the numbers of GFP‐LC3 puncta/cell by Imaris in F‐1, G‐1, and H‐1, respectively.
- I–K
Protein levels of LC3 I/II in METTL3‐knockdown SMMC‐7721 cells (I), Bel‐7402 cells (J), and HepG‐2 cells (K) treated with or without 3‐MA under hypoxic condition for 24 h.
- L–N
The IC50 of sorafenib in SMMC‐7721 cells (L), Bel‐7402 cells (M), and HepG‐2 cells (N) treated with or without 3‐MA for 24 h under hypoxic condition (1% O2).
- A
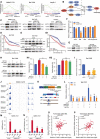
Gene set enrichment analysis (GSEA) output images of cellular response to stress pathways displaying a correlation of differentially regulated genes in METTL3‐knockdown HepG2, SMMC‐7721, and Bel‐7402 cells with the C5, biological process symbol set (P < 0.001).
- B
The KEGG analysis shows that FOXO3 involved in hypoxia and autophagy.
- C
Protein level of FOXO3 in METTL3‐knockdown HCCs under hypoxia for 48 h.
- D
Half‐life of FOXO3 mRNA in Bel‐7402 cells and correspondent METTL3‐knockdown Bel‐7402 cells treated with actinomycin D.
- E
Half‐life of FOXO3 protein in Bel‐7402 cells and correspondent METTL3‐knockdown Bel‐7402 cells treated with cycloheximide. Quantification of the protein optical density by ImageJ in E‐1.
- F
Analysis of FOXO3 mRNA in non‐ribosome portion (<40S), 40S, 60S, 80S, and polysome for the METTL3‐knockdown Bel‐7402 cells compared to control cells under hypoxia for 48 h.
- G
Knockdown of YTHDF1 and YTHDF2 in Bel‐7402 cells by lentiviral shRNAs.
- H
Knockdown of YTHDF1 but not YTHDF2 abolished the increase of FOXO3 protein level in METTL3‐overexpressing Bel‐7402 cells. Quantification of the protein optical density by ImageJ in H‐1 and H‐2.
- I
RNA level of FOXO3 in YTHDF1‐knockdown Bel‐7402 cells by RT–PCR.
- J
The m6A‐IP sequencing under hypoxia proved the m6A modification participated in regulation of FOXO3. The YTHDF1 binding site locates at the 3′UTR of FOXO3.
- K
800 bp of FOXO3 3′UTR containing the m6A modification site was cloned into luciferase reporter vector. Mutation of m6A consensus sequence was generated by replacing adenosine with thymine.
- L
Relative luciferase activity of the wild‐type and mutant form of FOXO3 3′UTR reporter vectors in Bel‐7402 cells with various levels of METTL3 and YTHDF1.
- M
Knockdown of METTL3 reduced the m6A methylation in FOXO3 mRNA by the m6A MeRIP analysis.
- N
Knockdown of METTL3 reduced the m6A methylation in FOXO3 mRNA by the YTHDF1‐RIP analysis.
- O
Correlation analysis of the RNA expression levels of METTL3 and FOXO3 in liver tumor cohort (Kim‐90) by Pearson.
- P
Correlation analysis of the RNA expression levels of YTHDF1 and FOXO3 in liver tumor cohort (Kim‐90) by Pearson.

- A
Validation of biomarker genes related to autophagy in FOXO3‐knockdown Bel‐7402 cells by RT–PCR.
- B
Protein level of FOXO3 in naïve HepG‐2 and sorafenib‐resistant HepG‐2 cells under hypoxia for 48 h.
- C
Protein levels of LC3 I/II in FOXO3‐knockdown SMMC‐7721 cells.
- D
Overexpression of FOXO3 in sorafenib‐resistant HepG‐2 cells by Western blot.
- E
Protein levels of LC3 I/II in METTL3‐knockdown and FOXO3‐overexpression SMMC‐7721 cells under hypoxia for 48 h.
- F
Electron micrographs of METTL3‐knockdown SMMC7721 cells and METTL3‐knockdown and FOXO3‐overexpression SMMC7721 cells under hypoxia for 48 h.
- G
Representative immunostaining images of LC3 in METTL3‐knockdown SMMC7721 cells and METTL3‐knockdown and FOXO3‐overexpression SMMC7721 cells under hypoxia for 48 h. Scale bar, 200 μm. The quantification of the numbers of GFP‐LC3 puncta/cell by Imaris in G‐1.
- H
Representative immunostaining images of LC3 in naïve HepG‐2 cells and sorafenib‐resistant HepG‐2 cells under hypoxia for 48 h. Scale bar, 200 μm. The quantification of the numbers of GFP‐LC3 puncta/cell by Imaris in H‐1.
- I
The IC50 of METTL3‐knockdown SMMC7721 cells with overexpressing FOXO3 after treated with sorafenib for 24 h under hypoxic condition.
- J
The IC50 of naïve HepG‐2 cells and sorafenib‐resistant HepG‐2 cells with overexpressing FOXO3 after treated with sorafenib for 24 h under hypoxic condition.
- K
Cell survival assay of METTL3‐knockdown SMMC7721 cells with overexpressing FOXO3 after treated with sorafenib for 24 h under hypoxic condition.
- L
Cell survival assay of naïve HepG‐2 cells and sorafenib‐resistant HepG‐2 cells with overexpressing FOXO3 after treated with sorafenib for 24 h under hypoxic condition.
- A
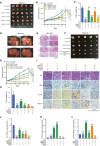
Depletion of METTL3 in Hepa1‐6 cells by CRISPR‐Cas9 knockout enhanced sorafenib resistance in vivo.
- B, C
Growth curve (B) and tumor weight (C) of Hepa1‐6 cell‐derived xenografts in the subcutaneous implantation mouse model in six treatment groups for 12 days (n = 5).
- D
Knockdown of METTL3 slightly increased liver tumor growth treated with sorafenib in orthotopic xenograft mouse model. Stable METTL3‐knockdown Bel‐7402 cells and control cells were injected into the liver of each NOD/SCID mouse. Three weeks after injection, livers were separated for pathological analysis. Red circle indicates tumors in the livers.
- E
Liver tumors in orthotopic xenograft mouse model were confirmed by hematoxylin and eosin staining.
- F
Overexpression of FOXO3 rescued sorafenib resistance mediated by METTL3 knockdown in xenograft liver tumors. Representative xenograft tumors at endpoint, containing 6 groups.
- G, H
Growth curve (G) and tumor weight (H) of Hepa1‐6 cell‐derived xenografts in the subcutaneous implantation mouse model in 6 treatment groups for 10 days (n = 5).
- I
H&E and immunohistochemical images of Ki67, LC3‐B, and VEGF‐A in Hepa1‐6 cell‐derived xenografts in 6 treatment groups.
- J–L
Quantification of Ki67 (K), LC3‐B (K), and VEGF‐A (L) expression in immunohistochemical images by Image Pro Plus (IPP) analysis.
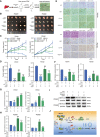
- A
Graphic illustration of two human liver cancer PDXs mouse model based sorafenib (SOR) treatment regimen.
- B–D
In vivo analyses of tumor (B), growth (C), and weight (D) in mice that were subcutaneously implanted with tumor tissues from two human liver cancer patients and divided into four groups.
- E
H&E and immunohistochemical images of Ki67, LC3‐B, and VEGF‐A in randomly selected PDX#1 and PDX#2 tumors.
- F–H
Quantification of Ki67 (F), LC3‐B (G), and VEGF‐A (H) expression in immunohistochemical images from PDX tumors by Image Pro Plus (IPP) analysis.
- I
Knockdown of METTL3 by siRNA in PDX#1 and PDX#2 tissues was confirmed by Western blot.
- J
Working model. The molecular mechanisms of m6A‐dependent sorafenib resistance in liver cancer. The expression of METTL3 was down‐regulated in sorafenib‐resistant liver cancer and caused decrease of FOXO3 by the m6A modification in an YTHDF1‐dependent manner. Degradation of FOXO3 thus promoted autophagy‐associated sorafenib resistance in liver cancer.
References
-
- Chen M, Wei L, Law CT, Tsang FH, Shen J, Cheng CL, Tsang LH, Ho DW, Chiu DK, Lee JM et al (2018) RNA N6‐methyladenosine methyltransferase‐like 3 promotes liver cancer progression through YTHDF2‐dependent posttranscriptional silencing of SOCS2. Hepatology 67: 2254–2270 - PubMed
-
- Cheng AL, Kang YK, Chen Z, Tsao CJ, Qin S, Kim JS, Luo R, Feng J, Ye S, Yang TS et al (2009) Efficacy and safety of sorafenib in patients in the Asia‐Pacific region with advanced hepatocellular carcinoma: a phase III randomised, double‐blind, placebo‐controlled trial. Lancet Oncol 10: 25–34 - PubMed
Publication types
MeSH terms
Substances
Associated data
- Actions
Grants and funding
- 2019A050510019/Guangdong Basic and Applied Basic Research Foundation
- 2019B030301005/Guangdong Basic and Applied Basic Research Foundation
- 2019B151502063/Guangdong Basic and Applied Basic Research Foundation
- 2017B090903004/National Engineering Research Center for New Drug and Druggability Evaluation, Seed Program of Guangdong Province
- 31701114/National Natural Science Foundation of China
LinkOut - more resources
Full Text Sources
Medical
Molecular Biology Databases
Research Materials

