Clinical Trial
. 2020 Jul 6;217(7):e20191369.
doi: 10.1084/jem.20191369.

Impact of checkpoint blockade on cancer vaccine-activated CD8+ T cell responses

Affiliations
Clinical Trial

Impact of checkpoint blockade on cancer vaccine-activated CD8+ T cell responses

Patricia M Santos et al. J Exp Med. .

Abstract

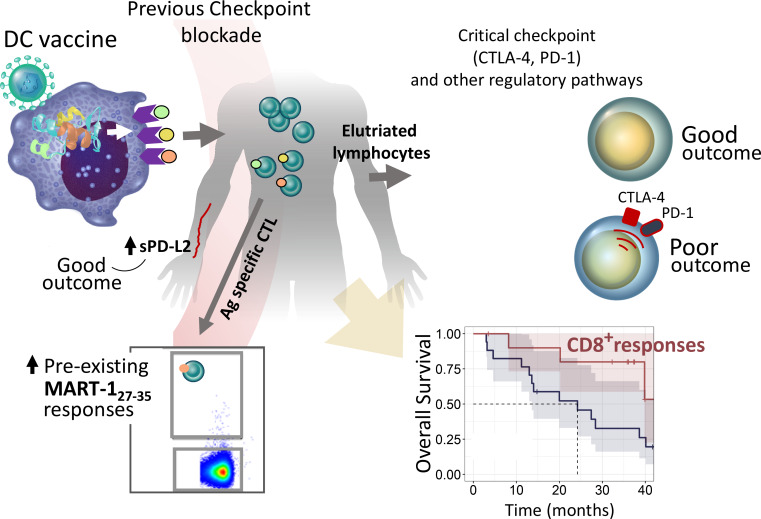
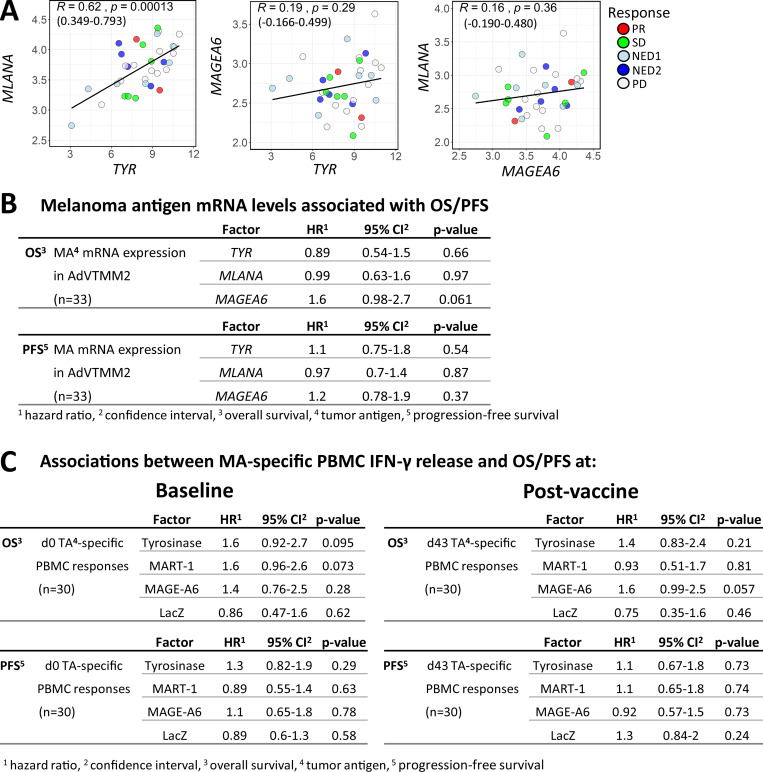
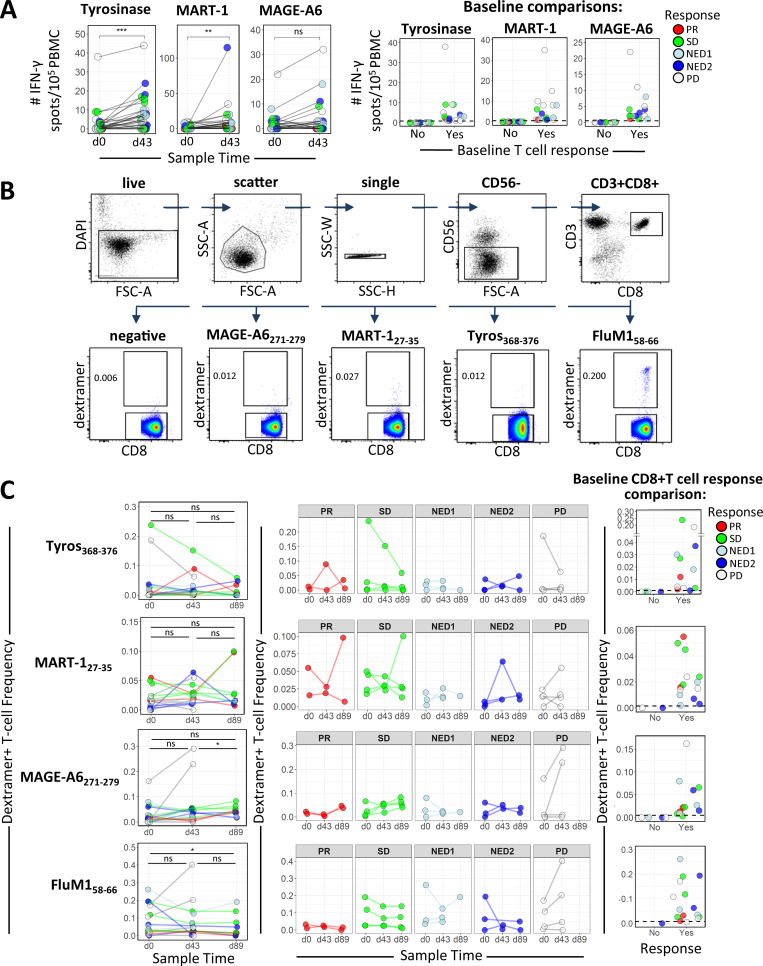
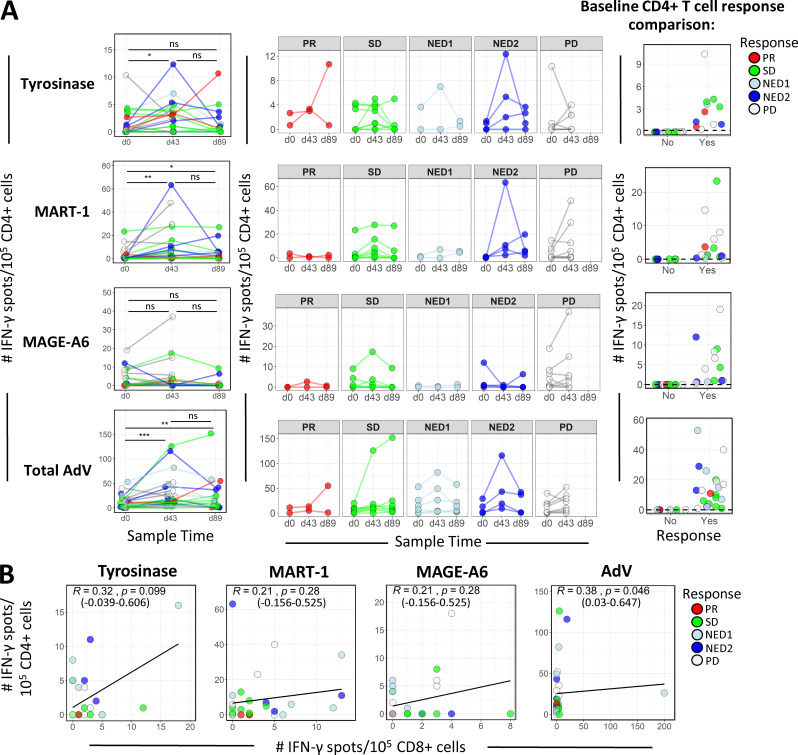
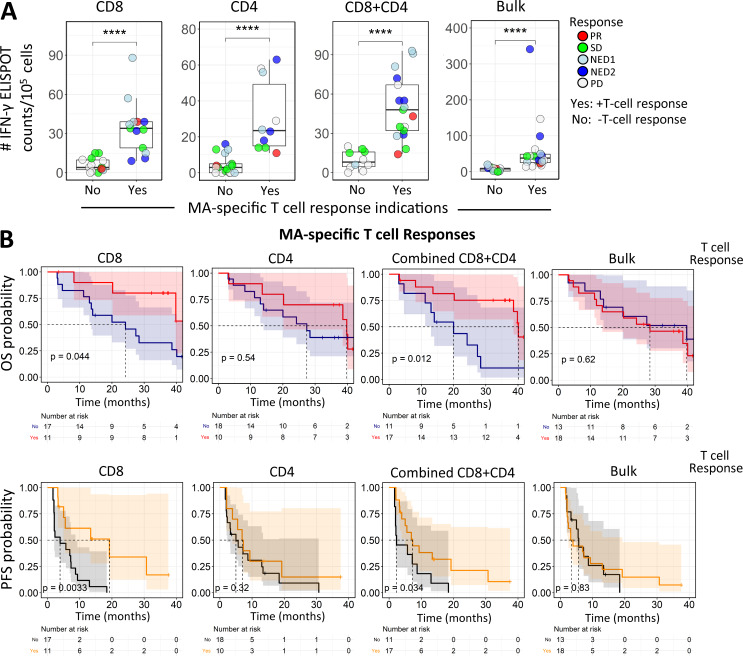
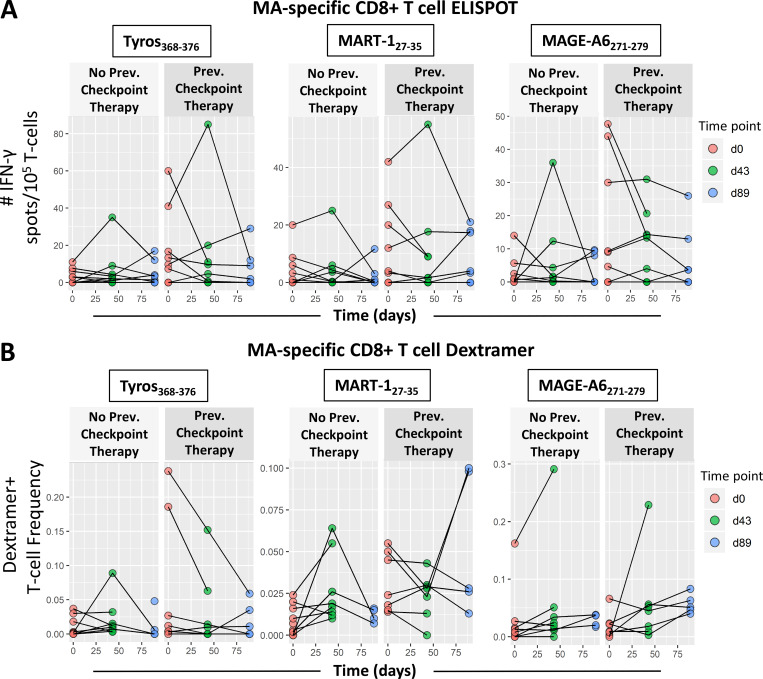
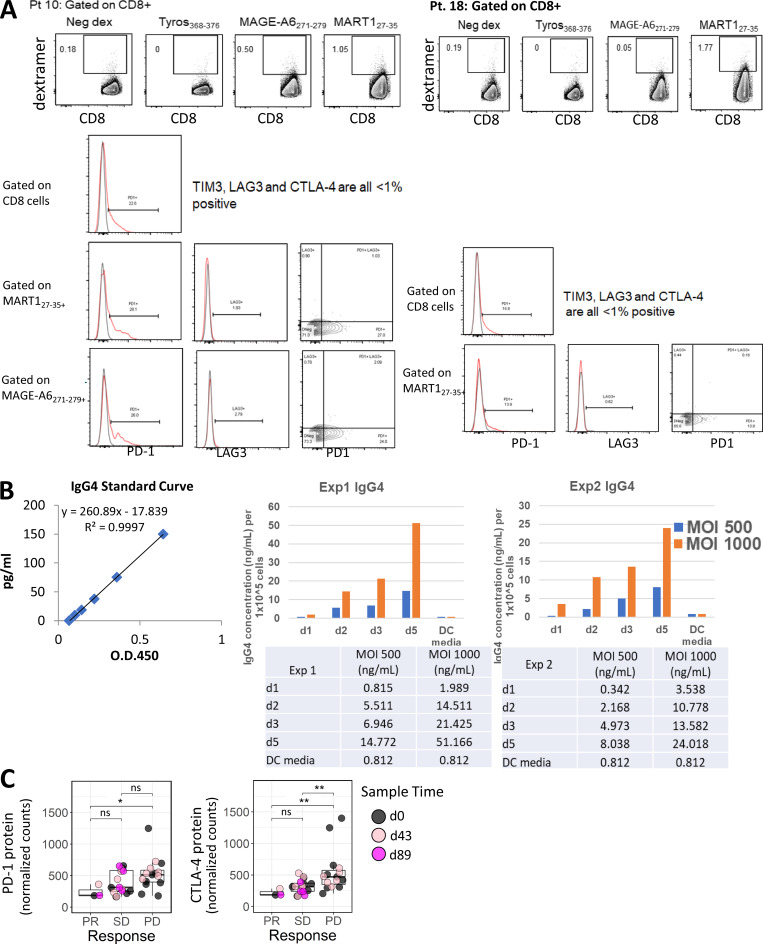
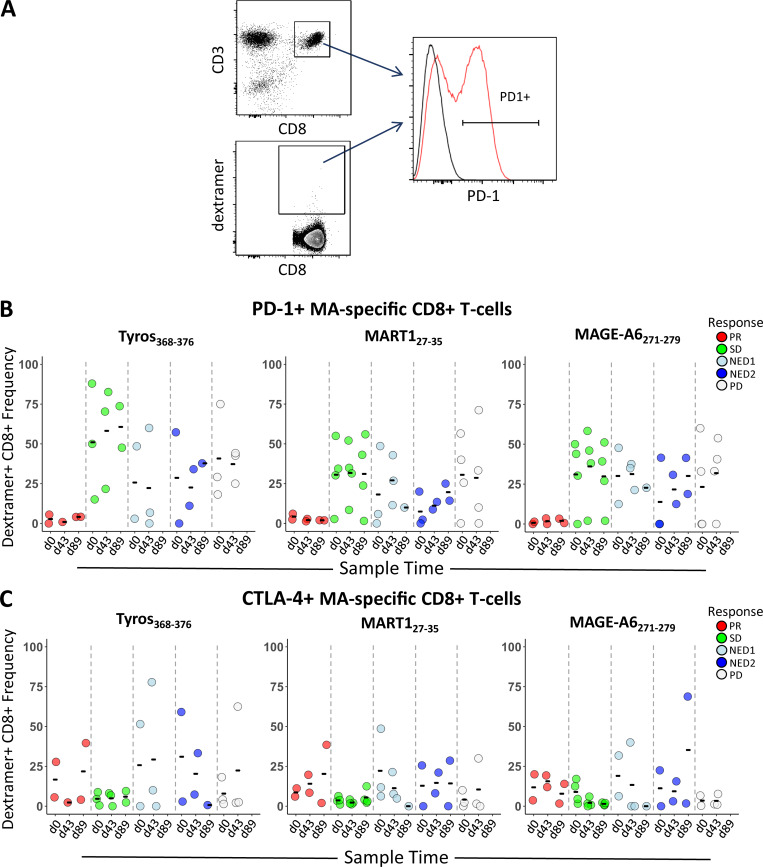
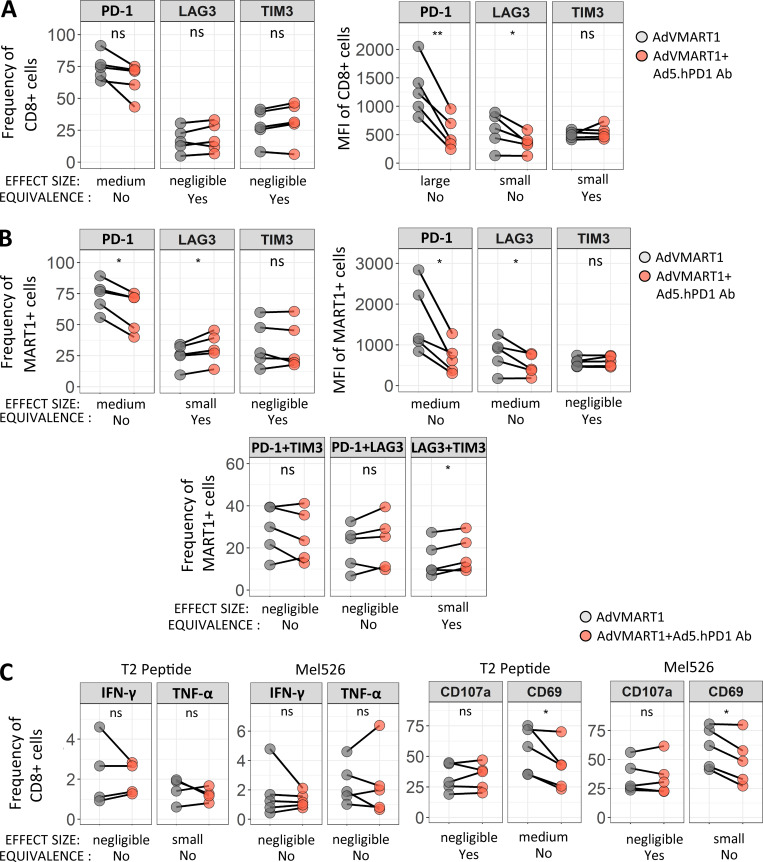
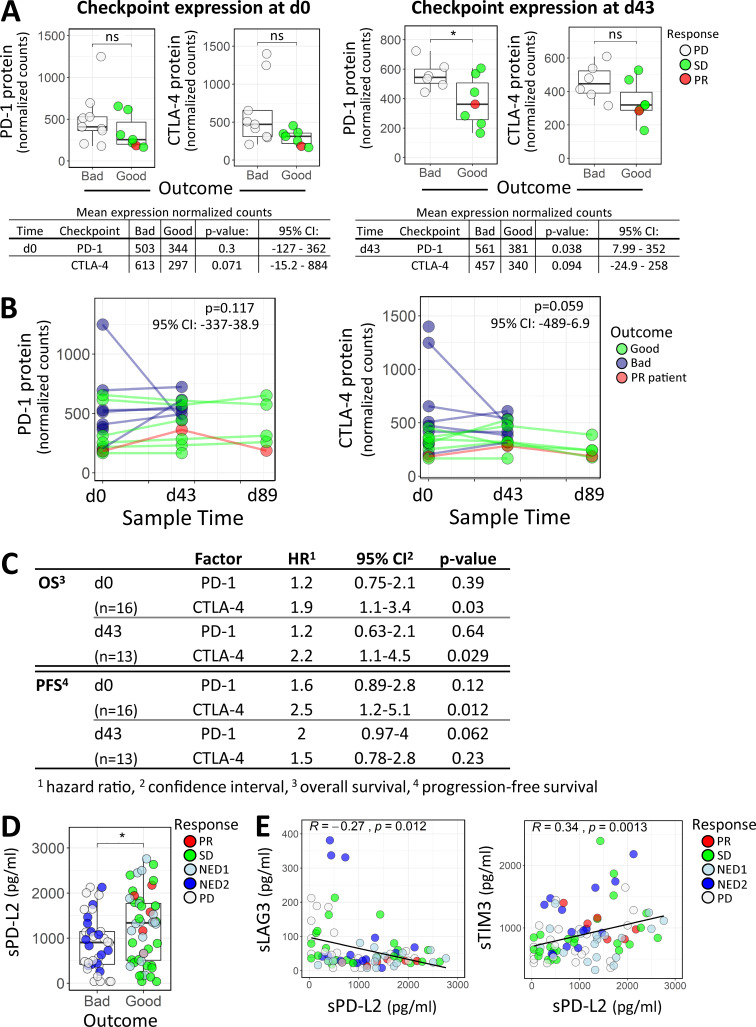
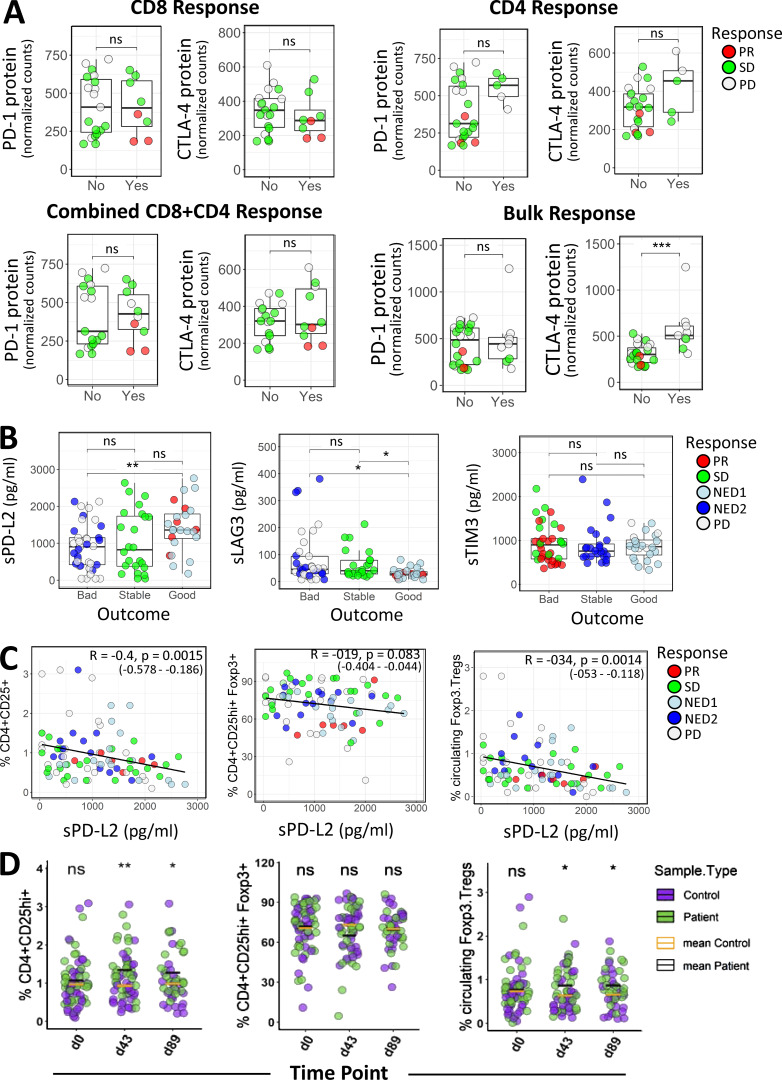
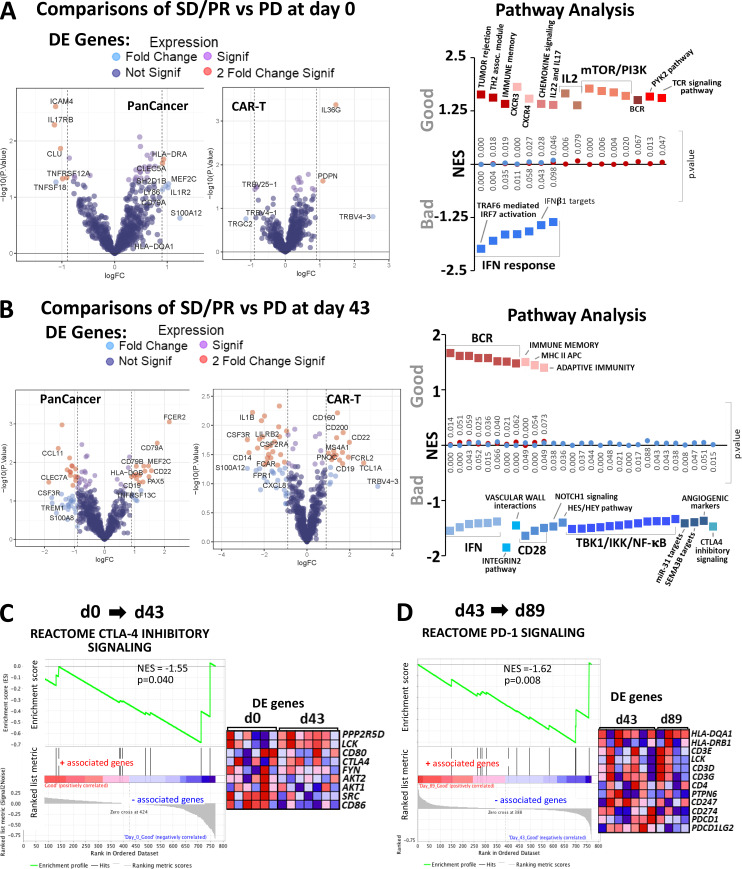
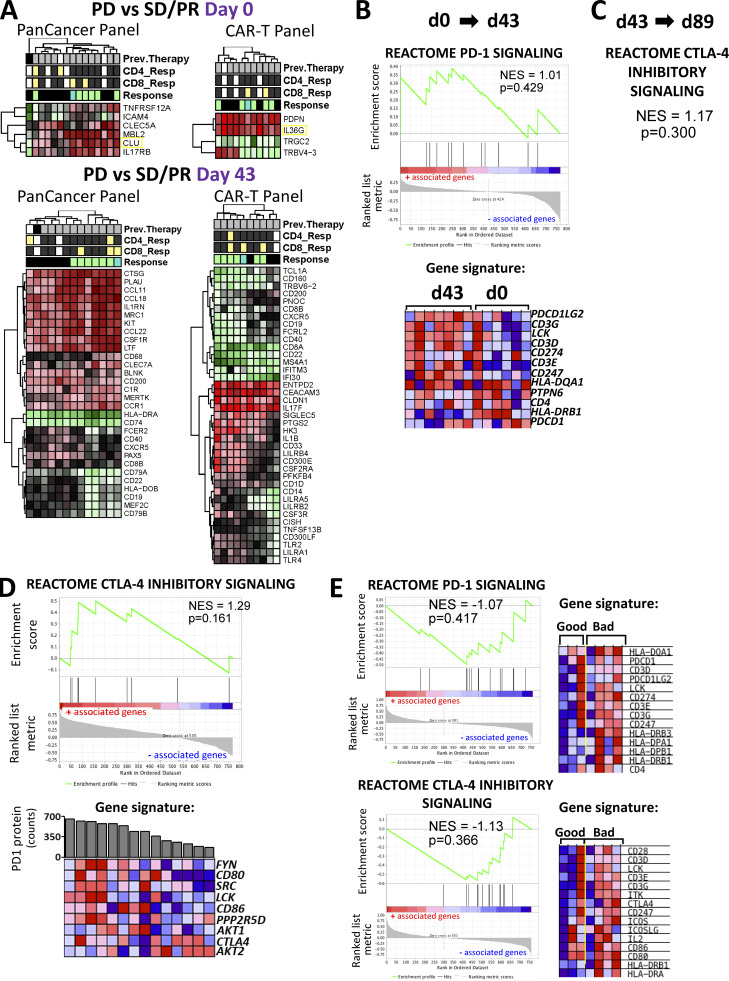
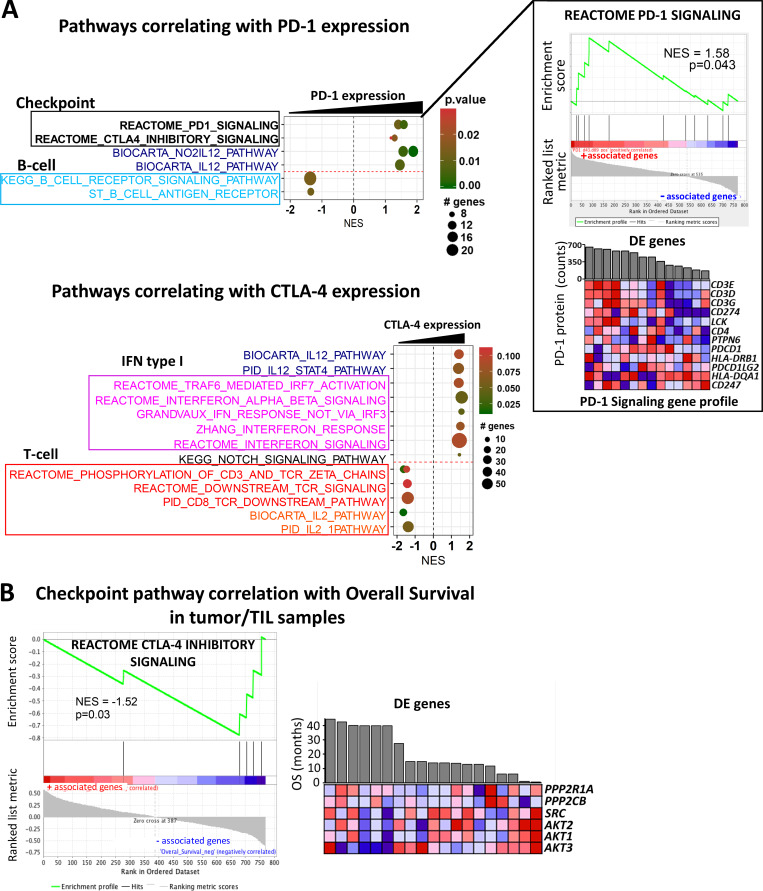
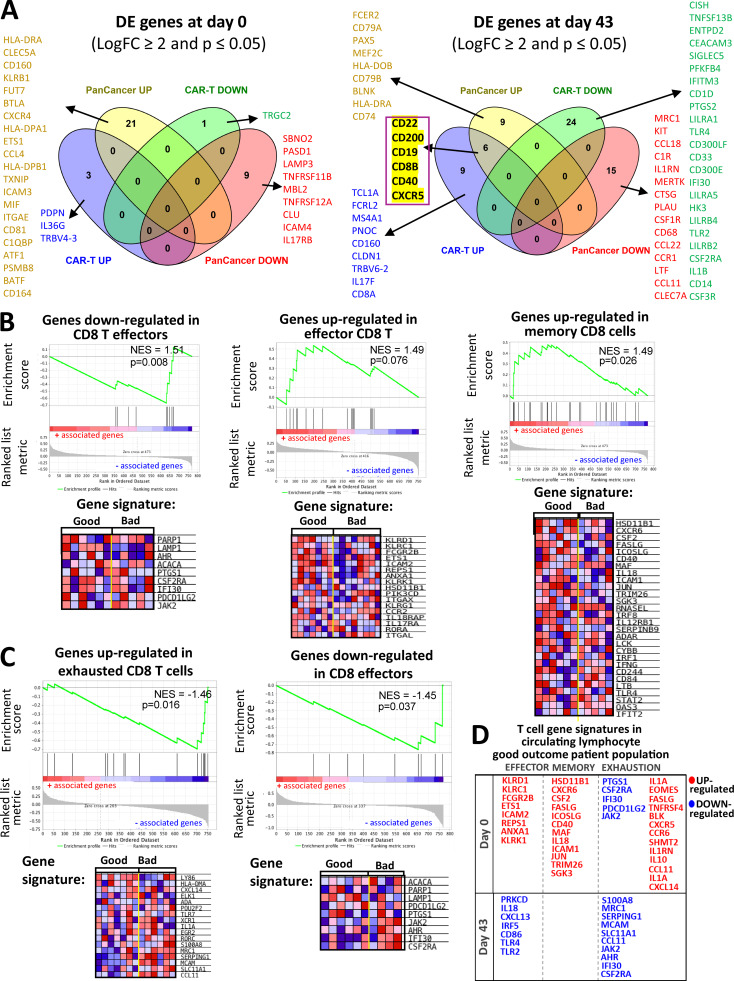
Immune and molecular profiling of CD8 T cells of patients receiving DC vaccines expressing three full-length melanoma antigens (MAs) was performed. Antigen expression levels in DCs had no significant impact on T cell or clinical responses. Patients who received checkpoint blockade before DC vaccination had higher baseline MA-specific CD8 T cell responses but no evidence for improved functional responses to the vaccine. Patients who showed the best clinical responses had low PD-1 expression on MA-specific T cells before and after DC vaccination; however, blockade of PD-1 during antigen presentation by DC had minimal functional impact on PD-1high MA-specific T cells. Gene and protein expression analyses in lymphocytes and tumor samples identified critical immunoregulatory pathways, including CTLA-4 and PD-1. High immune checkpoint gene expression networks correlated with inferior clinical outcomes. Soluble serum PD-L2 showed suggestive positive association with improved outcome. These findings show that checkpoint molecular pathways are critical for vaccine outcomes and suggest specific sequencing of vaccine combinations.


Conflict of interest statement

Disclosures: Dr. Warren reported personal fees from Nanostring Technology during the conduct of the study. Dr. Kirkwood reported grants from Amgen, Inc., BMS, Castle Biosciences, Checkmate, Immunocore, Iovance, Merck, and Novartis; and personal fees from Amgen, Inc., BMS, Elsevier, Novartis, Iovance, and Immunocore, LLC, outside the submitted work. Dr. Butterfield reported personal fees from Calidi, SapVax, Replimmune, Western Oncolytics, Torque, Pyxis, NextCure, Vir, Cytomix, and Roche-Genentech outside the submitted work. No other disclosures were reported.

Figures

None
Graphical abstract
Figure S1.
Figure S1.
Associations of MA expression levels in the DC vaccines with survival time and clinical responses. (A) Scatter plots showing correlations between TYR (Tyrosinase) and MLANA (MART-1; in the same expression cassette), TYR and MAGEA6 (MAGE-A6; separate cassettes; equivalence test for R > −0.3 and R < 0.3; P = 0.258) and MLANA and MAGEA6 (separate cassettes; equivalence test for R > −0.3 and R < 0.3; P = 0.215) based on mRNA expression measured in the DC vaccines. Pearson correlation coefficient (R), with P values and 95% confidence intervals indicated. (B) Univariate Cox regression analyses for DC vaccine–MA antigen expression levels and OS and PFS. (C) Univariate Cox regression analysis for associations between MA-specific IFN-γ release (ELISPOT counts) from total PBMCs isolated at baseline (d0) or after vaccine (d43) and OS and PFS.
Figure 1.
Figure 1.
MA-specific responses before and after DC vaccination. (A) In the left panel, PBMCs from patients before (d0) and after (d43) DC vaccination were tested by ELISPOT assay for IFN-γ–producing T cells with specificities against the indicated MAs encoded in the DC vaccine (n = 31). Changes in influenza (FluM1) peptide-specific T cells are shown for comparison. P values were calculated using the Wilcoxon signed rank test. The right panel shows baseline IFN-γ ELISPOT count distributions separated based on the absence (No) or presence (Yes) of positive responses to individual MA antigens. (B and C) Gating strategy (B) and summary graphs showing the frequency of dextramer-specific CD8 T cells in the peripheral blood of HLA-A2+ patients (C) measured at d0, d43, and d89 as indicated (n = 16). P values for comparisons of frequency distributions between time points were calculated using Wilcoxon signed rank tests. (C) The middle panel shows dextramer-specific CD8 frequencies grouped according to clinical response. Baseline frequency distributions based on the absence (No) or presence (Yes) of positive responses to individual MA antigens are shown in the right panel. Positive responses were detected for 12/16, 12/16, 14/16, and 15/16 patients for Tyros368–376, MART127–35, MAGE-A6271–279, and FluM158–66, respectively. *, P ≤ 0.05; **, P ≤ 0.01; ***, P ≤ 0.001. ns, not significant; Tyros, tyrosinase; FSC-A, forward scatter area; SSC-H, side scatter height; SSC-W, side scatter width; SSC-A, side scatter area.
Figure 2.
Figure 2.
CD4 T cell IFN-γ ELISPOT frequencies and their correlations with CD8 responses. (A) CD4 cells from patients at d0, d43, and d89 were tested by ELISPOT assay for IFN-γ responses specific against the indicated MAs encoded in the DC vaccine (n = 35). P values for comparisons of frequency distributions between time points were calculated using Wilcoxon signed rank tests. The middle panel shows antigen-specific CD4 IFN-γ ELISPOT counts grouped according to clinical response. Baseline frequency distributions based on the absence (No) or presence (Yes) of positive responses to individual MA antigens are shown in the right panel. Positive responses were detected for 11/24, 15/24, 13/24, and 18/24 patients for tyrosinase, MART-1, MAGE-A6, and total AdV, respectively. *, P ≤ 0.05; **, P ≤ 0.01; ***, P ≤ 0.001. (B) Scatter plots showing correlations between CD4 and CD8 after vaccine (d43); IFN-γ ELISPOT counts reactive to full-length antigens: tyrosinase (equivalence test for R > −0.3 and R < 0.3; P = 0.547), MART-1 (equivalence test for R > −0.3 and R < 0 .3; P = 0.305), MAGE-A6 (equivalence test for R > −0.3 and R < 0.3; P = 0.305), and total AdV (equivalence test for R > −0.3 and R < 0.3; P = 0.215). Spearman correlation coefficient (R), P values based on asymptotic t approximation, and 95% confidence intervals are indicated. ns, not significant.
Figure 3.
Figure 3.
Combined totals of individual antigen-specific T cell IFN-γ ELISPOT counts correlate with PFS. (A) Summary graphs for CD8, CD4, total (CD8+CD4), and bulk (total PBMCs) IFN-γ ELISPOT counts (net count total for the three shared antigens at d43) with respect to T cell responses, as defined in Materials and methods. Test groups: CD8+ selected T cells responding to either autologous “iDCs” (immature DCs) transduced with a single MA-encoding AdV or (in HLA-A2+ patients) T2 cells pulsed with well-characterized immunodominant peptides; CD4+ selected T cells responding to autologous iDCs transduced with single MA Adv; and bulk (total PBMCs) T cell responses to autologous iDCs transduced with single MA AdV. ****, P ≤ 0.0001. (B) Kaplan-Meier survival analysis of OS and PFS comparing the survival benefits of positive CD8, CD4, combined CD8+CD4, and bulk responses. The log rank test was used to compare the Kaplan-Meier curves.
Figure 4.
Figure 4.
Effect of previous treatment with checkpoint blockade on MA-specific T cell responses. Melanoma patients were plotted separately based on whether patients received checkpoint blockade before trial enrollment and DC vaccination. Patients in the “Previous Checkpoint Therapy” panels received α–CTLA-4 and/or α–PD-1 before DC vaccination. (A) IFN-γ ELISPOT counts for CD8 T cell responses against Tyros368–376, MAGE-A6271–279, and MART-127–35 (n = 28; 15 no blockade, 13 with blockade) were compared between patient groups across the entire time course. (B) Frequencies of dextramer-specific CD8 T cells for Tyros368–376, MAGE-A3271–279, and MART-127–35 (n = 16; 9 no blockade, 7 with blockade) were compared between patient groups across the entire time course. (A and B) Differences were characterized by linear mixed model analysis, with results listed in Table 1. Prev., previous; Tyros, tyrosinase.
Figure S2.
Figure S2.
Post-trial assessment of MA-specific CD8 T cells from two HLA-A2+ patients 1.5–2 yr after DC vaccination. PBMC samples from two patients were used to determine the frequency of circulating dextramer-specific CD8 T cells as well as to examine checkpoint expression in CD8 and MA-specific CD8 T cells for patient 10 and patient 18 (A), 1.5 and 2 yr after DC vaccination, respectively. Frequencies shown for each dextramer were calculated by subtracting the negative control dextramer (Neg dex) frequency for each sample tested. Raw data histograms are shown with isotype controls for coexpression of other proteins as labeled. (B) Measurement of IgG4 in serum-free supernatants of HD DC transduced with Ad5.hPD1Ab. Two different HD monocyte-derived DC preparations were cultured for 5 d, harvested, and transduced with 500 or 1,000 MOI Ad5.hDP1Ab for 3 h before replating using serum-free AIMV media. Supernatant aliquots were taken each day as indicated after DC transduction. The concentration of human IgG4 in supernatants was quantified using a human IgG4 ELISA kit (Invitrogen) per manufacturer’s instructions. (C) Graphs show distribution of PD-1 and CTLA-4 protein expression in circulating lymphocytes grouped according to clinical response. The Wilcoxon rank sum test was used for calculating P values. *, P ≤ 0.05; **, P ≤ 0.01. ns, not significant; Tyros, tyrosinase.
Figure 5.
Figure 5.
PD-1 and CTLA-4 expression on CD8 and MA-specific T cells. (A) Gating strategy used to determine dextramer frequencies of PD-1– and CTLA-4–positive MA-specific CD8 T cells from HLA-A2+ patients. (B and C) Shown are distributions of PD-1– (B) and CTLA-4–positive (C) dextramer-specific CD8 T cells from HLA-A2+ patients grouped according to clinical outcome across time points (d0, d43, and d89; n = 16 total; two PR, three SD, three NED1, three NED2, and five PD). Tyros, tyrosinase.
Figure 6.
Figure 6.
Effect of stimulating CD8 T cells with DCs transduced with AdVMART1 and Ad5.hPD1Ab in vitro on T cell function. T cells were stimulated with AdVMART1 transduced autologous DCs in vitro followed by restimulation with DCs transduced with AdVMART1 only (gray circles) or in combination with Ad5.hPD1Ab (orange circles). (A and B) Summary graphs showing frequency and mean fluorescence intensity (MFI) of checkpoint molecules CTLA-4, LAG3, PD-1, and TIM3 in CD8 T cells (A) or MART127–35+ CD8 T cells (B). (C) T cells were stimulated with MART127–35+–pulsed T2 or Mel526 and examined for TNF-α, IFN-γ CD107a, and CD69 expression. n = 5; P values shown were calculated using paired t tests. Effect sizes are summarized using Hedges’ g as follows: g < 0.2 (negligible), g < 0.5 (small), g < 0.8 (medium), and g > 0.8 (large). A detailed list of effect sizes, confidence intervals, and equivalence testing results for these data are provided in Table S2. (A–C) *, P ≤ 0.05; **, P ≤ 0.01. ns, not significant.
Figure 7.
Figure 7.
Immune checkpoint profiling in circulating lymphocytes and patient serum. (A) PD-1 and CTLA-4 protein expression comparisons between outcome groups in baseline (d0) or d43 circulating lymphocytes. The Wilcoxon rank sum test and unpaired Welch’s t test were used for calculating P values at d0 and d43, respectively. *, P ≤ 0.05. (B) A linear mixed effect model was used to evaluate differential PD-1 and CTLA-4 protein expression between outcome groups, accounting for repeated measures of individuals across the three time points (d0, d43, and d89). Statistical significance and 95% confidence intervals (CIs) for the outcome group coefficients are indicated. (C) Univariate Cox regression analysis of PD-1 and CTLA-4 checkpoint protein expression in circulating lymphocytes isolated at baseline (d0) or after vaccine (d43) and their association with OS and PFS. (D) Difference in sPD-L2 expression with respect to good and bad clinical outcome, with P value from Wilcoxon rank sum test. *, P ≤ 0.05. (E) Scatter plots showing correlations between sPD-L2 and sLAG3 (95% CI = −0.457 to −0.06) and sPD-L2 and sTIM3 (95% CI = 0.137–0.516). Spearman correlation coefficient (R) and corresponding P value are indicated on the graphs. ns, not significant.
Figure S3.
Figure S3.
Immune checkpoint profiling in circulating lymphocytes and Luminex immune checkpoint profiling in serum. (A) Distributions of checkpoint PD-1 and CTLA-4 protein expression in relation to patient-derived MA-specific CD8, CD4, combined CD8+CD4, and Bulk (Total PBMCs) IFN-γ T cell responses, as defined in Materials and methods. (B) The Human Checkpoint 14-plex assay kit (Procarta Plex) was used to measure serum proteins, including checkpoint, costimulatory, and exhaustion markers in 35 patients profiled at baseline (n = 35), d43 (n = 30), and d89 (n = 20). Shown are distributions of soluble cytokine sPD-L2, sLAG3, and sTIM3 levels across the clinical outcome groups. For A and B, the Wilcoxon rank sum test was used for calculating P values. *, P ≤ 0.05; **, P ≤ 0.01; ***, P ≤ 0.001. (C) Scatter plots showing correlations between FACS T reg cell profiles and sPD-L2 levels. Spearman correlation coefficient (R), P values, and 95% confidence intervals are indicated. (D) Percentage distributions of FACS T reg cells in melanoma patient and normal donor samples. P values denoting significance between patient and healthy samples at indicated time points were calculated using the unpaired Welch’s t test. *, P ≤ 0.05; **, P ≤ 0.01. ns, not significant.
Figure 8.
Figure 8.
Differential expression and gene enrichment pathway analysis in circulating lymphocytes. (A and B) Volcano plots show differential gene expression by fold change (logFC) and P value (−log10[p]) for the PanCancer Immune Profiling and CAR-T Characterization NanoString gene panels comparing good (SD/PR) with bad (PD) outcome groups at baseline (d0; A) and d43 (B) in circulating lymphocyte samples. Table S3 lists information about the samples selected for NanoString profiling. Dark blue dots denote nonsignificant genes, purple dots denote significant genes with fold change ≤1.85, light blue dots represent genes with fold change ≥1.85 and P value ≥0.05, and red dots indicate genes with fold change ≥1.85 and P value ≤0.05. Summary of pathways identified by GSEA/MSigDB analysis as showing enrichment among highly differentially expressed genes at d0 (A) and d43 (B). The y axis denotes NES, and the squares represent up-regulated (red, associated with good outcome) and down-regulated (blue, associated with bad outcome) pathways with corresponding gene enrichment P values indicated on the midline. (C) GSEA plot for the CTLA-4 inhibitory pathway and a heatmap of its associated gene set, illustrating enrichment for down-regulation at d43 relative to d0. (D) GSEA plot for the PD-1 signaling pathway and its associated gene set, which is down-regulated at d89 versus d43 in circulating lymphocytes. For C and D, circulating lymphocytes from patients with good clinical outcome were used, as there were no available samples from PD patients. Heatmaps in C and D show the clustered genes in the leading-edge subsets for each pathway category. Gene expression values are represented as colors, where the range of colors (red, pink, light blue, dark blue) shows the range of expression values (high, moderate, low, lowest).
Figure S4.
Figure S4.
Differential gene expression and immune checkpoint pathway associations in circulating lymphocytes and tumor/TIL samples. (A) Heatmaps for differentially expressed genes. Shown are heatmaps for differentially expressed genes between clinical response groups that were profiled using the PanCancer Immune Profiling and CAR-T Characterization panels in baseline and d43 circulating lymphocytes. Differential gene expression analysis was conducted using the limma R package as described in the Materials and methods section. Hierarchical clustering of DEGs was conducted using the pheatmap R package. The threshold for DE genes was set to fold change ≥1.85 and P value ≤0.05. Relevant phenotypic patient information associated with each lymphocyte sample is illustrated above the heatmaps. (B) PD-1 signaling pathway enrichment changes from d0 to d43 circulating lymphocytes. Shown is a GSEA plot and associated gene signature for the PD-1 signaling pathway. This figure comes from the same set of analysis and is analogous to the CTLA-4 GSEA plot in Fig. 8 C. (C) CTLA-4 pathway enrichment changes from d43 to d89 circulating lymphocytes. Shown are statistical parameters (NES and P value) for the CTLA-4 inhibitory signaling pathway. This figure comes from the same set of analysis and is analogous to the PD-1 GSEA plot in Fig. 8 D. (D) Results from the GSEA correlation-based enrichment analysis, which used the numeric PD-1 protein expression levels as a continuous phenotype. d43 and d89 (omitting baseline samples) circulating lymphocyte expression sets were used for this analysis. Shown is a representative GSEA plot and heatmap for genes involved in the CTLA-4 inhibitory signaling pathway, which positively correlated with PD-1 protein expression (shown as bar graph above the heatmap) in patient lymphocytes. (E) Immune checkpoint pathways associated with clinical outcomes in tumor biopsies. Shown are GSEA plots for PD-1 signaling and CTLA-4 inhibitory pathways enriched in tumor biopsy specimens from unfavorable (bad) clinical outcome patient groups. The associated gene signatures are presented in the form of heatmaps next to GSEA plots. Heatmaps in B–E show the clustered genes in the leading-edge subsets for each pathway category. Gene expression values are represented as colors, where the range of colors (red, pink, light blue, dark blue) shows the range of expression values (high, moderate, low, lowest). Prev., previous.
Figure 9.
Figure 9.
Significantly enriched pathways associated with immune checkpoint expression levels in circulating lymphocytes and clinical outcome in tumor biopsies. (A) Several GSEA pathways correlating with PD-1 and CTLA4 protein expression are represented. Gene sets belonging to different pathway categories are represented as dots, which are organized by their NES score along the x axis. The color and size of the dots indicate the corresponding P values and number of genes associated with the gene set, respectively. Representative GSEA plot and heatmap for genes involved in the PD-1 signaling pathway, which positively correlates with PD-1 protein expression (shown as bar graph above the heatmap) in patient lymphocytes. (B) GSEA plot and clustered heatmap of expression values for leading edge genes in the CTLA-4 inhibitory signaling pathway, which negatively correlates with OS in tumor biopsy samples (n = 19). Refer to Fig. 7 for interpretation of the gene expression values in heatmaps.
Figure S5.
Figure S5.
Comparisons for differentially expressed genes between the NanoString Panels and GSEA analysis of T cell exhaustion gene profiles. (A) Summary of differentially expressed (DE) genes in circulating lymphocytes at d0 and d43. Venn diagrams show differentially expressed genes (LogFC ≥ 2 and P ≤ 0.05) in baseline (left) and d43 lymphocyte samples (right) that are represented in both the PanCancer Immune Profiling and CAR-T Characterization NanoString gene panels used in our study. PanCancer UP/DOWN and CAR-T UP/DOWN groups contain genes that are up-/down-regulated in the PanCancer Immune Profiling and CAR-T Characterization NanoString panel, respectively. Genes from each of the Venn diagram sections are listed in the figure. A set of six genes that are highlighted in yellow denote gene probes that were detected as up-regulated in both NanoString panels. (B and C) Immune checkpoint pathway associations with T cell exhaustion profiles in circulating lymphocytes. Representative GSEA plots for T cell exhaustion-related immune regulatory pathways correlating with good and bad clinical outcome groups in baseline (B) and d43 (C) circulating lymphocytes. T cell exhaustion signatures were obtained using the MSigDB C7 immunological gene database. Heatmaps next to the GSEA plots show clustered genes in the leading-edge subsets for each pathway category. Gene expression values are represented as colors, where the range of colors (red, pink, light blue, dark blue) shows the range of expression values (high, moderate, low, lowest). (D) Effector/memory T cellsversus exhaustion gene signatures in the good outcome patients’ circulating lymphocytes. Here, we provide a table summary for a set of differentially expressed genes at baseline (d0) and in postvaccine samples (43) that are categorized based on their association with a particular T cell phenotype (effector, memory, or exhaustion).

References

    1. Anguille S., Smits E.L., Lion E., van Tendeloo V.F., and Berneman Z.N.. 2014. Clinical use of dendritic cells for cancer therapy. Lancet Oncol. 15:e257–e267. 10.1016/S1470-2045(13)70585-0 - DOI - PubMed
    1. Appleman L.J., Normolle D.P., Logan T.F., Monk P., Olencki T., McDermott D.F., Ernstoff M.S., Maranchie J.K., Parikh R.A., Friedland D., et al. . 2018. Safety and activity of hydroxychloroquine and aldesleukin in metastatic renal cell carcinoma: A cytokine working group phase II study. J. Clin. Oncol. 36(15_suppl):4573 10.1200/JCO.2018.36.15_suppl.4573 - DOI
    1. Baitsch L., Baumgaertner P., Devêvre E., Raghav S.K., Legat A., Barba L., Wieckowski S., Bouzourene H., Deplancke B., Romero P., et al. . 2011. Exhaustion of tumor-specific CD8+ T cells in metastases from melanoma patients. J. Clin. Invest. 121:2350–2360. 10.1172/JCI46102 - DOI - PMC - PubMed
    1. Benci J.L., Xu B., Qiu Y., Wu T.J., Dada H., Twyman-Saint Victor C., Cucolo L., Lee D.S.M., Pauken K.E., Huang A.C., et al. . 2016. Tumor Interferon Signaling Regulates a Multigenic Resistance Program to Immune Checkpoint Blockade. Cell. 167:1540–1554.e12. 10.1016/j.cell.2016.11.022 - DOI - PMC - PubMed
    1. Butterfield L.H., Jilani S.M., Chakraborty N.G., Bui L.A., Ribas A., Dissette V.B., Lau R., Gamradt S.C., Glaspy J.A., McBride W.H., et al. . 1998. Generation of melanoma-specific cytotoxic T lymphocytes by dendritic cells transduced with a MART-1 adenovirus. J. Immunol. 161:5607–5613. - PubMed

Publication types

MeSH terms