. 2020 May 21;5(10):e135454.
doi: 10.1172/jci.insight.135454.

Tubular β-catenin and FoxO3 interactions protect in chronic kidney disease

Affiliations

Tubular β-catenin and FoxO3 interactions protect in chronic kidney disease

Stellor Nlandu-Khodo et al. JCI Insight. .

Abstract

The Wnt/β-catenin signaling pathway plays an important role in renal development and is reexpressed in the injured kidney and other organs. β-Catenin signaling is protective in acute kidney injury (AKI) through actions on the proximal tubule, but the current dogma is that Wnt/β-catenin signaling promotes fibrosis and development of chronic kidney disease (CKD). As the role of proximal tubular β-catenin signaling in CKD remains unclear, we genetically stabilized (i.e., activated) β-catenin specifically in murine proximal tubules. Mice with increased tubular β-catenin signaling were protected in 2 murine models of AKI to CKD progression. Oxidative stress, a common feature of CKD, reduced the conventional T cell factor/lymphoid enhancer factor-dependent β-catenin signaling and augmented FoxO3-dependent activity in proximal tubule cells in vitro and in vivo. The protective effect of proximal tubular β-catenin in renal injury required the presence of FoxO3 in vivo. Furthermore, we identified cystathionine γ-lyase as a potentially novel transcriptional target of β-catenin/FoxO3 interactions in the proximal tubule. Thus, our studies overturned the conventional dogma about β-catenin signaling and CKD by showing a protective effect of proximal tubule β-catenin in CKD and identified a potentially new transcriptional target of β-catenin/FoxO3 signaling that has therapeutic potential for CKD.

Keywords: Cell Biology; Cell stress; Fibrosis; Nephrology.


Conflict of interest statement

Conflict of interest: The authors have declared that no conflict of interest exists.

Figures

Figure 1
Figure 1. Increased β-catenin signaling in proximal tubules protects against AKI to CKD injury.
(A) H&E sections of Ggt-Cre Ctnnb1ex3fl/fl mice and floxed controls without injury as well as 6 weeks after aristolochic acid nephropathy (AAN). Scale bars: 50 μm. (B) Injury was scored by colleagues who did not know the identity of the genotype (see Methods for scoring system). (C) KIM-1 (Havcr1) levels were measured by quantitative PCR, normalized to Gapdh, in cortical tissue from both uninjured and aristolochic acid–treated mice. (D and E) Picrosirius red (Sirius Red) staining measured collagen (red staining) and was quantified using ImageJ (NIH). Scale bar: 50 μm. (F) Collagen I (Col1a1) transcripts were measured by quantitative PCR (qPCR), normalized to Gapdh, from renal cortices 6 weeks after AAN. (G) Blood urea nitrogen (BUN) was measured from mice either uninjured or 6 weeks after AAN. (H) H&E from Ggt-Cre Ctnnb1ex3fl/fl mice and floxed controls injured by IRI and sacrificed 4 weeks later (see Methods for details). Scale bar: 100 μm for original magnification ×200 and 50 μm for ×400. (I) KIM-1 (Havcr1) expression in renal tissue after IRI injury and (J) BUN levels were measured at the time of sacrifice (4 weeks after IRI). (K) Staining for lotus tetragonolobus (LTL) conjugated to GFP was done. Scale bar: 100 μm for original magnification ×200 and 200 μm for ×100 (K) and quantified by ImageJ (L). (M) Collagen (Col1a1) levels were measured by qPCR from renal tissue 4 weeks after IRI. For all qPCR studies after IRI, the inner medulla was dissected away and discarded. Statistical analyses were done using the Student’s t test with *P < 0.05, **P < 0.01, and ***P < 0.001. For the AAN injury, 1 Ctnnb1ex3fl/fl mouse died before the study’s completion, and for the IRI model, 1 mouse per genotype died prematurely.
Figure 2
Figure 2. Increased β-catenin signaling protects against apoptosis in vivo and in vitro.
(A) TUNEL staining was performed to detect apoptotic/necrotic cells in uninjured kidneys and those 6 weeks after aristolochic acid (AA) exposure. Scale bar: 50 μm. Arrows point to TUNEL+ cortical tubule nuclei. (B) The TUNEL+ cortical tubule cells were quantified by counting 10 views (at original magnification ×400) per kidney, and the fields were chosen and TUNEL+ cells counted by personnel blinded to the genotype. (C) Proximal tubule (PT) cells in vitro were treated with AA 30 μM for 7 days with a GSK-3 inhibitor (BIO) added to some cells for the last 48 hours of treatment. (D) Cell lysates were immunoblotted for cleaved caspase-3, a measurement of apoptosis, and focal adhesion kinase (FAK) for loading control. (E and F) PT cells were also treated with AA ± Wnt3a ligand with a statistically significant decrease in AA-induced apoptosis with 10 ng/mL of Wnt. Student’s t test was used for statistical comparisons between 2 groups in B and D, and ANOVA for multiple comparisons was used for F with *P < 0.05. For each of the 3 experiments in E and F, the value of Wnt3a at 5 ng/mL was normalized to 1 and others expressed relative to this with each value compared with AA without Wnt3a (control).
Figure 3
Figure 3. Oxidative stress reduces β-catenin/LEF/TCF-dependent signaling and augments β-catenin/FoxO signaling.
(A) PT cells were treated with varying doses of Wnt3a either in control conditions (PT medium as described in Methods) or with oxidative stress (H2O2 100 μM in serum-free DMEM/F12) for 16 hours, and Axin2 transcripts were measured by qPCR and normalized to Gapdh. (B) PT cells stably transfected with a Topflash reporter construct (see Methods) were treated with various doses of Wnt3a in either control or oxidative stress medium (H2O2 100 μM in serum-free DMEM/F12). A luminometer measured the TCF/LEF-dependent activity (Steady Glo), which was normalized to cell number by using Cell Titer assay. For both A and B, Holm-Šídák multiple-comparisons test was used. (C) Cells treated with AA for 5 days showed increased oxidative stress reflected by increased nitrotyrosine on immunoblots. PT cells were treated with AA (30 μM), Wnt3a (10 ng/mL) was added during the last 48 hours, and nuclei were isolated (see Methods) and immunoblotted for FoxO1, FoxO3, or histone H3 for loading (D), and the results from 3 separate experiments were quantified (E). (F) PT cells were treated ± Wnt3a (10 ng/mL) and oxidative stress (H2O2 100 μM) for 16 hours, and then nuclei were isolated and coimmunoprecipitation was performed. Nuclear isolates had either β-catenin pull-down or IgG control, then were immunoblotted with FoxO3, and histone H3 was used for loading control of nuclear input. The nuclear input was also immunoblotted with α-tubulin, to assess for nuclear purity, and β-catenin. Levels of FoxO3 from the coimmunoprecipitation, normalized to histone H3 (nuclear input), were quantified from 3 separate experiments (G), as were nuclear β-catenin levels (H). Student’s t test was used for statistical analyses in G and H, and ANOVA was used for multiple comparisons in E with *P < 0.05 and **P < 0.01.
Figure 4
Figure 4. Inhibiting FoxO3 in PT cells increases while ICG-001 reduces AA-induced apoptosis.
(A) We effectively reduced FoxO3 expression in PT cells by immunoblots using siRNA. (B) PT cells treated with Foxo3 or scramble siRNA were treated with AA, and apoptosis was measured by cleaved caspase-3 on immunoblots with GAPDH as loading control. (C) The results of 3 independent studies were quantified by ImageJ. (D) PT cells were treated ± AA (30 μM for 7 days) and ICG-001 to inhibit β-catenin/TCF/LEF for the last 4 days and then lysates blotted for cleaved caspase-3 and GAPDH for loading. (E) Three experiments with AA + ICG-001 or DMSO (diluent control) are quantified, and the data were normalized to AA + DMSO. Student’s t test was used for statistical comparisons with *P < 0.05 and **P < 0.01. GAPDH, glyceraldehyde 3, phosphate dehydrogenase.
Figure 5
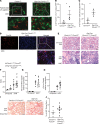
Figure 5. FoxO3 expression is increased in PTs with β-catenin stabilized and is required for the protective effect of β-catenin in PTs in AAN.
(A) FoxO3 (red) and LTL (green), a marker for PT cells, staining on frozen sections at 6 weeks after AAN with quantification of FoxO3+LTL+ tubule cells (B) and FoxO3+ cortical tubule cells (C) per high-power field, original magnification, ×400. (D) FoxO3 staining (red) merged with DAPI (blue) staining to show nuclear localization of FoxO3. (E) H&E sections of mice with β-catenin stabilized and FoxO3 deleted from the PT (Ggt-Cre Ctnnb1ex3fl/fl Foxo3fl/fl) and floxed control mice both uninjured and 6 weeks after AAN. (F) BUN of mice uninjured and 6 weeks after AAN is shown as well as KIM-1 (Havcr1) and collagen I (Col1a1) transcript levels by qPCR after normalization to Gapdh (G and H). Picrosirius red staining done on the mice 6 weeks after AAN (I) with quantification by ImageJ (J). Scale bar: 50 μm (black bar in original magnification ×400 and white bar in insets). In all graphs, Student’s t test was used to compare 2 sets of data (uninjured mice shown as controls but not included in statistical analyses) with *P < 0.05. One mouse from each genotype died before the study was completed.
Figure 6
Figure 6. CSE identified as a potentially novel target of β-catenin and FoxO3 in PT cells.
(A) RNA-Seq was performed on PT cells transfected with Foxo1, Foxo3, or scramble siRNA, treated with Wnt3a 20 ng/mL and H2O2 100 μM in serum-free medium for 16 hours. (B) Cth, the gene for CSE, was validated as a target for β-catenin and FoxO3 using PT cells. The cells were transfected with Foxo3 or scramble siRNA, then treated with Wnt3a (20 ng/mL) in the presence or absence of oxidative stress (100 μM H2O2 in serum-free medium) for 24 hours, and Cth transcripts were measured by qPCR and normalized to Gapdh (B). *P < 0.05 using the Student’s t test. (C) PT cells were treated ± AA at 30 μM for 7 days with a GSK-3 inhibitor added for the last 2 days, and protein lysates were immunoblotted for CSE with FAK for loading control and quantified using ImageJ (D). PT cells were transfected with either Cth or scramble siRNA and then treated ± AA. (E) Effective reduction in CSE was verified with immunoblots and cleaved caspase-3 measured to detect apoptosis with α-tubulin for loading control. Immunoblots were quantified from 3 independent experiments using ImageJ (F). The statistics for RNA-Seq are discussed in the Methods. For all other comparisons, the Student’s t test comparing 2 sets of data was used (cells without oxidative stress or AA are shown as controls but not included in analyses) with *P < 0.05.
Figure 7
Figure 7. Injured mice with β-catenin stabilized in the PT have increased protein expression of CSE.
(A) Cortical lysates from Ggt-Cre Ctnnb1ex3fl/fl mice and floxed controls 6 weeks after AA treatment were immunoblotted for CSE with α-tubulin for loading control. (B) ImageJ was used to quantify the differences in CSE protein expression. (C) Immunohistochemistry for CSE was performed on uninjured and AAN (6 weeks) kidneys. (D) Cth transcripts were measured by qPCR in renal cortical tissue from uninjured and 6-week AA-treated mice. (E) Immunoblots from cortical lysates of mice injured by AA and stained for CSE and α-tubulin for loading control. Student’s t test was used to compare 2 groups of samples with *P < 0.05 and **P < 0.01. Scale bar: 50 μm.
Figure 8
Figure 8. Schematic of how oxidative stress modulates β-catenin and FoxO signaling to affect H2S and glutathione through CSE.
Wnt ligands and GSK-3 inhibitors both rescue β-catenin from degradation leading to increased nuclear (i.e., transcriptionally active) β-catenin. Usually β-catenin partners with transcription factors TCF/LEF, but in oxidative stress, β-catenin promotes FoxO1/3-dependent activity. One downstream target of β-catenin and FoxO3 is CSE, which converts cystathionine to cysteine and contributes to H2S and glutathione production.

References

    1. United States Renal Data System. 2016 USRDS Annual Data Report: Epidemiology of Kidney Disease in the United States. Bethesda, Maryland, USA: National Institutes of Health, National Institute of Diabetes and Digestive and Kidney Diseases; 2016.
    1. Hill NR, et al. Global prevalence of chronic kidney disease - a systematic review and meta-analysis. PLoS One. 2016;11(7):e0158765. doi: 10.1371/journal.pone.0158765. - DOI - PMC - PubMed
    1. Coca SG, Singanamala S, Parikh CR. Chronic kidney disease after acute kidney injury: a systematic review and meta-analysis. Kidney Int. 2012;81(5):442–448. doi: 10.1038/ki.2011.379. - DOI - PMC - PubMed
    1. Grgic I, et al. Targeted proximal tubule injury triggers interstitial fibrosis and glomerulosclerosis. Kidney Int. 2012;82(2):172–183. doi: 10.1038/ki.2012.20. - DOI - PMC - PubMed
    1. Takaori K, et al. Severity and frequency of proximal tubule injury determines renal prognosis. J Am Soc Nephrol. 2016;27(8):2393–2406. doi: 10.1681/ASN.2015060647. - DOI - PMC - PubMed

Publication types

MeSH terms