Clinical Trial
. 2020 May 21;5(10):e137131.
doi: 10.1172/jci.insight.137131.

Tryptophan catabolism reflects disease activity in human tuberculosis

Affiliations
Clinical Trial

Tryptophan catabolism reflects disease activity in human tuberculosis

Jeffrey M Collins et al. JCI Insight. .

Abstract

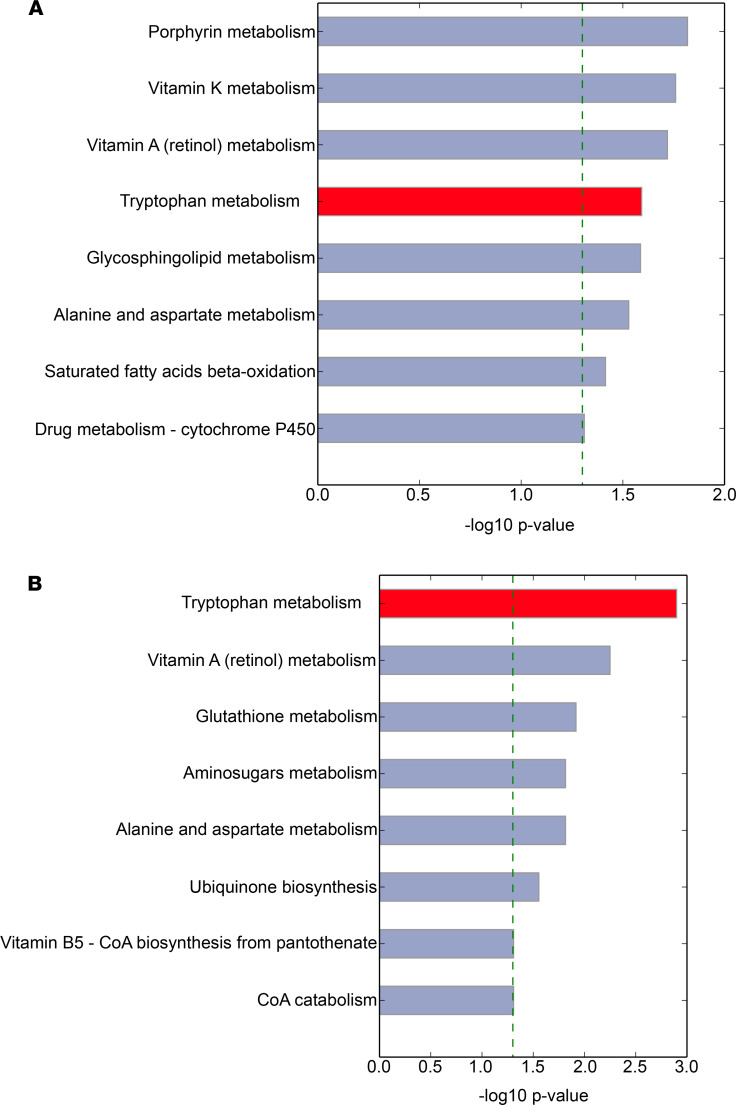
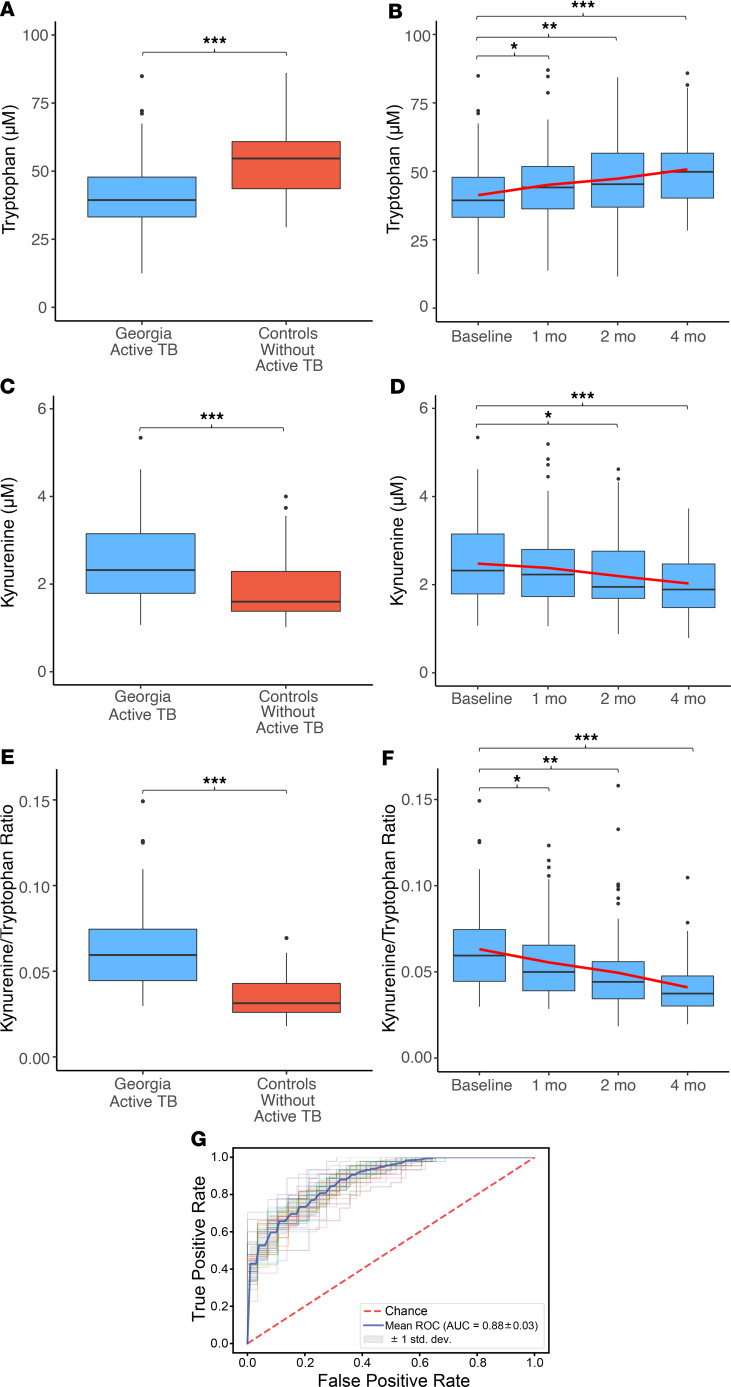
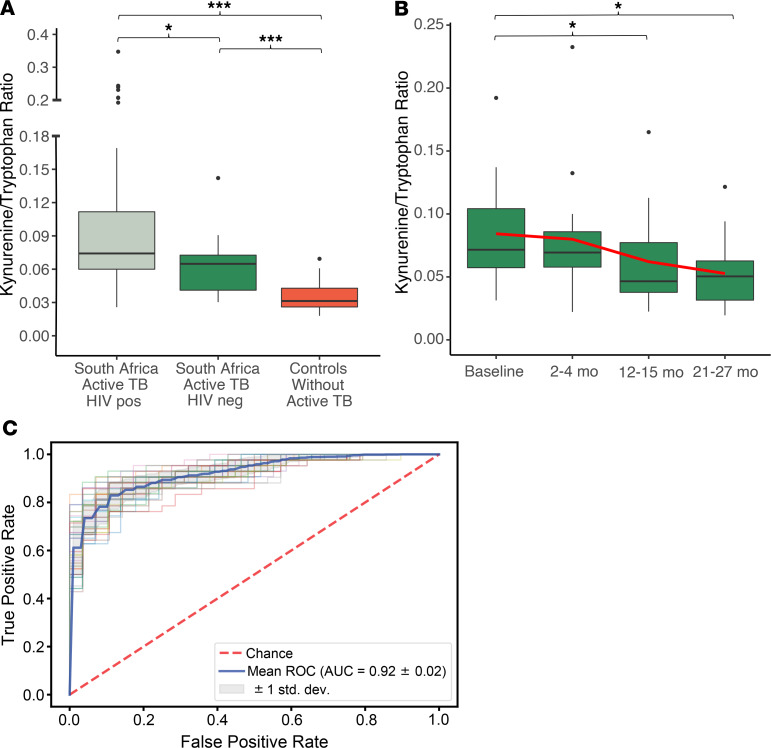
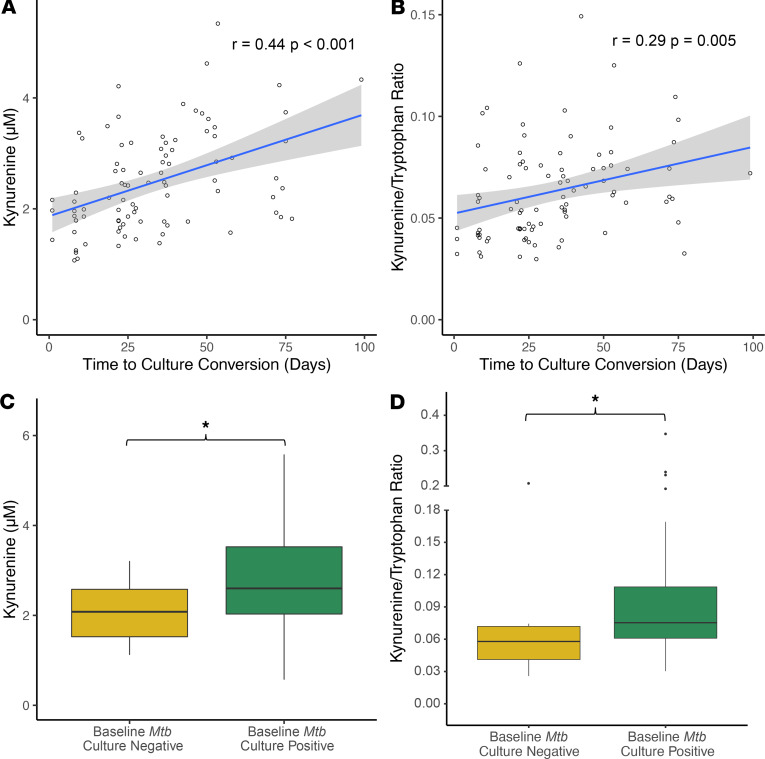
There is limited understanding of the role of host metabolism in the pathophysiology of human tuberculosis (TB). Using high-resolution metabolomics with an unbiased approach to metabolic pathway analysis, we discovered that the tryptophan pathway is highly regulated throughout the spectrum of TB infection and disease. This regulation is characterized by increased catabolism of tryptophan to kynurenine, which was evident not only in active TB disease but also in latent TB infection (LTBI). Further, we found that tryptophan catabolism is reversed with effective treatment of both active TB disease and LTBI in a manner commensurate with bacterial clearance. Persons with active TB and LTBI also exhibited increased expression of indoleamine 2,3-dioxygenase-1 (IDO-1), suggesting IDO-1 mediates observed increases in tryptophan catabolism. Together, these data indicate IDO-1-mediated tryptophan catabolism is highly preserved in the human response to Mycobacterium tuberculosis and could be a target for biomarker development as well as host-directed therapies.

Keywords: Infectious disease; Metabolism; Tuberculosis.


Conflict of interest statement

Conflict of interest: The authors have declared that no conflict of interest exists.

Figures

Figure 1
Figure 1. The tryptophan metabolic pathway is highly regulated in the host response to TB disease and chemotherapy-mediated bacterial clearance.
(A) Differences in metabolic pathway activity (21) in persons from the country of Georgia with active TB disease at the time of diagnosis (n = 89) versus controls without active TB disease (n = 57). (B) Changes in metabolic pathway activity in persons from Georgia over 4 months of treatment for drug-susceptible TB (DS-TB) disease with directly observed therapy. The horizontal bars show the magnitude of the –log(P value) for pathway enrichment in each pathway.
Figure 2
Figure 2. Tryptophan catabolism in persons with DS pulmonary TB disease in Georgia.
(A) Plasma tryptophan concentrations were significantly lower in persons with DS pulmonary TB disease from Georgia (light blue; n = 89) versus controls without active TB disease (red; n = 57) and (B) significantly increased after 1, 2, and 4 months of DOT compared with baseline. The red line indicates the trend of the mean over time. (C) Plasma kynurenine concentrations were significantly higher in Georgian patients with DS-TB versus controls and (D) significantly declined after 1, 2, and 4 months of active TB treatment. (E) The plasma kynurenine/tryptophan (K/T) ratio was also significantly higher in patients with active TB versus controls and (F) declined with antibiotic therapy in a stepwise fashion. (G) The receiver operator characteristic curve (ROC) for the plasma K/T ratio demonstrated excellent classification accuracy for identification of pulmonary TB. Active TB cases from Georgia were compared with controls using a Wilcoxon rank-sum test. Changes in tryptophan, kynurenine, and the K/T ratio relative to baseline were compared using a Wilcoxon signed-rank test (*P ≤ 0.05, **P < 0.01, and ***P < 0.001). The AUC for the ROC curve was calculated using logistic regression with 2-fold crossvalidation. The box plots depict the minimum and maximum values (whiskers), the upper and lower quartiles, and the median. The length of the box represents the interquartile range.
Figure 3
Figure 3. Tryptophan catabolism in persons with multidrug-resistant pulmonary TB disease in South Africa.
(A) The plasma K/T ratio was significantly higher in South African multidrug-resistant TB (MDR-TB) patients with (n = 64) and without (n = 21) HIV coinfection versus controls (n = 57). (B) In MDR-TB patients with plasma samples available for the duration of the 2-year treatment period (12 HIV positive, 5 HIV negative), the plasma K/T ratio significantly declined at both 12- to 15-month and 21- to 27-month time points relative to baseline. The red line indicates the trend of the mean over time. (C) The ROC curve for the plasma K/T ratio demonstrated excellent classification accuracy for identification of pulmonary TB in South Africa. The plasma K/T ratio in active TB cases was compared with controls using a Wilcoxon rank-sum test, and changes relative to baseline were compared using a Wilcoxon signed-rank test (*P ≤ 0.05, and ***P < 0.001). The AUC for the ROC curve was calculated using logistic regression with 2-fold crossvalidation. The box plots depict the minimum and maximum values (whiskers), the upper and lower quartiles, and the median. The length of the box represents the interquartile range.
Figure 4
Figure 4. The baseline plasma K/T ratio is associated with time to sputum culture conversion.
In persons from Georgia with active TB disease (n = 89), (A) the baseline plasma kynurenine concentration and (B) the baseline plasma K/T ratio were significantly and positively correlated with subsequent time to sputum culture conversion. In persons from South Africa with active TB disease and baseline sputum culture results (n = 71), (C) the baseline plasma kynurenine concentration and (D) the baseline plasma K/T ratio were significantly higher in persons who remained sputum culture positive for M. tuberculosis versus those who did not. For correlation analyses r indicates the Pearson correlation coefficient. Persons from South Africa who remained sputum culture positive for M. tuberculosis versus those who were not were compared using a Wilcoxon rank-sum test (*P ≤ 0.05). The box plots depict the minimum and maximum values (whiskers), the upper and lower quartiles, and the median. The length of the box represents the interquartile range.
Figure 5
Figure 5. The plasma K/T ratio is increased in persons with LTBI and normalizes with latent TB treatment.
(A) Kenyan household contacts (n = 30) and US refugees (n = 28) with LTBI had a significantly higher plasma K/T ratio compared with Kenyan household contacts testing negative for latent TB (n = 39). (B) In persons treated for latent TB with 3 months of weekly isoniazid and rifapentine (3HP; n = 28), the plasma K/T ratio decreased in a stepwise fashion 3 and 6 months after treatment start and remained significantly lower after 9 and 12 months compared with baseline. The red line indicates the trend of the mean over time. (C) Although the plasma K/T ratio was similar at baseline for Kenyan contacts and US refugees with LTBI, it was significantly lower 6 and 12 months after starting 3HP treatment in the US refugee cohort. Cohorts with LTBI were compared with each other and to uninfected controls using a Wilcoxon rank-sum test. For the latent TB treatment cohort, each treatment time point was compared with baseline using a Wilcoxon signed-rank test (*P ≤ 0.05, and **P < 0.01). The box plots depict the minimum and maximum values (whiskers), the upper and lower quartiles, and the median. The length of the box represents the interquartile range.
Figure 6
Figure 6. Whole blood transcriptomics demonstrates increased IDO-1 transcription in HIV-negative and HIV-positive persons with active TB disease and LTBI.
The bubble plots represent whole blood measurement of transcriptional changes in the tryptophan catabolic enzyme IDO-1 in HIV-negative persons (left box) and HIV-positive persons (right box). Study accession numbers from the publicly available National Center for Biotechnology Information’s Gene Expression Omnibus (GEO) data repository are shown on the x axis, and each comparison is shown on the y axis. The color scale for each dot represents the log2 fold change in expression for persons with active TB disease (ATB) and LTBI relative to healthy controls (HC) and person with diseases other than TB and no evidence of infection with M. tuberculosis (OD). The dot size represents the –log P value for each comparison. ‡studies that were performed in children.

References

    1. WHO. World Health Organization Global Tuberculosis Report 2019. WHO. https://www.who.int/tb/publications/global_report/en/ Published October 17, 2019. Accessed April 30, 2020.
    1. Ernst JD. Mechanisms of M. tuberculosis immune evasion as challenges to TB vaccine design. Cell Host Microbe. 2018;24(1):34–42. doi: 10.1016/j.chom.2018.06.004. - DOI - PMC - PubMed
    1. Li S, et al. Metabolic phenotypes of response to vaccination in humans. Cell. 2017;169(5):862–877.e17. doi: 10.1016/j.cell.2017.04.026. - DOI - PMC - PubMed
    1. van Laarhoven A, et al. Cerebral tryptophan metabolism and outcome of tuberculous meningitis: an observational cohort study. Lancet Infect Dis. 2018;18(5):526–535. doi: 10.1016/S1473-3099(18)30053-7. - DOI - PubMed
    1. Weiner J, et al. Metabolite changes in blood predict the onset of tuberculosis. Nat Commun. 2018;9(1):5208. doi: 10.1038/s41467-018-07635-7. - DOI - PMC - PubMed

Publication types

MeSH terms