

Human Induced Pluripotent Stem Cell-Derived 3D-Neurospheres are Suitable for Neurotoxicity Screening
- PMID: 32369990
- PMCID: PMC7290365
- DOI: 10.3390/cells9051122
Human Induced Pluripotent Stem Cell-Derived 3D-Neurospheres are Suitable for Neurotoxicity Screening
Abstract
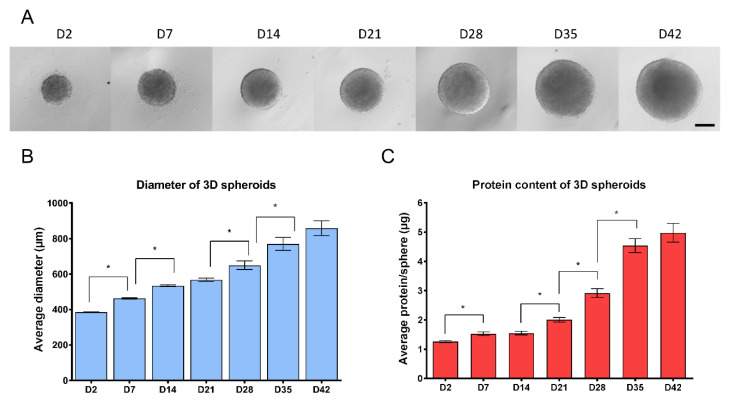
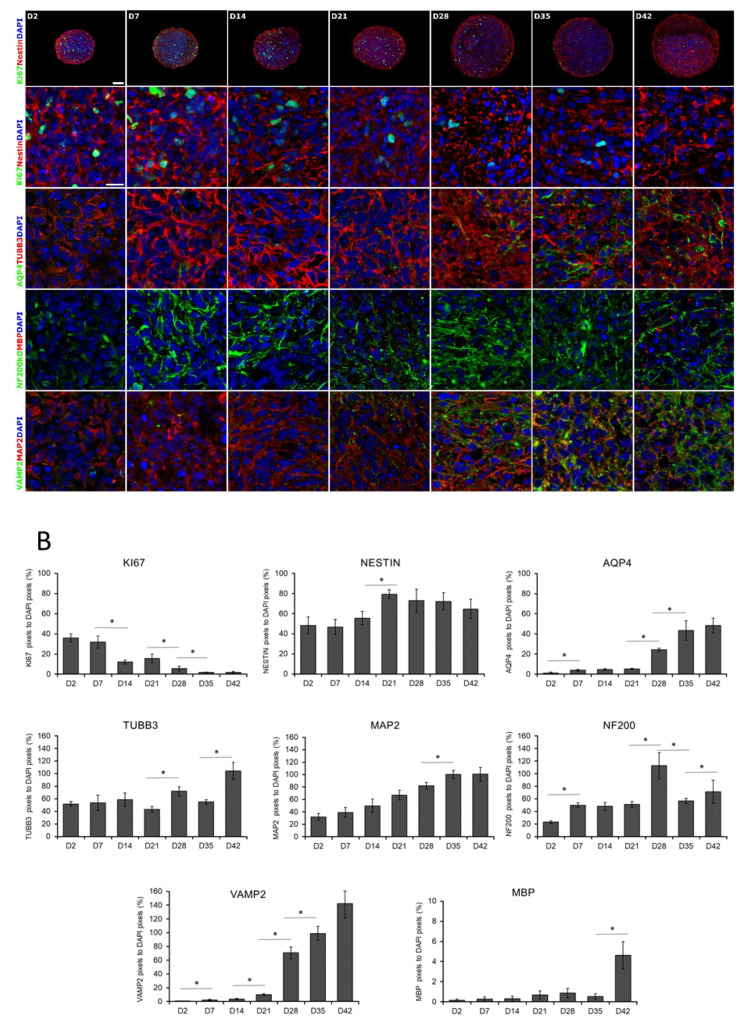
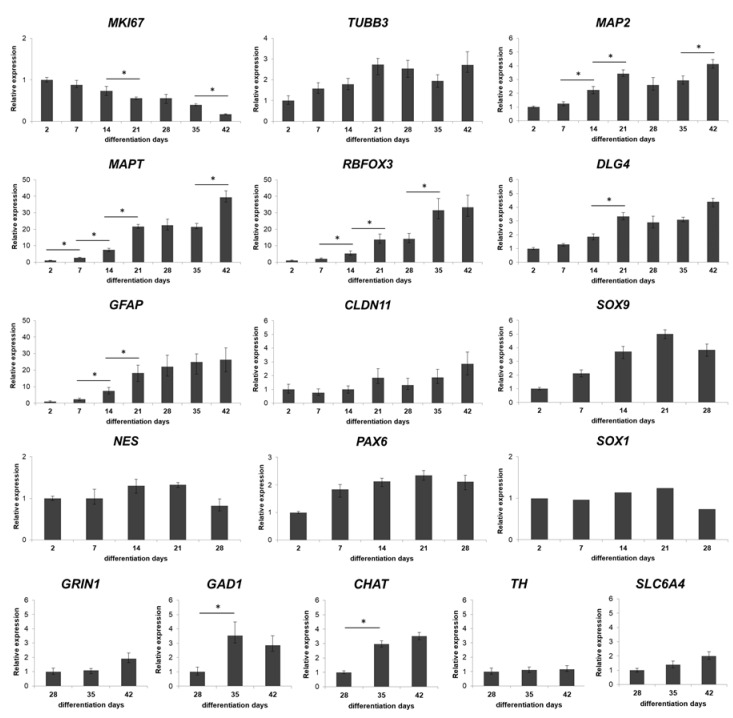
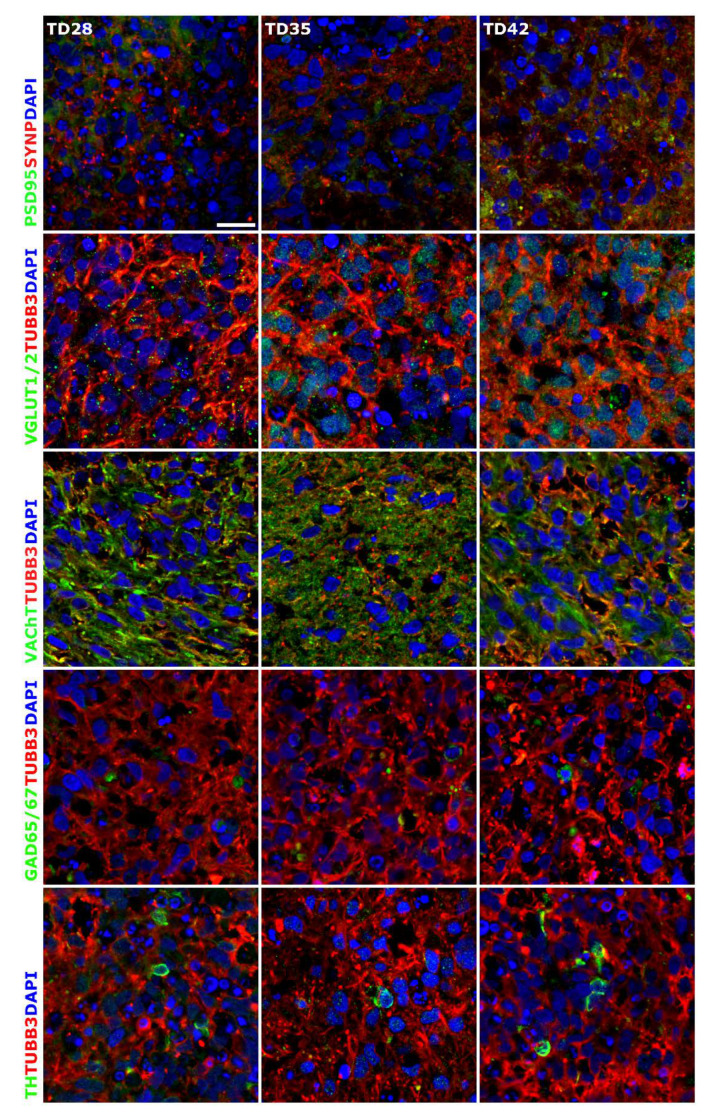
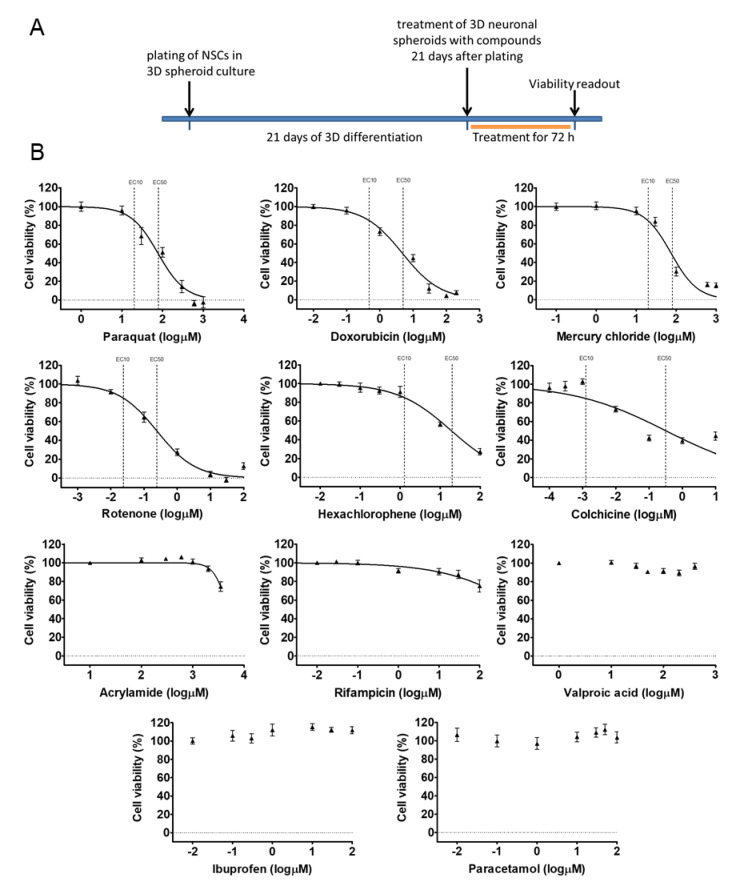
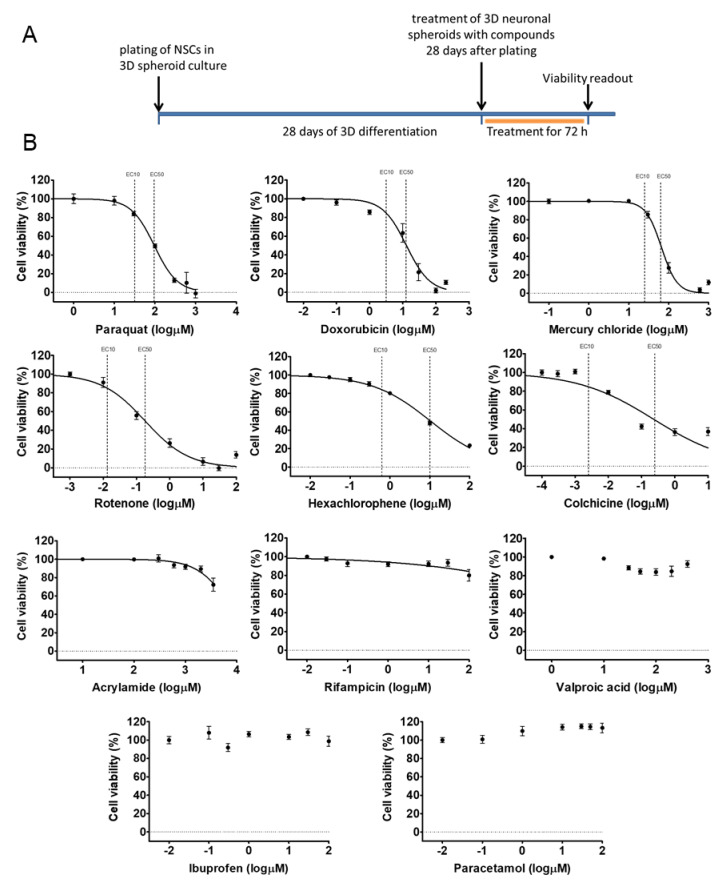
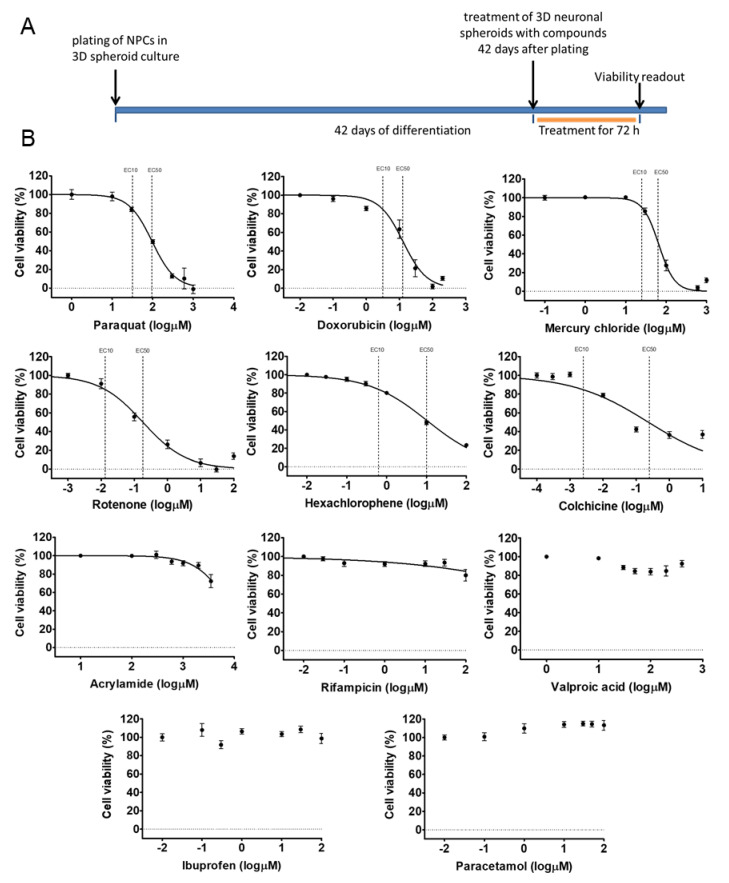
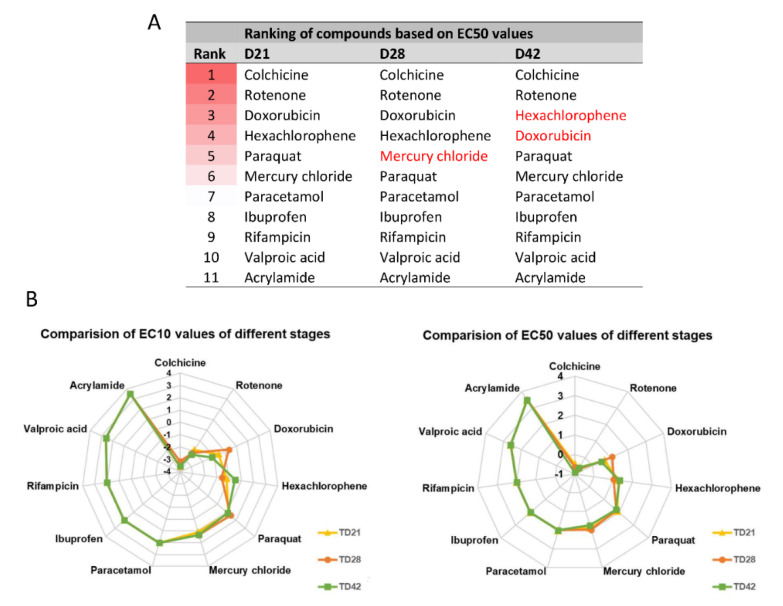
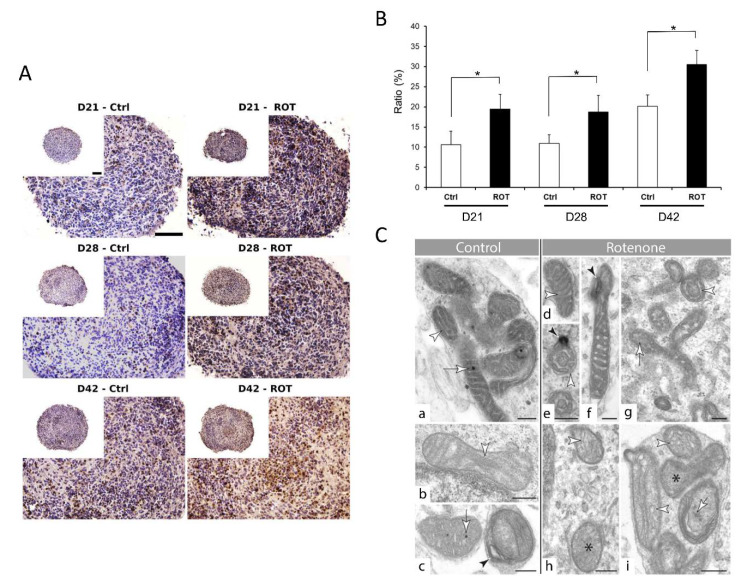
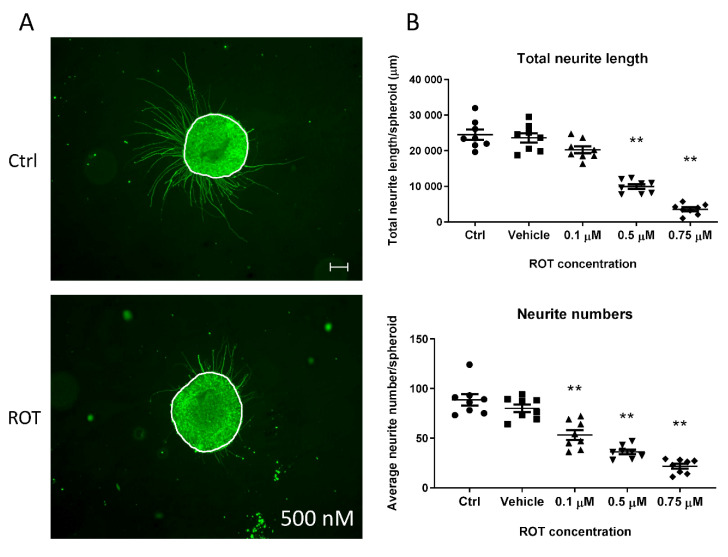
We present a hiPSC-based 3D in vitro system suitable to test neurotoxicity (NT). Human iPSCs-derived 3D neurospheres grown in 96-well plate format were characterized timewise for 6-weeks. Changes in complexity and homogeneity were followed by immunocytochemistry and transmission electron microscopy. Transcriptional activity of major developmental, structural, and cell-type-specific markers was investigated at weekly intervals to present the differentiation of neurons, astrocytes, and oligodendrocytes. Neurospheres were exposed to different well-known toxicants with or without neurotoxic effect (e.g., paraquat, acrylamide, or ibuprofen) and examined at various stages of the differentiation with an ATP-based cell viability assay optimized for 3D-tissues. Concentration responses were investigated after acute (72 h) exposure. Moreover, the compound-specific effect of rotenone was investigated by a panel of ER-stress assay, TUNEL assay, immunocytochemistry, electron microscopy, and in 3D-spheroid based neurite outgrowth assay. The acute exposure to different classes of toxicants revealed distinct susceptibility profiles in a differentiation stage-dependent manner, indicating that hiPSC-based 3D in vitro neurosphere models could be used effectively to evaluate NT, and can be developed further to detect developmental neurotoxicity (DNT) and thus replace or complement the use of animal models in various basic research and pharmaceutical applications.
Keywords: 3D culture; induced pluripotent stem cells; neurite outgrowth; neurospheres; neurotoxicity.
Conflict of interest statement
The authors declare no conflict of interest.
Figures
Similar articles
-
Neurite outgrowth in human induced pluripotent stem cell-derived neurons as a high-throughput screen for developmental neurotoxicity or neurotoxicity.Neurotoxicology. 2016 Mar;53:271-281. doi: 10.1016/j.neuro.2016.02.003. Epub 2016 Feb 4. Neurotoxicology. 2016. PMID: 26854185
-
Rotenone exerts developmental neurotoxicity in a human brain spheroid model.Toxicol Appl Pharmacol. 2018 Sep 1;354:101-114. doi: 10.1016/j.taap.2018.02.003. Epub 2018 Feb 8. Toxicol Appl Pharmacol. 2018. PMID: 29428530 Free PMC article.
-
Establishment of human pluripotent stem cell-derived cortical neurosphere model to study pathomechanisms and chemical toxicity in Kleefstra syndrome.Sci Rep. 2024 Sep 29;14(1):22572. doi: 10.1038/s41598-024-72791-4. Sci Rep. 2024. PMID: 39343771 Free PMC article.
-
In vitro acute and developmental neurotoxicity screening: an overview of cellular platforms and high-throughput technical possibilities.Arch Toxicol. 2017 Jan;91(1):1-33. doi: 10.1007/s00204-016-1805-9. Epub 2016 Aug 4. Arch Toxicol. 2017. PMID: 27492622 Review.
-
Stem Cells in Neurotoxicology/Developmental Neurotoxicology: Current Scenario and Future Prospects.Mol Neurobiol. 2016 Dec;53(10):6938-6949. doi: 10.1007/s12035-015-9615-2. Epub 2015 Dec 14. Mol Neurobiol. 2016. PMID: 26666665 Review.
Cited by
-
Recent Advances in Monitoring Stem Cell Status and Differentiation Using Nano-Biosensing Technologies.Nanomaterials (Basel). 2022 Aug 25;12(17):2934. doi: 10.3390/nano12172934. Nanomaterials (Basel). 2022. PMID: 36079970 Free PMC article. Review.
-
Grafted human induced pluripotent stem cells improve the outcome of spinal cord injury: modulation of the lesion microenvironment.Sci Rep. 2020 Dec 29;10(1):22414. doi: 10.1038/s41598-020-79846-2. Sci Rep. 2020. PMID: 33376249 Free PMC article.
-
Heparin Protects Human Neural Progenitor Cells from Zika Virus-Induced Cell Death While Preserving Their Differentiation into Mature Neuroglial Cells.J Virol. 2022 Oct 12;96(19):e0112222. doi: 10.1128/jvi.01122-22. Epub 2022 Sep 19. J Virol. 2022. PMID: 36121298 Free PMC article.
-
Multiscale Analysis of Cellular Composition and Morphology in Intact Cerebral Organoids.Biology (Basel). 2022 Aug 26;11(9):1270. doi: 10.3390/biology11091270. Biology (Basel). 2022. PMID: 36138749 Free PMC article.
-
Methamphetamine exposure drives cell cycle exit and aberrant differentiation in rat hippocampal-derived neurospheres.Front Pharmacol. 2023 Sep 19;14:1242109. doi: 10.3389/fphar.2023.1242109. eCollection 2023. Front Pharmacol. 2023. PMID: 37795025 Free PMC article.
References
-
- Krewski D., Acosta D., Jr., Andersen M., Anderson H., Bailar J.C., 3rd, Boekelheide K., Brent R., Charnley G., Cheung V.G., Green S., Jr., et al. Toxicity testing in the 21st century: A vision and a strategy. J. Toxicol. Environ. Health Part B Crit. Rev. 2010;13:51–138. doi: 10.1080/10937404.2010.483176. - DOI - PMC - PubMed
-
- Bal-Price A., Crofton K.M., Leist M., Allen S., Arand M., Buetler T., Delrue N., FitzGerald R.E., Hartung T., Heinonen T., et al. International STakeholder NETwork (ISTNET): Creating a developmental neurotoxicity (DNT) testing road map for regulatory purposes. Arch. Toxicol. 2015;89:269–287. doi: 10.1007/s00204-015-1464-2. - DOI - PMC - PubMed
Publication types
MeSH terms
Substances
LinkOut - more resources
Full Text Sources
Other Literature Sources
Research Materials
