. 2020 May 2;9(5):1128.
doi: 10.3390/cells9051128.

Functional Consequences of the Variable Stoichiometry of the Kv1.3-KCNE4 Complex

Affiliations

Functional Consequences of the Variable Stoichiometry of the Kv1.3-KCNE4 Complex

Laura Solé et al. Cells. .

Abstract

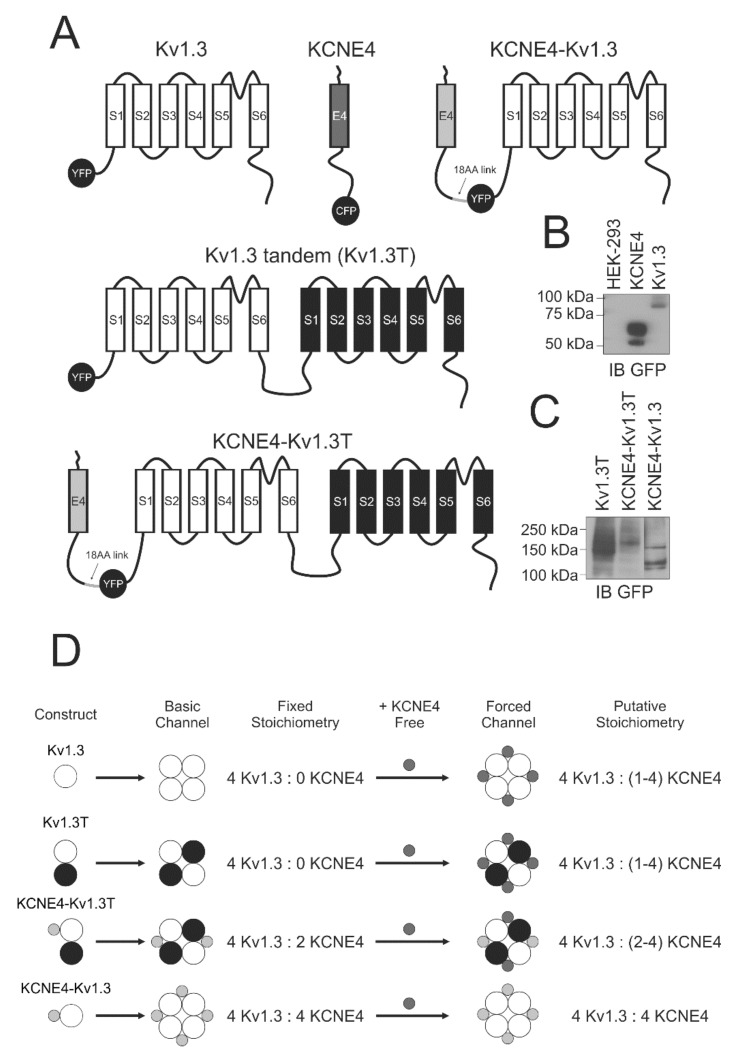
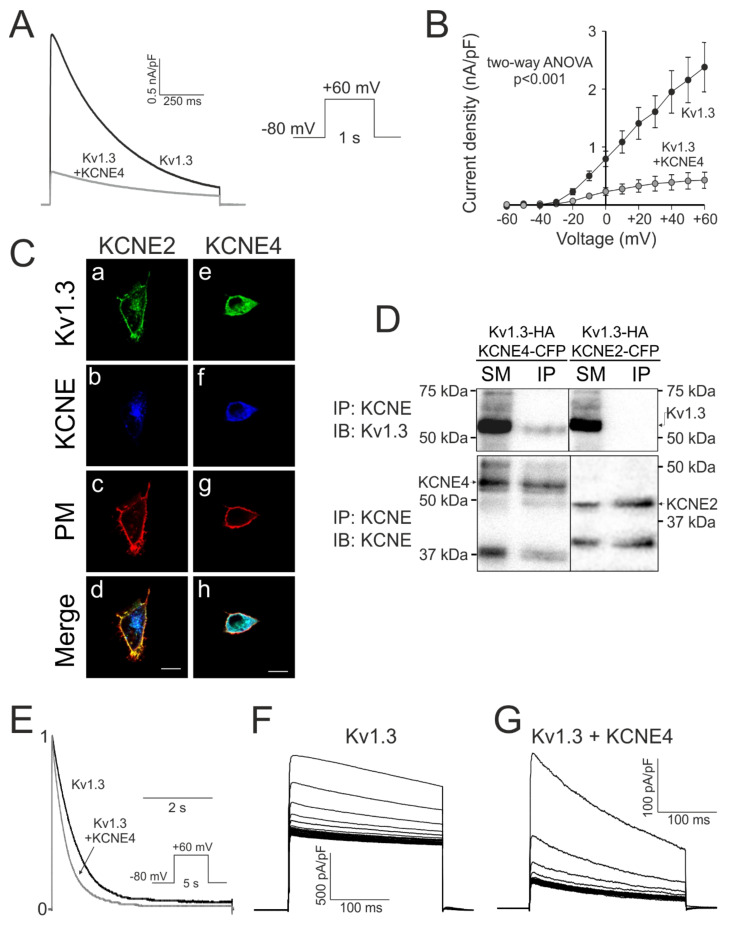
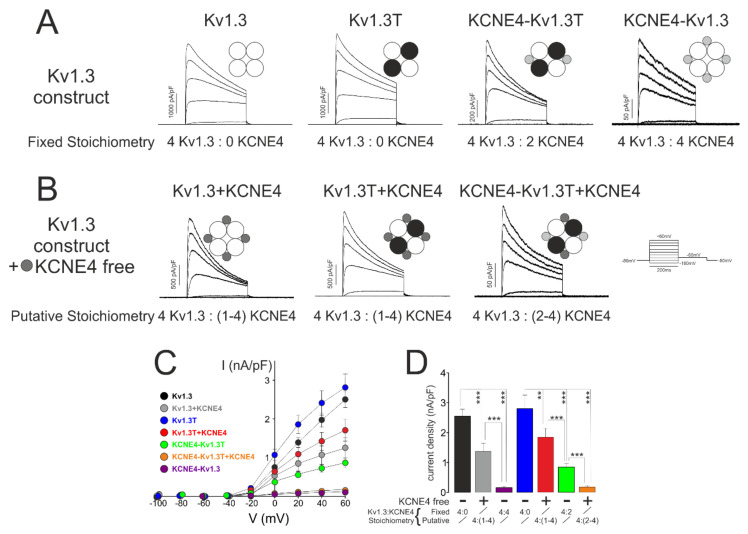
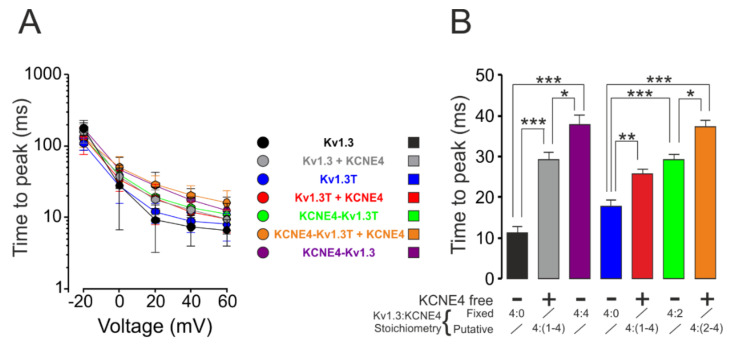
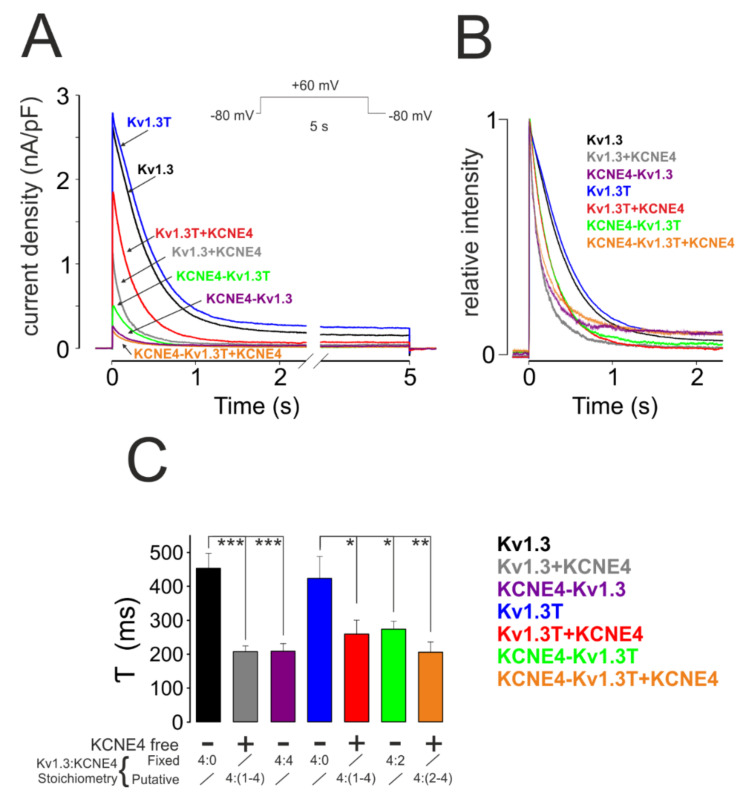
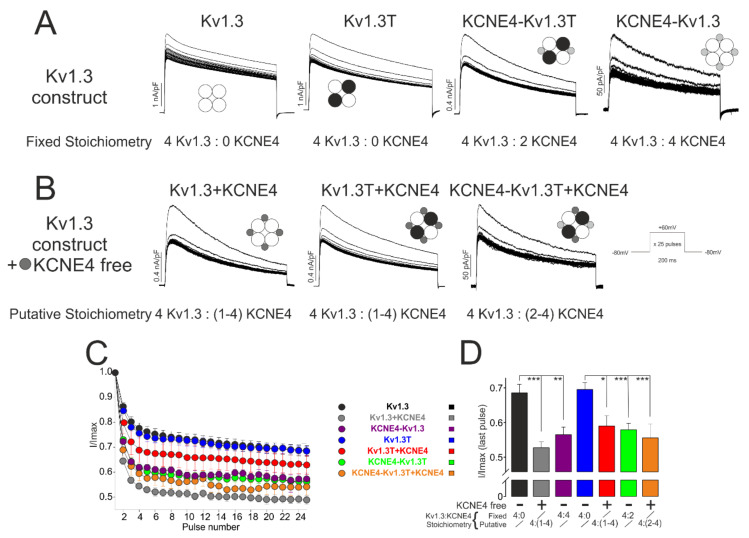
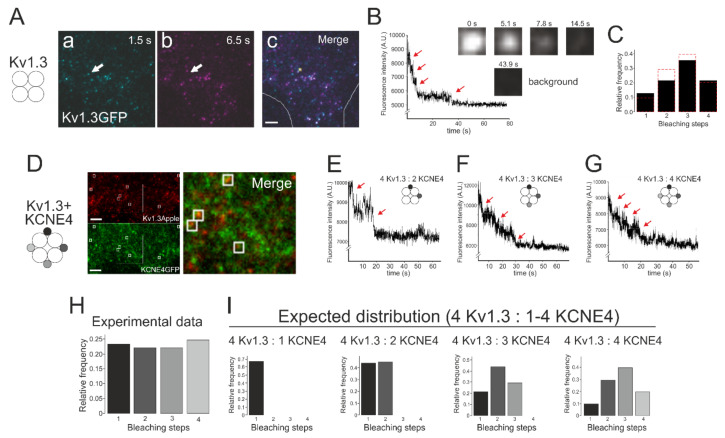
The voltage-gated potassium channel Kv1.3 plays a crucial role during the immune response. The channel forms oligomeric complexes by associating with several modulatory subunits. KCNE4, one of the five members of the KCNE family, binds to Kv1.3, altering channel activity and membrane expression. The association of KCNEs with Kv channels is the subject of numerous studies, and the stoichiometry of such associations has led to an ongoing debate. The number of KCNE4 subunits that can interact and modulate Kv1.3 is unknown. KCNE4 transfers important elements to the Kv1.3 channelosome that negatively regulate channel function, thereby fine-tuning leukocyte physiology. The aim of this study was to determine the stoichiometry of the functional Kv1.3-KCNE4 complex. We demonstrate that as many as four KCNE4 subunits can bind to the same Kv1.3 channel, indicating a variable Kv1.3-KCNE4 stoichiometry. While increasing the number of KCNE4 subunits steadily slowed the activation of the channel and decreased the abundance of Kv1.3 at the cell surface, the presence of a single KCNE4 peptide was sufficient for the cooperative enhancement of the inactivating function of the channel. This variable architecture, which depends on KCNE4 availability, differentially affects Kv1.3 function. Therefore, our data indicate that the physiological remodeling of KCNE4 triggers functional consequences for Kv1.3, thus affecting cell physiology.

Keywords: immune system; oligomeric complex; potassium channels; regulatory subunits.


Conflict of interest statement

The authors declare no conflicts of interest with the contents of this article.

Figures

Figure 1
Figure 1
Chimeric constructs, protein expression and putative oligomeric formations. (A) Representative cartoon of the fusion proteins. All chimeras were tagged with either YFP or CFP. White and black barrels represent Kv1.3 peptides. Dark and light gray correspond to KCNE4 structures. In KCNE4-Kv1.3 and KCNE4-Kv1.3T, the 18 aa link is also indicated. (B) Western blot of the protein lysates of the nontransfected HEK-293 cells and HEK-293 cells transfected with KCNE4 and Kv1.3. (C) Protein levels of cells expressing Kv1.3T, KCNE4-Kv1.3T and KCNE4-Kv1.3. (D) Putative oligomerization of Kv1.3 and KCNE4 complexes according to the construct combination. Basic channels formed by chimeras exhibited fixed stoichiometries. The addition of free KCNE4 units yielded forced channels with putative stoichiometries. 1–4, the number of KCNE units by complex, which varied from 1 to 4. 2–4, the number of KCNE units by complex, which varied from 2 to 4. White and black circles represent Kv1.3 peptides. Light gray corresponds to KCNE4 chimeras linked to Kv1.3. Dark gray highlights excess KCNE4 units.
Figure 2
Figure 2
KCNE4 specifically modulates Kv1.3. HEK-293 cells were transfected with Kv1.3-YFP in the presence (+KCNE4) or the absence of KCNE4-CFP. Cells were held at −80 mV, and currents were elicited by 1 s depolarizing pulses from −60 mV to +60 mV in 10 mV intervals. (A) Representative traces at +60 mV. (B) Current density vs. the voltage of K+ currents (p < 0.001 vs. +KCNE4, two-way ANOVA; n = 3–5). Values are the means ± SE. Black symbols, Kv1.3; gray symbols, Kv1.3 + KCNE4. (C) Confocal images of HEK-293 cells cotransfected with Kv1.3-YFP and KCNE2-CFP (Ca-Cd) and KCNE4-CFP (Ce-Ch). (a, e) Green, Kv1.3; (b, f) blue, KCNE; (c, g) red, plasma membrane marker (PM); (d, h) merged images. White, triple localization; yellow, double green and red colocalization. (D) Coimmunoprecipitation of KCNE4, but not KCNE2, with Kv1.3. HEK-293 cells were cotransfected with Kv1.3-HA and KCNE2-CFP and KCNE4-CFP. Samples were immunoprecipitated (IP) against KCNE (anti-CFP) and immunoblotted (IB) against Kv1.3 (anti-Kv1.3) and KCNE (anti-GFP). SM, starting materials; IP, immunoprecipitates. (E) C-type inactivation. Cells expressing Kv1.3 without or with +KCNE4 were held at −80 mV, and a 5 s depolarizing pulse to +60 mV was applied. Black, Kv1.3; gray, Kv1.3 + KCNE4. (F) Cumulative inactivation of HEK-293 cells transfected with Kv1.3. (G) Cumulative inactivation of HEK-293 cells cotransfected with Kv1.3 and KCNE4. Cells were held at −80 mV, and a train of thirty 200 ms pulses to −60 mV was applied.
Figure 3
Figure 3
Current density versus voltage of K+ currents. HEK-293 cells were transfected with different Kv1.3-KCNE4 constructs, and the K+ currents were analyzed. Cells were clamped at −80 mV, and current traces were elicited by 200 ms pulses from −100 mV to +60 mV in 20 mV increments. (A) Representative traces from chimeras with fixed Kv1.3-KCNE4 stoichiometry. Kv1.3 (4:0), Kv1.3T (4:0), KCNE4:Kv1.3T (4:2), and KCNE4:Kv1.3 (4:4). (B) Representative traces from functional complexes with putative Kv1.3-KCNE4 stoichiometries due to the addition of excess free KCNE4 units to Kv1.3-KCNE4 chimeras. Kv1.3 + KCNE4: Kv1.3 in the presence of KCNE4 (4:(1–4)). Kv1.3T + KCNE4: Kv1.3T in the presence of KCNE4 (4:(1–4)). KCNE4-Kv1.3T + KCNE4: KCNE4-Kv1.3T in the presence of KCNE4 (4:(2–4)). (C) Current density (pA/pF) plotted against voltage (mV). (D) Peak current densities, at +60 mV, of different combinations without or with + KCNE4 and free KCNE4 added. Values are the means ± SE of 8–14 cells; ** p < 0.01, and *** p < 0.001 (one-way ANOVA, post-hoc Tukey’s test). Symbols: black, Kv1.3; gray, Kv1.3 + KCNE4; purple, KCNE4-Kv1.3; blue, Kv1.3T; red, Kv1.3T + KCNE4; green, KCNE4-Kv1.3T; and orange, KCNE4-Kv1.3T + KCNE4.
Figure 4
Figure 4
Analysis of Kv1.3 activation kinetics. HEK-293 cells were transfected with different Kv1.3-KCNE4 chimeras with (+) or without (-) free KCNE4. Different combinations yielded fixed or putative Kv1.3:KCNE4 stoichiometries. Cells were held at −80 mV, and current traces were elicited by 200 ms pulses from −100 mV to +60 mV in 20 mV increments. Peak currents from −20 mV to +60 mV were calculated. (A) Time to reach the peak current in the open channels from −20 mV to +60 mV. The time scale is presented in log values for easier viewing. (B) Time to peak at 0 mV. Values are the means ± SE of 8–14 cells; * p < 0.05, ** p < 0.01, and *** p < 0.001 (one-way ANOVA with Tukey’s post-hoc test). Symbols: black, Kv1.3; gray, Kv1.3 + KCNE4; purple, KCNE4-Kv1.3; blue, Kv1.3T; red, Kv1.3T+KCNE4; green, KCNE4-Kv1.3T; and orange, KCNE4-Kv1.3T + KCNE4.
Figure 5
Figure 5
Analysis of C-type inactivation. HEK-293 cells were transfected with different Kv1.3-KCNE4 chimeras with (+) or without (−) free KCNE4. Different combinations yielded fixed and putative Kv1.3:KCNE4 stoichiometries. (A) Representative traces from C-type inactivation recordings. An initial 100 ms pulse at −80 mV was applied prior to a 5 s depolarizing pulse at + 60 mV. (B) Relative intensity of voltage-dependent K+ currents from all combinations during the first 2 s. (C) The constant (τ) of inactivation (in ms) of all groups. Values are the means ± SE, n = 8–14; * p < 0.05, ** p < 0.01, and *** p < 0.001 (Student’s t-test). Kv1.3 (black); Kv1.3 + KCNE4 (gray); KCNE4-Kv1.3 (purple); Kv1.3T (blue); Kv1.3T + KCNE4 (red); KCNE4-Kv1.3T (green); and KCNE4-Kv1.3T + KCNE4 (orange).
Figure 6
Figure 6
Analysis of the cumulative inactivation. HEK-293 cells were transfected with different Kv1.3-KCNE4 constructs, and K+ currents were analyzed. (A) Chimeras with fixed Kv1.3-KCNE4 stoichiometry. Kv1.3 (4:0), Kv1.3T (4:0), KCNE4:Kv1.3T (4:2), KCNE4:Kv1.3 (4:4). (B) Functional complexes with putative Kv1.3-KCNE4 stoichiometries due to further addition of extra free KCNE4 units. Kv1.3 + KCNE4: Kv1.3 in the presence of KCNE4 (4:(1–4)). Kv1.3T + KCNE4: Kv1.3T in the presence of KCNE4 (4:(1–4)). KCNE4-Kv1.3T + KCNE4: KCNE4-Kv1.3T in the presence of KCNE4 (4:(2–4)). Cells were held at −80 mV, and a train of 25 depolarizing pulses to +60 mV for 200 ms was applied. (C) I/Imax vs. the pulse number. The ratio of the peak current amplitude during each pulse relative to that during the 1st pulse (I/Imax) was plotted against every pulse. (D) I/Imax reached at the last pulse train of depolarization. * p < 0.05, ** p < 0.01, and *** p < 0.001 (Student’s t-test). Values are the means ± SE of n = 10–15. Kv1.3 (black); Kv1.3 + KCNE4 (gray); KCNE4-Kv1.3 (purple); Kv1.3T (blue); Kv1.3T + KCNE4 (red); KCNE4-Kv1.3T (green); and KCNE4-Kv1.3T + KCNE4 (orange).
Figure 7
Figure 7
GFP bleaching steps from HEK-293 cells transfected with Kv1.3 in the absence or presence of KCNE4. (AC) Cells were transfected with Kv1.3-loopBAD-GFP. (A) Representative 1.5 s and 6.5 s time-lapse snapshots from the TIRFM video (488 nm laser). White arrow heads (a, b) point to the yellow square ROI (6 × 6 pixels) in panel c. (a) Initial fluorescence intensity; (b) fluorescence intensity after the first bleaching step at the same spot; (c) merge image. Yellow square indicates the ROI. The white line delineates the cell shape. Scale bar, 5 μm. (B) Representative graph of the bleaching steps for the different spots analyzed. Red arrows point to 4 bleaching steps. Squares, at the right, represent the fluorescence intensity after 4 consecutive bleaching steps at the same ROI. 0 s, initial fluorescence; 43.9 s, background intensity remaining after 4 consecutive bleaching steps. (C) Relative frequency of 1–4 bleaching events counted per spot. The black bars correspond to the experimental frequencies observed. Red dashed lines correspond to the theoretical distributions of bleaching steps with p = 0.67. (DG) GFP bleaching steps from HEK-293 cells transfected with KCNE4-loopBAD-GFP and Kv1.3-Apple. (D) Representative snapshots from a cropped TIRF microscopy video. Upper panel (561 nm laser): Kv1.3-Apple. Lower panel (488 nm laser): KCNE4-loop-BADGFP. Merge panel zooms squares from previous panels. White squares ROIs (6 × 6 pixels) indicate colocalizing stationary spots. Putative oligomeric composition of the Kv1.3/KCNE4 complex is represented with circles at the left. While 4 white circles indicate the Kv1.3 tetramer, KCNE4 units are represented with gray and black circles. (EG) Representative graph of the GFP bleaching steps from the different spots analyzed. (E) Two bleaching steps indicating a 4:2 Kv1.3:KCNE4 stoichiometry. (F) Three bleaching steps suggesting a 4:3 Kv1.3:KCNE4 ratio. (G) Four bleaching steps highlighting a 4:4 Kv1.3:KCNE4 stoichiometry. (H) Histogram with the relative frequency of 1–4 bleaching events counted for spot. Bars correspond to the experimental frequencies observed. (I) Histograms representing the theoretical distribution of the bleaching events when KCNE4 is present at the Kv1.3/KCNE4 complex as a monomer (4:1 stoichiometry), dimer (4:2), trimer (4:3) or tetramer (4:4) with p = 0.67. In contrast to the functional Kv1.3 tetramers (C), no expected KCNE4 distribution fit with the distribution observed during the analysis of the experimental data.

Similar articles

Cited by

References

    1. Chandy K.G., Norton R.S. Peptide blockers of Kv1.3 channels in T cells as therapeutics for autoimmune disease. Curr. Opin. Chem. Biol. 2017;38:97–107. doi: 10.1016/j.cbpa.2017.02.015. - DOI - PubMed
    1. Perez-Verdaguer M., Capera J., Serrano-Novillo C., Estadella I., Sastre D., Felipe A. The voltage-gated potassium channel Kv1.3 is a promising multitherapeutic target against human pathologies. Expert Opin. Ther. Targets. 2016;20:577–591. doi: 10.1517/14728222.2016.1112792. - DOI - PubMed
    1. Serrano-Albarras A., Cirera-Rocosa S., Sastre D., Estadella I., Felipe A. Fighting rheumatoid arthritis: Kv1.3 as a therapeutic target. Biochem. Pharmacol. 2019;165:214–220. doi: 10.1016/j.bcp.2019.03.016. - DOI - PubMed
    1. Wulff H., Christophersen P., Colussi P., Chandy K.G., Yarov-Yarovoy V. Antibodies and venom peptides: New modalities for ion channels. Nat. Rev. Drug Discov. 2019;18:339–357. doi: 10.1038/s41573-019-0013-8. - DOI - PMC - PubMed
    1. Vicente R., Escalada A., Villalonga N., Texido L., Roura-Ferrer M., Martin-Satue M., Lopez-Iglesias C., Soler C., Solsona C., Tamkun M.M., et al. Association of Kv1.5 and Kv1.3 contributes to the major voltage-dependent K+ channel in macrophages. J. Biol. Chem. 2006;281:37675–37685. doi: 10.1074/jbc.M605617200. - DOI - PubMed

Publication types

Substances