. 2020 May 22;23(5):101080.
doi: 10.1016/j.isci.2020.101080. Epub 2020 Apr 22.

An Unsupervised Strategy for Identifying Epithelial-Mesenchymal Transition State Metrics in Breast Cancer and Melanoma

Affiliations

An Unsupervised Strategy for Identifying Epithelial-Mesenchymal Transition State Metrics in Breast Cancer and Melanoma

David J Klinke 2nd et al. iScience. .

Abstract

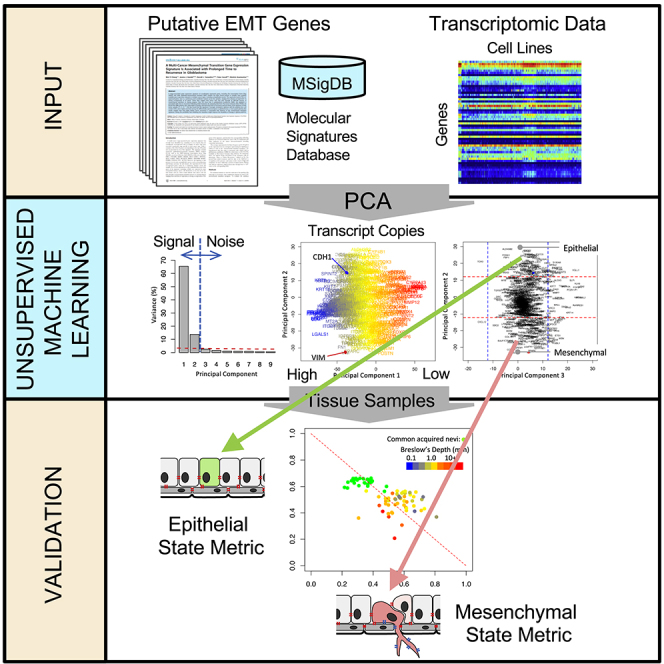
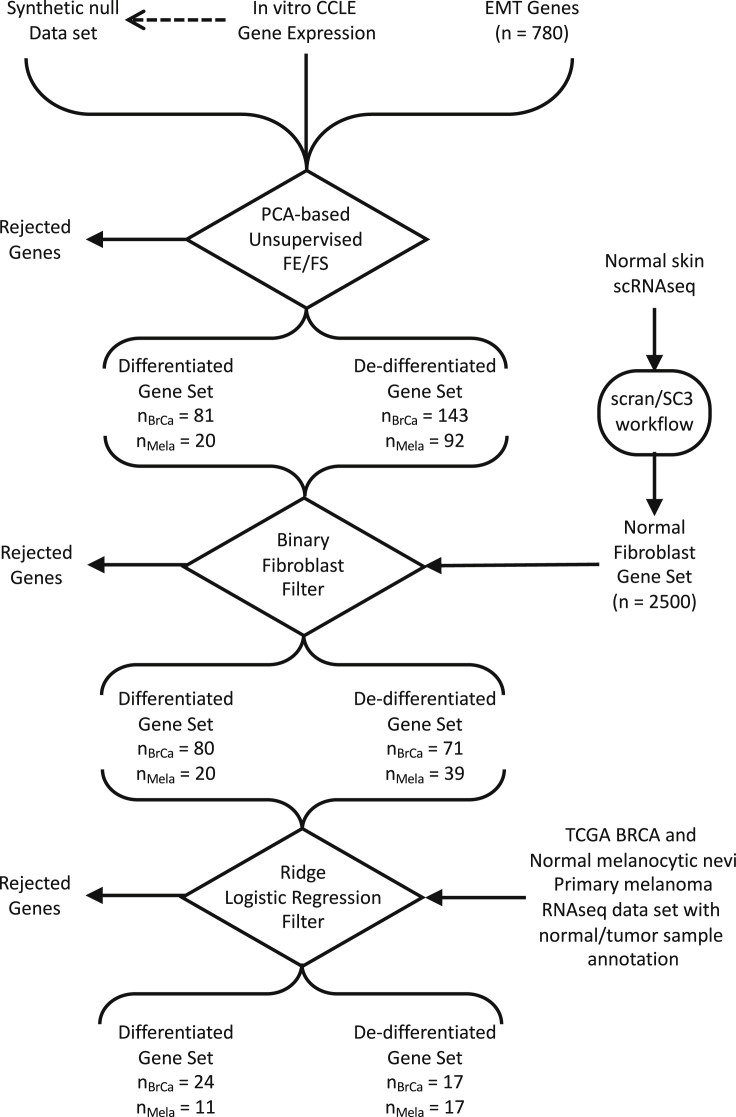
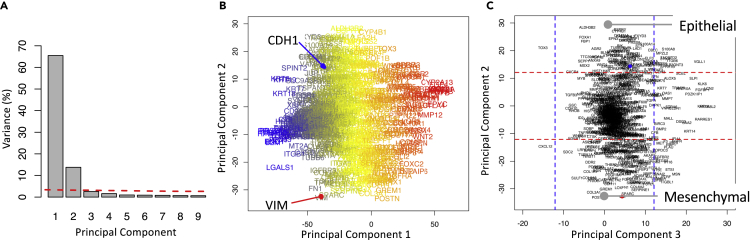
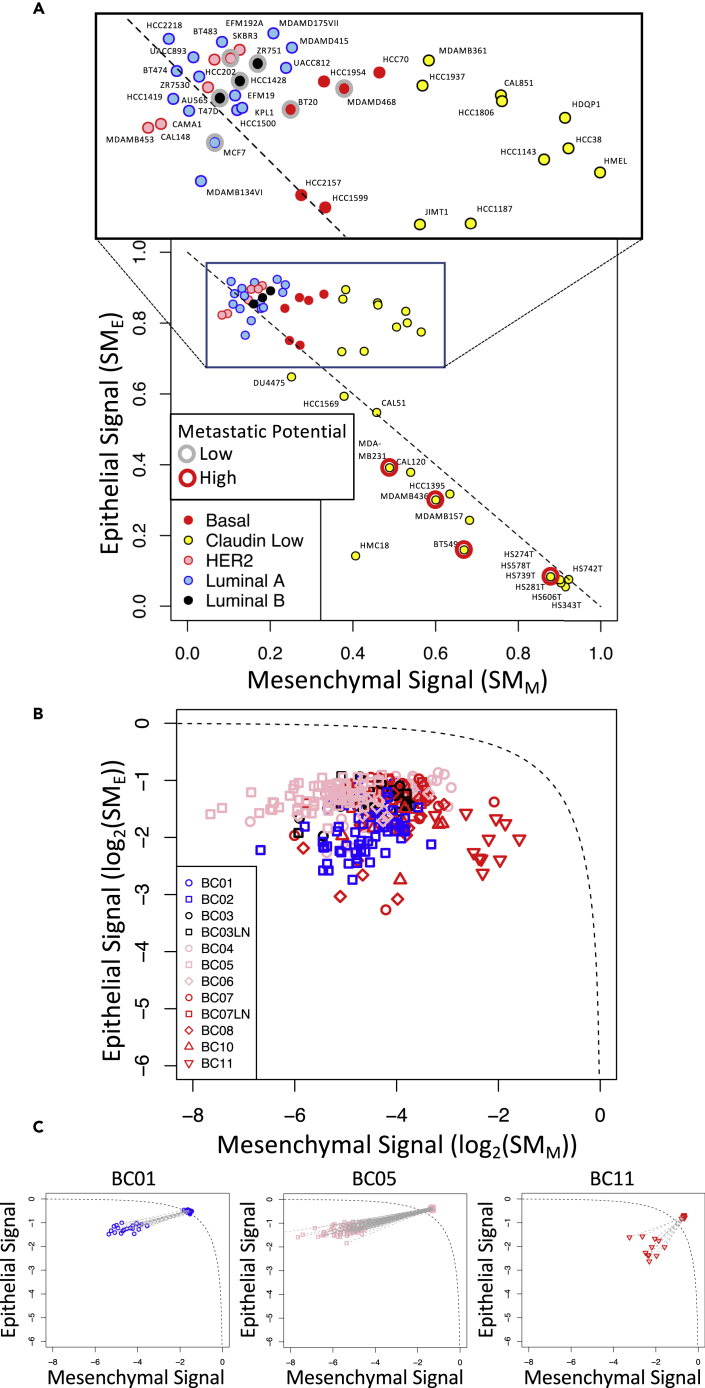
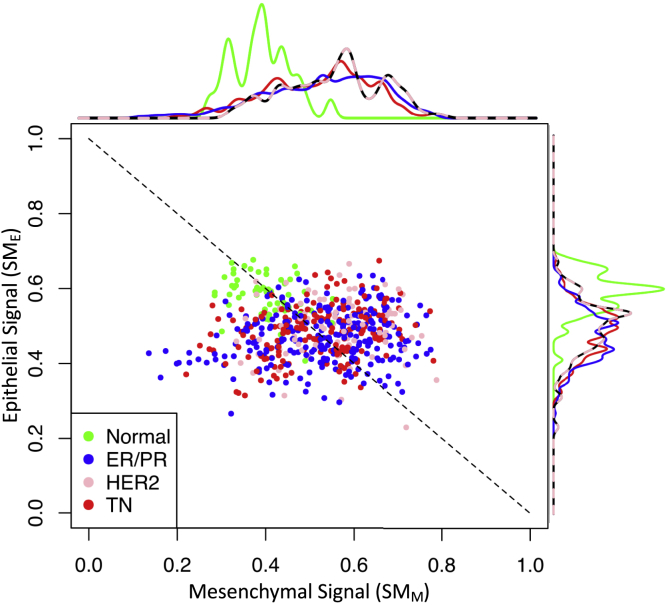
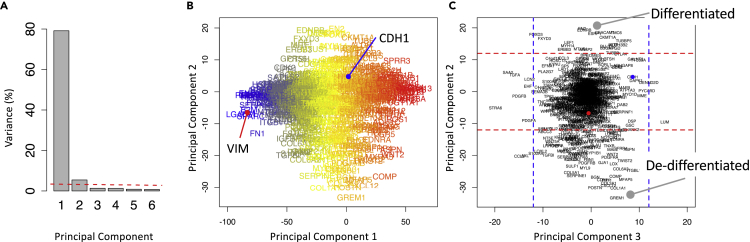
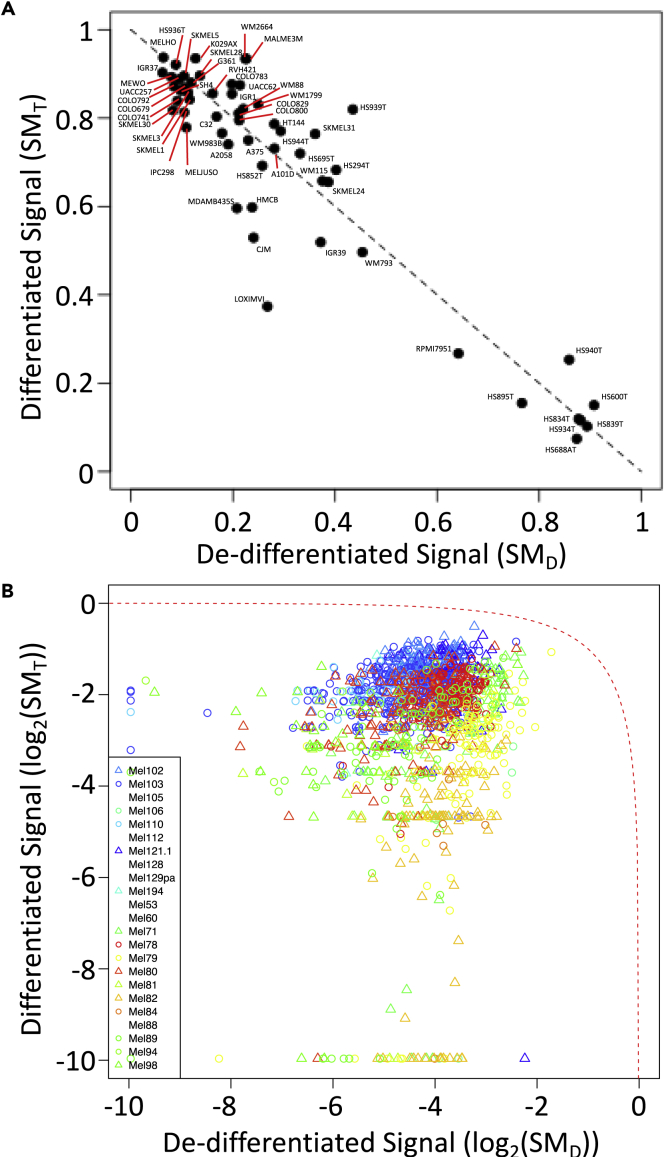
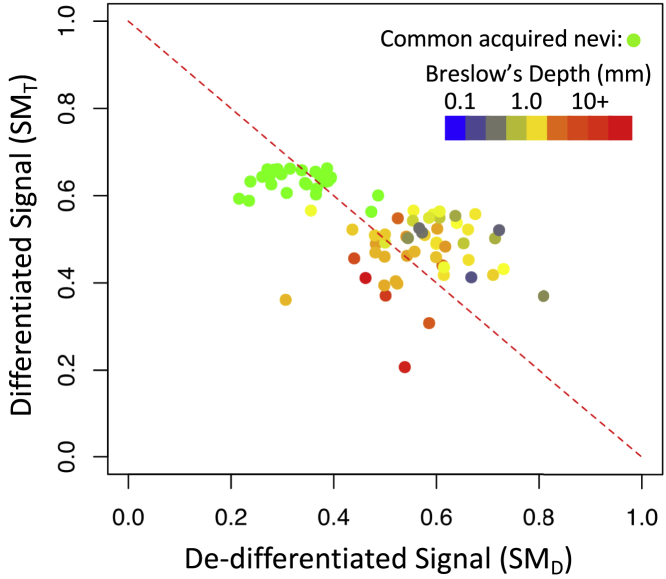
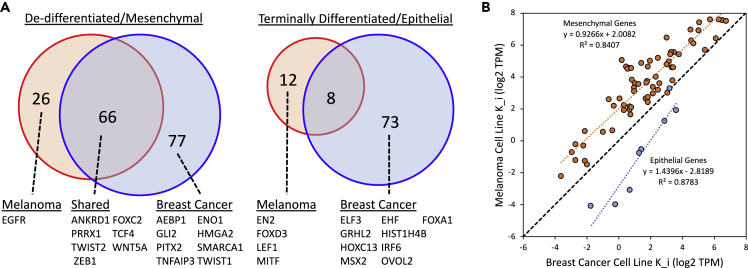
Digital cytometry aims to identify different cell types in the tumor microenvironment, with the current focus on immune cells. Yet, identifying how changes in tumor cell phenotype, such as the epithelial-mesenchymal transition, influence the immune contexture is emerging as an important question. To extend digital cytometry, we developed an unsupervised feature extraction and selection strategy to capture functional plasticity tailored to breast cancer and melanoma separately. Specifically, principal component analysis coupled with resampling helped develop gene expression-based state metrics that characterize differentiation within an epithelial to mesenchymal-like state space and independently correlate with metastatic potential. First developed using cell lines, the orthogonal state metrics were refined to exclude the contributions of normal fibroblasts and provide tissue-level state estimates using bulk tissue RNA-seq measures. The resulting metrics for differentiation state aim to inform a more holistic view of how the malignant cell phenotype influences the immune contexture within the tumor microenvironment.

Keywords: Bioinformatics; Cancer; Stem Cells Research.


Conflict of interest statement

Declaration of Interests The authors declare no competing financial interests.

Figures

None
Graphical abstract
Figure 1
Figure 1
Comparison of Gene Expression within the Same Samples Assayed using RNA Sequencing and Oligonucleotide Microarray Heatmaps for the expression of a subset of genes in the breast cancer arm of the TCGA study assayed using Illumina RNA-seq (A) and using Agilent microarray (B). Color bar shown at the bottom of the heatmaps indicates samples obtained from tumor tissue (black) versus matched normal tissue (yellow). The genes and samples are similarly ordered in both panels. Values were log2 normalized.
Figure 2
Figure 2
RPPA Measurements Were Used to Determine a Threshold for Biologically Significant Changes in Gene Expression (A and B) The model for protein dependence on gene expression (A) where representative data (black circles) and model fits (dotted black line) are shown for CLDN7, AXL, JAG1, and CDH1 (B). (C) The distribution in threshold values calculated for all genes assayed by RNA-seq (black curve, n = 99) and by Affymetrix microarray (red curve, n = 149) meeting the inclusion criteria. Transcript abundance units for RNA-seq corresponds to TPM and intensity units (I.U.) for Affymetrix microarray. In (B), the vertical red dotted line indicates the threshold value and the melanoma and breast cancer cell lines are highlighted by red and blue circles.
Figure 3
Figure 3
Data Workflow for Identifying Epithelial/Differentiated versus Mesenchymal/De-differentiated State Metrics Workflow contains three decision points: unsupervised feature extraction (FE)/feature selection (FS) based on PCA, a binary fibroblast filter, and a consistency filter based on Ridge logistic regression of annotated samples.
Figure 4
Figure 4
Two Opposing Gene Signatures Were Identified among the Cohort of Breast Cancer Cell Lines (A) Scree plot of the percentage of variance explained by each principal component, where the dotted line corresponds to variance explained by the null principal components. (B) Projection of the genes along PC1 and PC2 axes, where the font color corresponds to the mean read counts among cell lines (blue-yellow-red corresponds to high-medium-low read counts). (C) Projection of the genes along PC2 and PC3 axes, where the dotted lines enclose 95% of the null PCA distribution along the corresponding axis.
Figure 5
Figure 5
The Different Subsets of Breast Cancer Were Clustered Along a Reciprocal Epithelial to Mesenchymal State Axes (A and B) Log2 projections along the epithelial (SME) and mesenchymal (SMM) state axes for each breast cancer cell line included in the CCLE (A) and primary breast cancer cells (B and C). Values for SME and SMM were estimated by bulk RNA-seq data for cell lines associated with the CCLE and by scRNA-seq data for primary tumor cells (Chung et al., 2017). (C) Log2 state projections are compared for primary breast cancer cells as originally reported and with dropout values imputed using the values averaged over the rest of the sample population, where gray lines connect the original state values to state values determine after imputation. Symbols were colored based on previously annotated breast cancer PAM50 subtypes: basal, red; claudin low, yellow; HER2, pink; luminal (A), blue; luminal (B), black. In (A), the metastatic potential of a subset of cell lines was annotated based on a recent study (Yankaskas et al., 2019): low metastatic potential, gray circle; high metastatic potential, red circle. The dotted line corresponds to a reciprocal relationship between the SME and SMM state metrics (i.e., SME = 1 - SMM).
Figure 6
Figure 6
The Samples from Normal Breast Tissue and Breast Cancer Were Clustered Separately Along a Reciprocal Epithelial to Mesenchymal State Axes Using EMT genes that passed the gene filter workflow, each sample contained within the breast cancer (BrCa) arm of the TCGA was projected along the epithelial (SME) versus mesenchymal (SMM) state axes using the corresponding bulk RNA-seq data. Symbols were colored based on normal breast tissue (green) or clinical breast cancer subtype: ER/PR +, blue; HER2, pink; triple negative (TN), red. The dotted line corresponds to a reciprocal relationship between the SME and SMM state metrics (i.e., SME = 1 - SMM).
Figure 7
Figure 7
Two Opposing Gene Signatures Were Identified among the Cohort of Melanoma Cell Lines (A) Scree plot of the percentage of variance explained by each principal component, where the dotted line corresponds to variance explained by the null principal components. (B) Projection of the genes along PC1 and PC2 axes, where the font color corresponds to the mean read counts among cell lines (blue-yellow-red corresponds to high-medium-low read counts). (C) Projection of the genes along PC2 and PC3 axes, where the dotted lines enclose 95% of the null PCA distribution along the corresponding axis.
Figure 8
Figure 8
Melanoma Cell Lines and Primary Single Melanoma Cells Are Distributed Along Path between Extremes in Differentiation States Projections along the terminally differentiated (SMT) versus de-differentiated (SMD) state axes for each melanoma cell line included in the CCLE (A) and primary melanoma cells (B). Values for the terminally differentiated and de-differentiated state metrics were estimated by RNA-seq data for cell lines associated with the CCLE and by scRNA-seq data for primary melanoma cells. Symbols for primary melanoma cells were colored differently for each patient sample. The dotted line corresponds to a reciprocal relationship between the SMT and SMD state metrics (i.e., SMT = 1 - SMD).
Figure 9
Figure 9
Gene Expression Patterns Associated with Benign Melanocytic Nevi and Primary Melanoma Tissue Samples Are Distributed Along Path between Extremes in Differentiation States Projections along the terminally differentiated (SMT) versus de-differentiated (SMD) state axes for 78 tissue samples obtained from common acquired melanocytic nevi (n = 27, green circles) and primary melanoma (n = 51). The primary melanoma samples are colored based on the Breslow's depth (blue: 0.1 mm to red: 10+ mm). The dotted line corresponds to a reciprocal relationship between the SMT and SMD state metrics (i.e., SMT = 1 - SMD).
Figure 10
Figure 10
A Comparison of the Genes Included in the Different State Metrics across Cancers (A) Venn diagram illustrating overlap in genes contained in the opposing state metrics for terminally differentiated/epithelial versus de-differentiated/mesenchymal extracted from breast cancer (blue circle) and melanoma (red circle) cell lines. The subset of the genes listed below the Venn diagram were annotated with transcription factor GO terms. (B) A biplot of the Ki values for the overlapping genes in the terminally differentiated/epithelial state metrics (blue circles and blue linear trendline) and in the de-differentiated/mesenchymal state metrics (orange circles and orange linear trendline). A 1:1 correspondence is represented by the black dotted line.

Similar articles

Cited by

References

    1. Alon U. volume 10. Chapman & Hall/CRC; 2007. An introduction to systems biology: design principles of biological circuits; pp. 97–104. (Chapman & Hall/CRC Mathematical and Computational Biology Series).
    1. Alonso S.R., Tracey L., Ortiz P., Perez-Gomez B., Palacios J., Pollan M., Linares J., Serrano S., Saez-Castillo A.I., Sanchez L. A high-throughput study in melanoma identifies epithelial-mesenchymal transition as a major determinant of metastasis. Cancer Res. 2007;67:3450–3460. - PubMed
    1. American Cancer Society . American Cancer Society; 2019. Cancer Facts & Figures 2019.
    1. Andrews T.S., Hemberg M. False signals induced by single-cell imputation [version 2; peer review: 4 approved] F1000Res. 2019;7:1740. - PMC - PubMed
    1. Balch C.M., Gershenwald J.E., Soong S.J., Thompson J.F., Atkins M.B., Byrd D.R., Buzaid A.C., Cochran A.J., Coit D.G., Ding S. Final version of 2009 AJCC melanoma staging and classification. J. Clin. Oncol. 2009;27:6199–6206. - PMC - PubMed

LinkOut - more resources