

Inferring Parameters of the Distribution of Fitness Effects of New Mutations When Beneficial Mutations Are Strongly Advantageous and Rare
- PMID: 32371451
- PMCID: PMC7341129
- DOI: 10.1534/g3.120.401052
Inferring Parameters of the Distribution of Fitness Effects of New Mutations When Beneficial Mutations Are Strongly Advantageous and Rare
Abstract
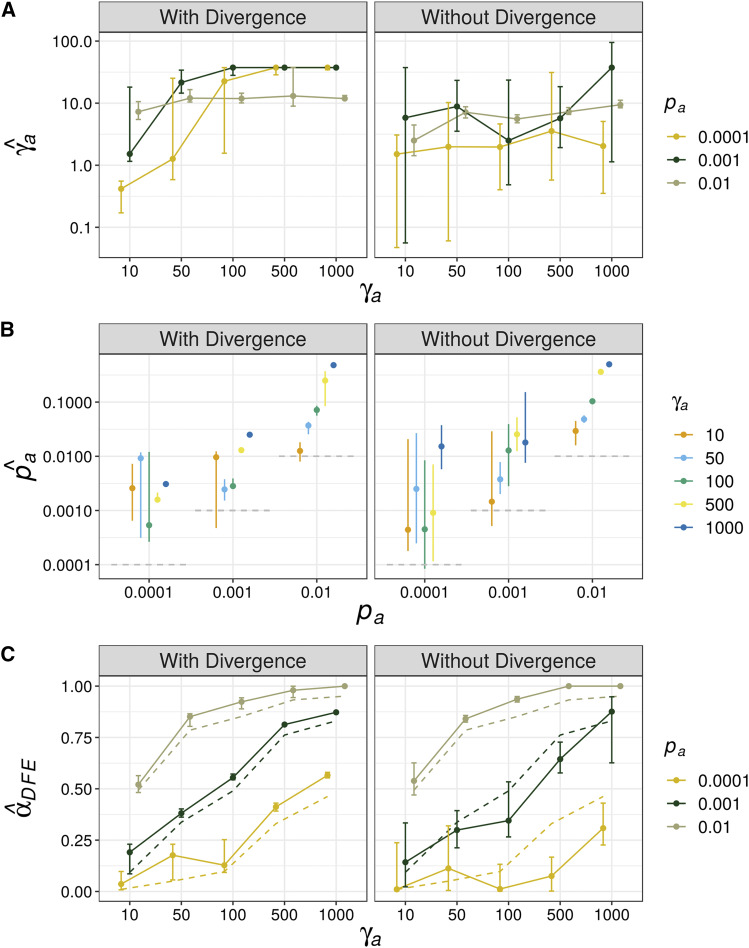
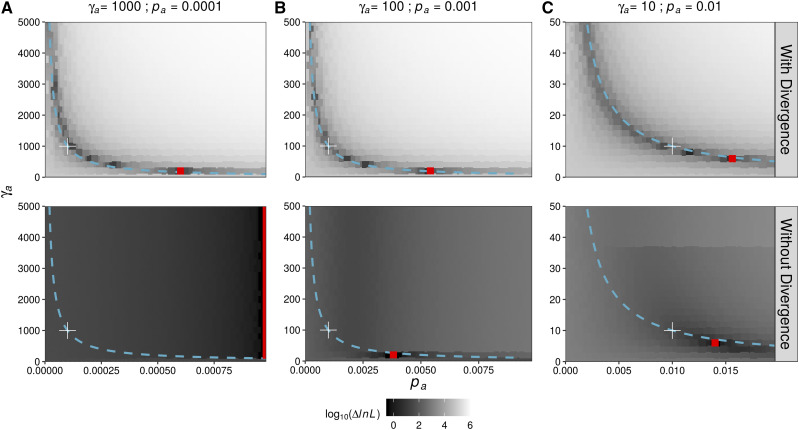
Characterizing the distribution of fitness effects (DFE) for new mutations is central in evolutionary genetics. Analysis of molecular data under the McDonald-Kreitman test has suggested that adaptive substitutions make a substantial contribution to between-species divergence. Methods have been proposed to estimate the parameters of the distribution of fitness effects for positively selected mutations from the unfolded site frequency spectrum (uSFS). Such methods perform well when beneficial mutations are mildly selected and frequent. However, when beneficial mutations are strongly selected and rare, they may make little contribution to standing variation and will thus be difficult to detect from the uSFS. In this study, I analyze uSFS data from simulated populations subject to advantageous mutations with effects on fitness ranging from mildly to strongly beneficial. As expected, frequent, mildly beneficial mutations contribute substantially to standing genetic variation and parameters are accurately recovered from the uSFS. However, when advantageous mutations are strongly selected and rare, there are very few segregating in populations at any one time. Fitting the uSFS in such cases leads to underestimates of the strength of positive selection and may lead researchers to false conclusions regarding the relative contribution adaptive mutations make to molecular evolution. Fortunately, the parameters for the distribution of fitness effects for harmful mutations are estimated with high accuracy and precision. The results from this study suggest that the parameters of positively selected mutations obtained by analysis of the uSFS should be treated with caution and that variability at linked sites should be used in conjunction with standing variability to estimate parameters of the distribution of fitness effects in the future.
Keywords: adaptation; beneficial mutations; distribution of fitness effects; population genetics.
Copyright © 2020 Booker.
Figures


References
-
- Bank C., Hietpas R. T., Wong A., Bolon D. N., and Jensen J. D., 2014. A Bayesian MCMC approach to assess the complete distribution of fitness effects of new mutations: uncovering the potential for adaptive walks in challenging environments. Genetics 196: 841–852. 10.1534/genetics.113.156190 - DOI - PMC - PubMed
MeSH terms
LinkOut - more resources
Full Text Sources