. 2020 May 19;117(20):11136-11146.
doi: 10.1073/pnas.1917174117. Epub 2020 May 5.

Essential role for autophagy protein ATG7 in the maintenance of intestinal stem cell integrity

Affiliations

Essential role for autophagy protein ATG7 in the maintenance of intestinal stem cell integrity

Coralie Trentesaux et al. Proc Natl Acad Sci U S A. .

Abstract

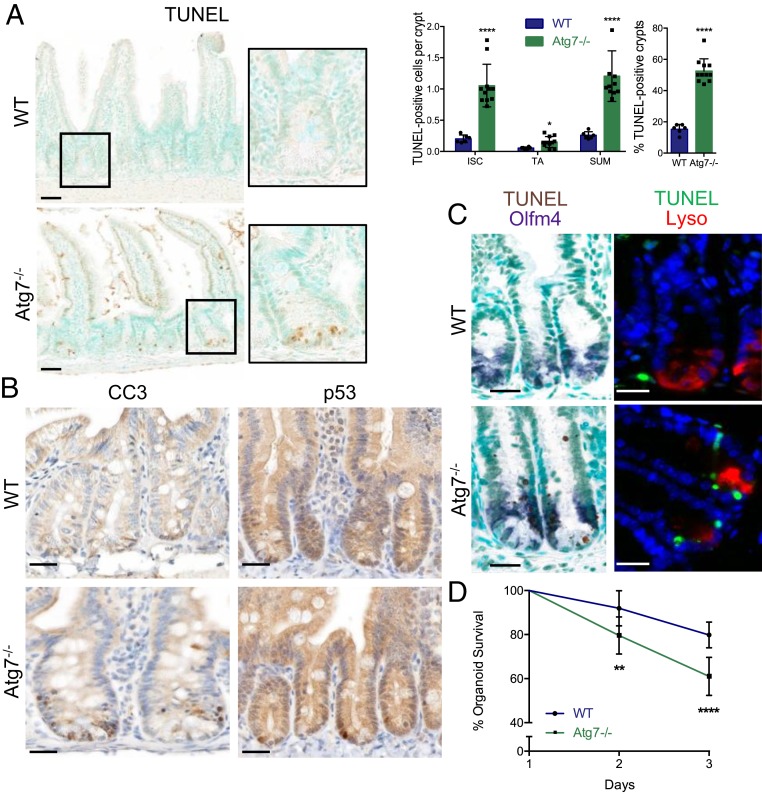
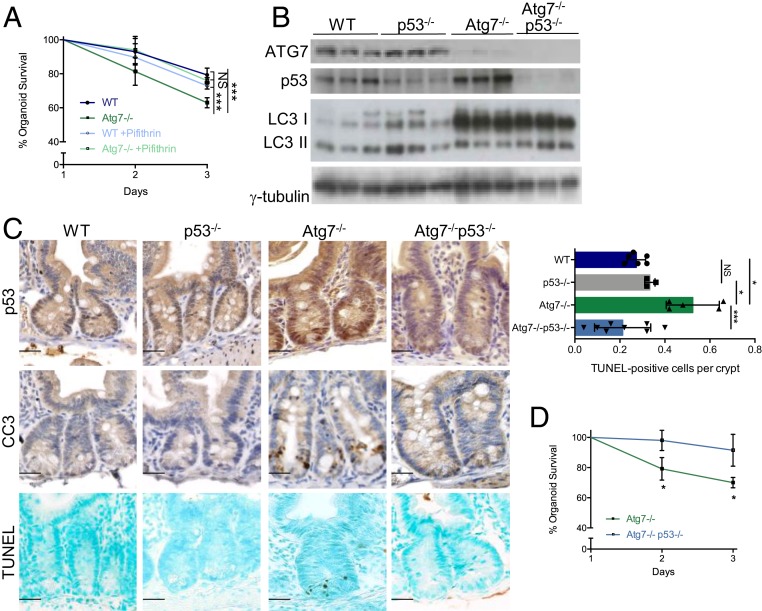
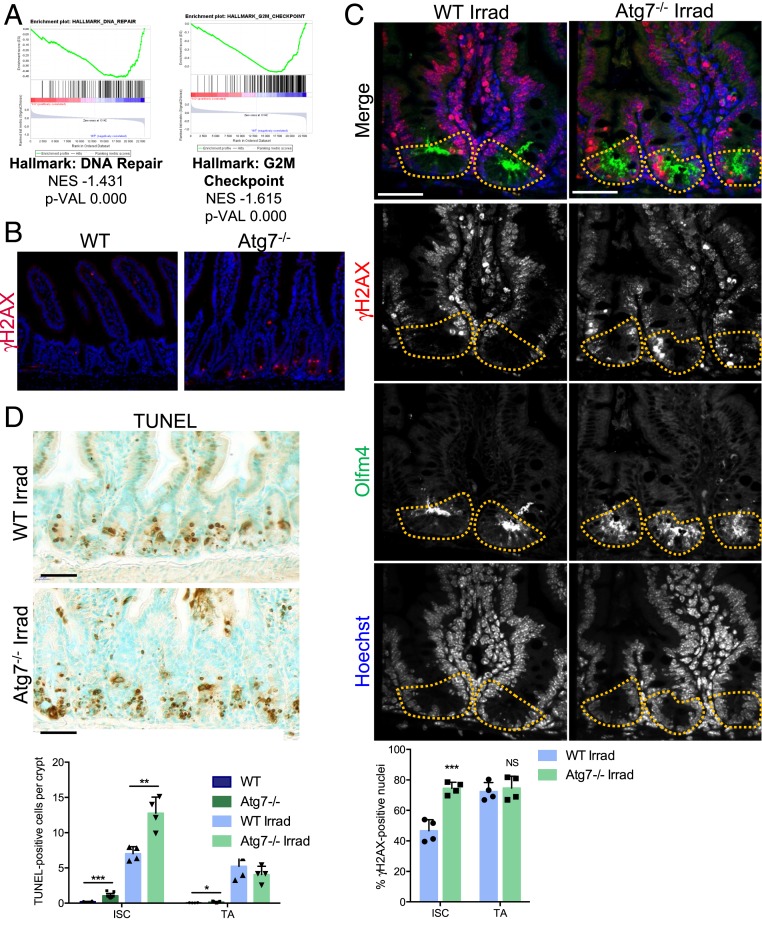
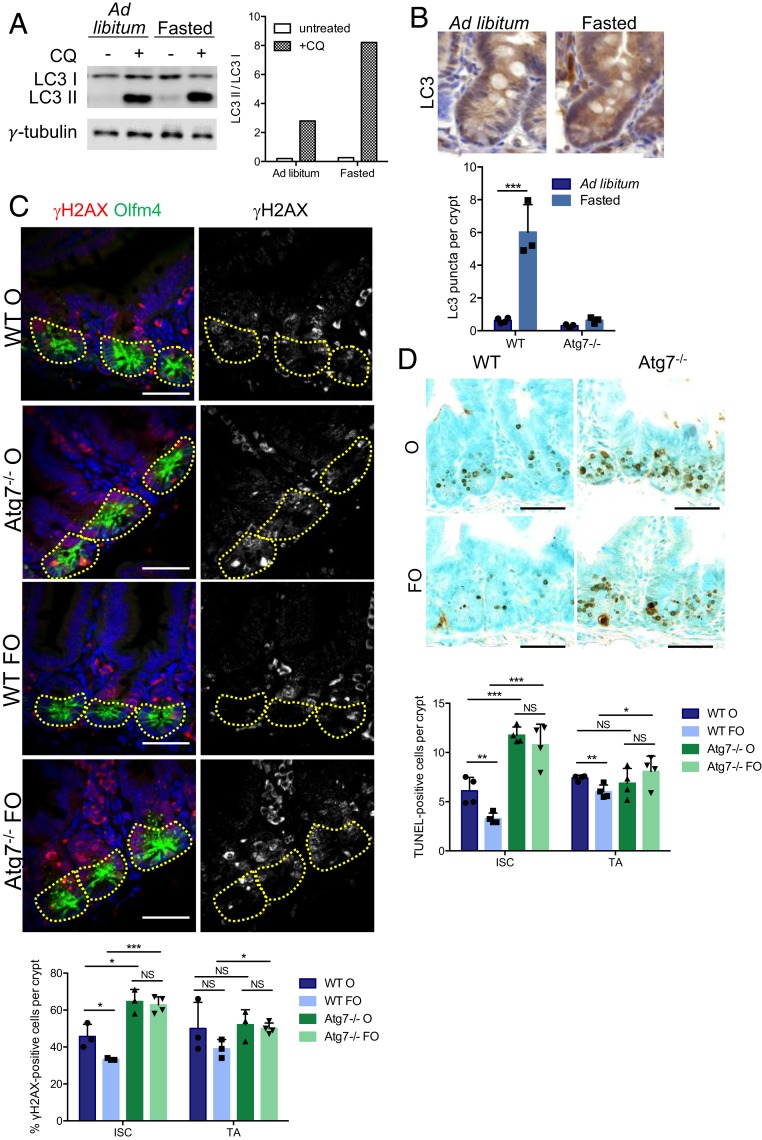
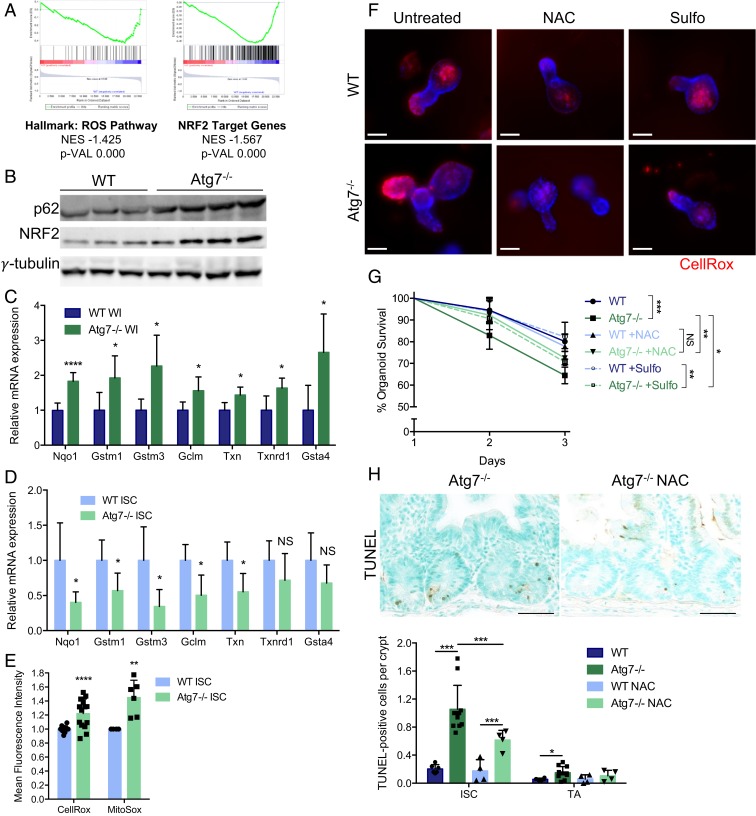
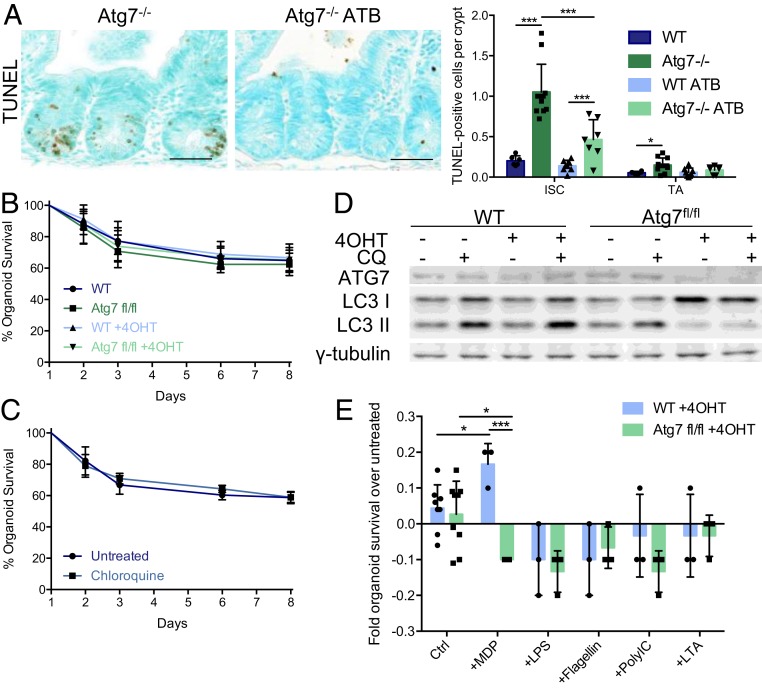
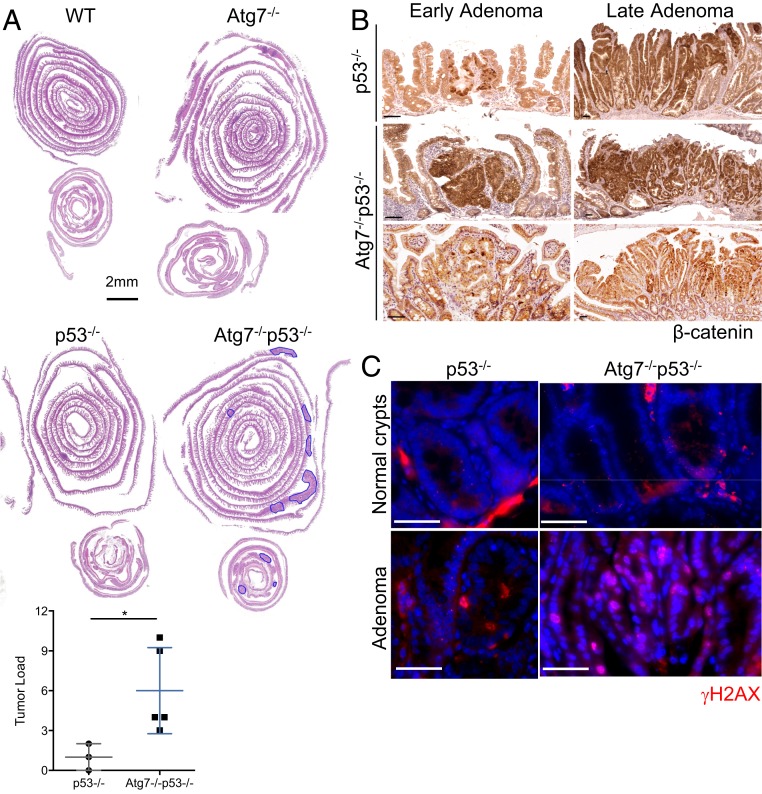
The intestinal epithelium acts as a barrier between the organism and its microenvironment, including the gut microbiota. It is the most rapidly regenerating tissue in the human body thanks to a pool of intestinal stem cells (ISCs) expressing Lgr5 The intestinal epithelium has to cope with continuous stress linked to its digestive and barrier functions. Epithelial repair is crucial to maintain its integrity, and Lgr5-positive intestinal stem cell (Lgr5+ISC) resilience following cytotoxic stresses is central to this repair stage. We show here that autophagy, a pathway allowing the lysosomal degradation of intracellular components, plays a crucial role in the maintenance and genetic integrity of Lgr5+ISC under physiological and stress conditions. Using conditional mice models lacking the autophagy gene Atg7 specifically in all intestinal epithelial cells or in Lgr5+ISC, we show that loss of Atg7 induces the p53-mediated apoptosis of Lgr5+ISC. Mechanistically, this is due to increasing oxidative stress, alterations to interactions with the microbiota, and defective DNA repair. Following irradiation, we show that Lgr5+ISC repair DNA damage more efficiently than their progenitors and that this protection is Atg7 dependent. Accordingly, we found that the stimulation of autophagy on fasting protects Lgr5+ISC against DNA damage and cell death mediated by oxaliplatin and doxorubicin treatments. Finally, p53 deletion prevents the death of Atg7-deficient Lgr5+ISC but promotes genetic instability and tumor formation. Altogether, our findings provide insights into the mechanisms underlying maintenance and integrity of ISC and highlight the key functions of Atg7 and p53.

Keywords: Atg7; DNA repair; autophagy; intestinal stem cells.


Conflict of interest statement

The authors declare no competing interest.

Figures

Fig. 1.
Fig. 1.
Atg7 deletion throughout the intestinal epithelium leads to Lgr5+ISC apoptosis. (A) Representative TUNEL staining on WT (wild type) and Atg7−/− tissue sections. Methyl green was used as a nuclear counterstain. Quantification of the percentage of TUNEL-positive crypts and the mean number of TUNEL-positive cells per crypt over 50 consecutive whole crypts in 6 WT and 11 Atg7−/− mice. The data shown are means ± SD. (Scale bars: 50 µm.) (B) Representative cleaved caspase-3 and p53 staining on tissue sections from WT and Atg7−/− intestines. (Scale bars: 25 µm.) (C) Representative TUNEL staining combined with in situ hybridization for Olfm4. Representative TUNEL staining combined with lysozyme staining. (Scale bars: 25 µm.) (D) Percentage survival from day 1 of organoids from the crypts of WT and Atg7−/− mice (n = 9 mice for WT and n = 7 mice for Atg7−/−). The data shown are means ± SD. Significant differences are shown with asterisks. *P < 0.05; **P < 0.01; ****P < 0.0001.
Fig. 2.
Fig. 2.
Atg7-deficient Lgr5+ISC apoptosis is dependent on p53. (A) Percentage survival from day 1 of organoids from the crypts of WT and Atg7−/− mice in the presence or absence of pifithrin in the culture medium (n = 3 mice of each genotype). Significant differences are shown for day 3. (B) Western blotting for ATG7, p53, and LC3 on whole-intestinal tissue lysates from WT, p53−/−, Atg7−/−, and Atg7−/−p53−/− mice. γ-Tubulin was used as a loading control. Results are shown for three individual mice of each genotype. (C) Representative p53, CC3, and TUNEL staining in the crypts of WT, p53−/−, Atg7−/−, and Atg7−/−p53−/− mice. Quantification of the mean number of TUNEL-positive cells per crypt over 50 consecutive whole crypts in seven WT, three p53, five Atg7−/−, and eight Atg7−/−p53−/− mice. The data shown are means ± SD. (Scale bars: 25 µm.) (D) Percentage survival from day 1 of organoids from the crypts of Atg7−/− and Atg7−/−p53−/− mice (n = 3 mice of each genotype). Significant differences are shown with asterisks. NS, not statistically significant. *P < 0.05; ***P < 0.005.
Fig. 3.
Fig. 3.
Loss of Atg7 disrupts DNA damage repair in Lgr5+ISC. (A) Enrichment plots generated by GSEA for hallmark DNA repair and G2/M checkpoint gene sets based on transcriptomic data for GFPHigh Lgr5+ISC from the crypts of Lgr5Atg7−/− vs. Lgr5WT mice. NES, normalized enrichment score; p-VAL, P value. (B) γH2AX staining showing a lack of epithelial staining in WT crypts and a representative positive zone in the Atg7−/− epithelium. (Scale bars: 50 µm.) (C) Representative z projection (from 20 stacks spanning over 6 µm to include whole nuclei) of combined γH2AX and Olfm4 staining in the crypts of WT and Atg7−/− mice 6 h after 10-Gγ whole-body irradiation. Yellow dashed lines indicate the Lgr5+ISC compartment. The percentage of γH2AX-positive cells was determined on at least 10 randomly selected whole crypts per mouse (n = 4 mice of each genotype). Cells with more than four γH2AX foci in their nuclei were considered γH2AX positive. Olfm4+ cells were considered to be ISC, and the Olfm4 cells above them and below the crypt–villus junction were considered to be TA cells. The data shown are means ± SD. (Scale bars: 50 µm.) (D) Representative TUNEL staining on tissue sections from WT and Atg7−/− mice 6 h after 10-Gγ whole-body irradiation. Determination of the mean number of TUNEL-positive cells per crypt over 50 consecutive whole crypts in 6 control WT mice, 11 control Atg7−/− mice, and 4 irradiated mice of each genotype. The data shown are means ± SD. Significant differences are shown with asterisks. NS, not statistically significant. (Scale bars: 50 µm.) *P < 0.05; **P < 0.01; ***P < 0.005.
Fig. 4.
Fig. 4.
Fasting protects ISC from chemotherapy-induced DNA damage and apoptosis in an Atg7-dependent manner. (A) Western blotting for LC3 in organoids derived from WT mice that were either fed ad libitum or fasted for 24 h. Chloroquine (CQ) was used to block autophagic flux. γ-Tubulin was used as a loading control. (B) Representative LC3 staining in WT crypts from mice either fed ad libitum or fasted for 24 h. Quantification of LC3 puncta per crypt in WT and Atg7−/− mice either fed ad libitum or fasted for 24 h. (C) Representative z projection (from 20 stacks spanning 6 µm to include whole nuclei) of combined γH2AX and Olfm4 staining and γH2AX staining alone (Right) in the crypts of WT and Atg7−/− mice 6 h after oxaliplatin treatment alone (O) or preceded by a 24-h fast (FO). The percentage of γH2AX-positive cells was determined on at least 10 randomly selected whole crypts per mouse (n = 4 mice of each genotype). Cells with more than four γH2AX foci in their nuclei were considered γH2AX positive. Olfm4+ cells (circled area) were considered to be ISC, and the Olfm4 cells above them and below the crypt–villus junction were considered to be TA cells. The data shown are means ± SD. (Scale bars: 50 µm.) (D) Representative TUNEL staining of tissue sections from WT and Atg7−/− mice after 6 h of oxaliplatin treatment alone (O) or preceded by a 24-h fast (FO). Determination of the mean number of TUNEL-positive cells per crypt over 50 consecutive whole crypts in four mice per condition. The data shown are means ± SD. Significant differences are shown with asterisks. NS, not statistically significant. (Scale bars: 50 µm.) *P < 0.05; **P < 0.01; ***P < 0.005.
Fig. 5.
Fig. 5.
Defective antioxidant responses and ROS accumulation contribute to the death of Atg7-deficient Lgr5+ISC. (A) Enrichment plots generated by GSEA for the hallmark ROS pathway and NRF2 target gene sets based on transcriptomic data from sorted Lgr5+ISC from Lgr5Atg7−/− and Lgr5WT mice. NES, normalized enrichment score; p-VAL, P value. (B) Western blotting for p62 and NRF2 on whole-intestinal (WI) tissue lysates from WT and Atg7−/− mice. γ-Tubulin was used as a loading control. Three WT and four Atg7−/− mice are shown. (C) Relative mRNA levels for NRF2 target genes encoding antioxidant response proteins as assessed by qRT-PCR analysis of whole-intestinal tissue lysates from four WT and five Atg7−/− mice. The data shown are means ± SD. (D) Relative mRNA levels for NRF2 target genes encoding antioxidant response proteins as assessed by qRT-PCR analysis of sorted Lgr5+ISC from Lgr5WT and Lgr5Atg7−/− mice. The data shown are means ± SD (n = 4 to 6 mice per condition). (E) Mean CellROX or MitoSOX fluorescence intensity of sorted Lgr5+ISC from Lgr5WT and Lgr5Atg7−/− mice. The data shown are means ± SD (n = 13 Lgr5WT and n = 14 Lgr5Atg7−/− mice for CellROX analysis, n = 4 Lgr5WT and n = 6 Lgr5Atg7−/− mice for MitoSOX analysis). (F) Representative CellROX staining on live organoids from the crypts of WT and Atg7−/− mice after 3 d in culture in the presence or absence of NAC or sulforaphane (Sulfo) in the culture medium. Hoechst stain was used as a nuclear counterstain. (Scale bars: 50 µm.) (G) Percentage survival from day 1 of organoids from the crypts of WT and Atg7−/− mice in the presence or absence of NAC or Sulfo in the culture medium (n = 5 mice for each genotype). Significant differences are shown in the legend for day 3. (H) Representative TUNEL staining on tissue sections from Atg7−/− mice treated with water or NAC. Quantification of the percentage of TUNEL-positive crypts and the mean number of TUNEL-positive cells per crypt over 50 consecutive whole crypts in 6 control WT mice, 11 control Atg7−/− mice, and 4 NAC-treated mice of each genotype. The data shown are means ± SD. Significant differences are shown with asterisks. NS, not statistically significant. (Scale bars: 50 µm.) *P < 0.05; **P < 0.01; ***P < 0.005; ****P < 0.001.
Fig. 6.
Fig. 6.
Interactions with the microbiota contribute to the apoptosis of Atg7-deficient Lgr5+ISC. (A) Representative TUNEL staining on tissue sections of Atg7−/− mice treated with water or broad-spectrum antibiotics (ATB). Quantification of the mean number of TUNEL-positive cells per crypt over 50 consecutive whole crypts in 6 control WT mice, 11 control Atg7−/− mice, 8 WT, and 7 Atg7−/− ATB-treated mice. The data shown are means ± SD. (Scale bars: 50 µm.) (B) Percentage survival from day 1 of WT or Atg7fl/fl organoids in the presence or absence of 4OHT in the culture medium (n = 6 mice per condition). (C) Percentage survival from day 1 of WT organoids in the presence or absence of chloroquine (CQ) in the culture medium (n = 6 mice per condition). (D) Western blotting for ATG7 and LC3 on protein extracts from day 4 WT or Atg7fl/fl organoids in the presence or absence of 4OHT and/or CQ in the culture medium. γ-Tubulin was used as a loading control. (Scale bars: 50 µm.) (E) Fold change in survival relative to untreated controls of WT or Atg7fl/fl organoids in the presence of 4OHT (control [Ctrl], n = 8 WT and n = 9 Atg7fl/fl mice) and in the presence or absence of MDP, lipopolysaccharide (LPS), flagellin, polyinosinic:polycytidylic acid (PolyIC), or lipoteichoic acid (LTA) in the culture medium (n = 3 mice per condition). Significant differences are shown with asterisks. *P < 0.05; ***P < 0.005.
Fig. 7.
Fig. 7.
p53 blocks tumor initiation in the Atg7-deficient intestinal epithelium. (A) Representative hematoxylin and eosin staining of tissue sections of small intestinal and colonic “Swiss rolls” from WT, Atg7−/−, p53−/−, and Atg7−/−p53−/− mice killed 12 mo after tamoxifen treatment. Quantification of histologically assessed tumor load in p53−/− or Atg7−/−p53−/− mice 12 mo after tamoxifen treatment (n = 3 p53−/− and n = 5 Atg7−/−p53−/− mice). Tumors are circled in blue. (Scale bar: 2 mm. Significant differences are shown with asterisks. *P < 0.05.) (B) Representative β-catenin staining on small polyps (Left) and adenomas (Right) from p53−/− and Atg7−/−p53−/− mice killed 12 mo after tamoxifen treatment. (Scale bars: 50 µm.) (C) Representative γH2AX staining on healthy crypts and adenomas from p53−/− and Atg7−/−p53−/− mice killed 12 mo after tamoxifen treatment. (Scale bars: 50 µm.)

Similar articles

Cited by

References

    1. Durand A. et al. ., Functional intestinal stem cells after Paneth cell ablation induced by the loss of transcription factor Math1 (Atoh1). Proc. Natl. Acad. Sci. U.S.A. 109, 8965–8970 (2012). - PMC - PubMed
    1. Barker N., Adult intestinal stem cells: Critical drivers of epithelial homeostasis and regeneration. Nat. Rev. Mol. Cell Biol. 15, 19–33 (2014). - PubMed
    1. Metcalfe C., Kljavin N. M., Ybarra R., de Sauvage F. J., Lgr5+ stem cells are indispensable for radiation-induced intestinal regeneration. Cell Stem Cell 14, 149–159 (2014). - PubMed
    1. Barker N. et al. ., Crypt stem cells as the cells-of-origin of intestinal cancer. Nature 457, 608–611 (2009). - PubMed
    1. Mizushima N., A brief history of autophagy from cell biology to physiology and disease. Nat. Cell Biol. 20, 521–527 (2018). - PubMed

Publication types

MeSH terms

Substances