. 2020 May 19;117(20):10660-10666.
doi: 10.1073/pnas.1913767117. Epub 2020 May 5.

Metabolic cost of rapid adaptation of single yeast cells

Affiliations

Metabolic cost of rapid adaptation of single yeast cells

Gabrielle Woronoff et al. Proc Natl Acad Sci U S A. .

Abstract

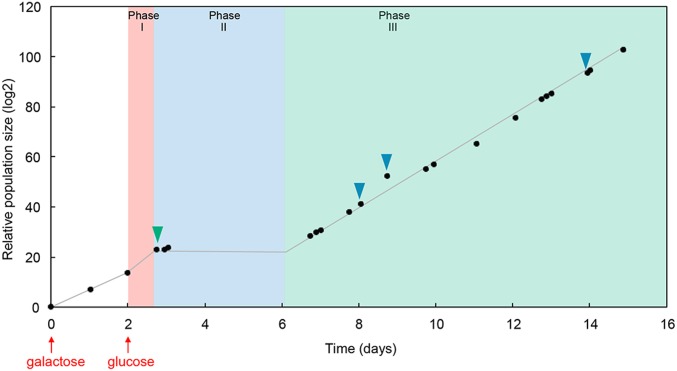
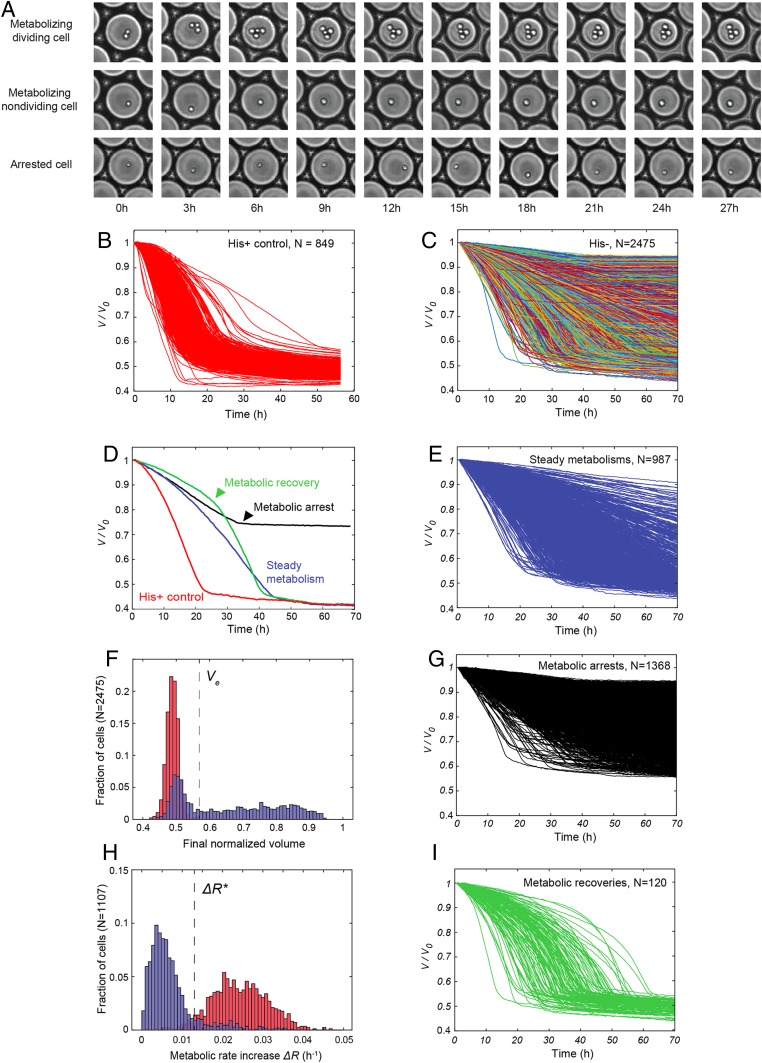
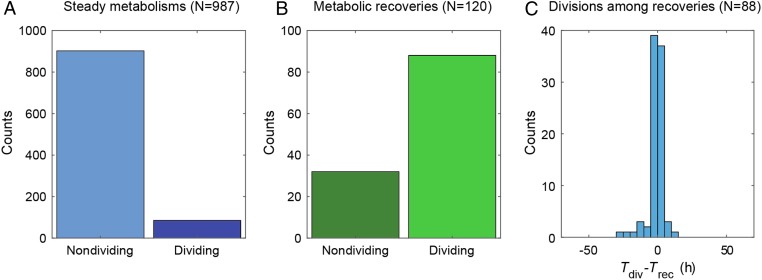
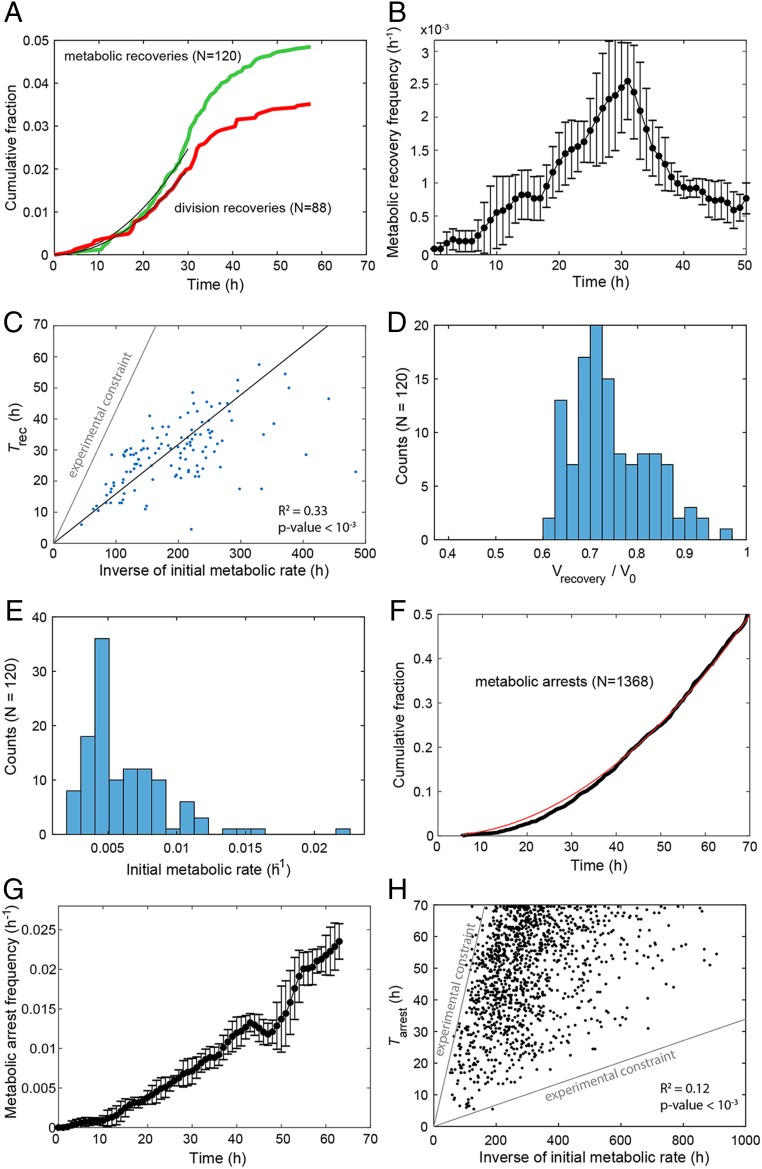
Cells can rapidly adapt to changing environments through nongenetic processes; however, the metabolic cost of such adaptation has never been considered. Here we demonstrate metabolic coupling in a remarkable, rapid adaptation process (1 in 1,000 cells adapt per hour) by simultaneously measuring metabolism and division of thousands of individual Saccharomyces cerevisiae cells using a droplet microfluidic system: droplets containing single cells are immobilized in a two-dimensional (2D) array, with osmotically induced changes in droplet volume being used to measure cell metabolism, while simultaneously imaging the cells to measure division. Following a severe challenge, most cells, while not dividing, continue to metabolize, displaying a remarkably wide diversity of metabolic trajectories from which adaptation events can be anticipated. Adaptation requires a characteristic amount of energy, indicating that it is an active process. The demonstration that metabolic trajectories predict a priori adaptation events provides evidence of tight energetic coupling between metabolism and regulatory reorganization in adaptation. This process allows S. cerevisiae to adapt on a physiological timescale, but related phenomena may also be important in other processes, such as cellular differentiation, cellular reprogramming, and the emergence of drug resistance in cancer.

Keywords: adaptation; droplet-based microfluidics; genetic rewiring; single-cell metabolism.


Conflict of interest statement

The authors declare no competing interest.

Figures

Fig. 1.
Fig. 1.
Population growth in bulk cultures during adaptation. The culture of rewired cells started with galactose as the sole carbon source (first red arrow). Then, the medium was switched to glucose (second red arrow). The culture continued to grow during the “initial growth phase” (phase I), before entering the latent phase (phase II) where growth stopped. Finally, the population grew again, entering the adapted phase (phase III). Green and blue triangles indicate time points when samples were taken for single-cell measurements in droplets (green triangle: 3 h after the beginning of phase II; blue triangles: 2, 3, and 6 d after the onset of phase III).
Fig. 2.
Fig. 2.
Single-cell analysis of metabolic dynamics in droplets. (A) Time-lapse sequences of droplets containing a metabolizing dividing cell, a metabolizing nondividing cell, and an arrested cell. Each image is 150 × 150 µm. (B) Traces of droplet volumes V normalized by the initial volume V0, in the absence of metabolic challenge (with histidine). (C) Traces of normalized droplet volumes starting 3 h after switching from galactose to glucose. Lines are randomly color coded. (D) Examples of traces of normalized droplet volumes of the His+ control (red) and of each category of metabolic response observed in the adaptation experiment. (E) Subset of steady metabolisms from C. (F) Distribution of final normalized droplet volume (Vf/V0) in the presence (red) and absence (blue) of histidine. Ve indicates the largest final droplet volume with histidine. (G) Subset of arrested metabolisms from C. (H) Distributions of the difference ΔR (metabolic rate increase) between the initial (at 2 h) and maximum metabolic rates in the presence (red) and absence (blue) of histidine. ΔR* indicates the cross-over between the two distributions. (I) Subset of metabolic recoveries from C.
Fig. 3.
Fig. 3.
Relation between onset of division and metabolic recovery. (A) Fraction of dividing cells in steady metabolisms. (B) Fraction of dividing cells in metabolic recoveries. (C) Distribution of the difference between division time (Tdiv) and metabolic recovery time (Trec).
Fig. 4.
Fig. 4.
Characterization of adaptation. (A) Cumulative fraction over time for metabolic recoveries (green) and division recoveries (red). Black lines are a quadratic fit over the first 30 h. (B) Instantaneous frequency of metabolic recoveries of cells. At each time point, frequencies are computed over seven consecutive points and error bars are SDs over the values obtained over these points. (C) Plot of metabolic recovery time (Trec) as a function of inverse initial metabolic rate (R0−1). The parameter region above the gray line corresponds to cells that have exhausted droplet resources before being able to recover (Materials and Methods). The black line is the linear fit. (D) Distribution of normalized droplet volume at Trec. (E) Distribution of R0 for the subset of metabolic recoveries. (F) Cumulative fraction over time for metabolic arrests (black). The red line is a quadratic fit. (G) Instantaneous frequency of arrests of cells that have neither recovered nor arrested their metabolism. Frequencies and error bars were computed as in B). (H) Plot of time of metabolic arrest (Tarr) as a function of R0−1. The parameter region above the upper gray line corresponds to cells that have exhausted droplet resources before arresting. The parameter region below the lower gray line corresponds to curves whose final volume is indistinguishable from curves of empty droplets (overall volume variation <5%). The contribution of the constraints in C and H has been accounted for to compute the coefficients of determination R2 (Materials and Methods).
Fig. 5.
Fig. 5.
Metabolic categories in phase II (adapting population) and phase III (adapted population). Fraction of each cell type during adaptation (phase II), and 2, 4, and 7 d after entering the adapted phase (phase III). Phase II: metabolic arrest (55%), steady metabolism: dividing (3.4%), nondividing (36%), accelerated metabolism: dividing (3.5%), nondividing (1.3%). Phase III: The proportions of the different classes of cells are very similar at the three time points: metabolic arrest (1.6 ± 1%), accelerated metabolism nondividing (10 ± 1%), and accelerated metabolism dividing (89 ± 2%). Steady metabolism is not observed in phase III, since the cells are already adapted. Consistent with adaptation observed at the population level, the fraction of dividing cells is >10-fold higher than at the beginning of phase II (7).

Similar articles

Cited by

References

    1. Laland K. N., et al. , The extended evolutionary synthesis: Its structure, assumptions and predictions. Proc. Biol. Sci. 282, 20151019–20151014 (2015). - PMC - PubMed
    1. Robinson B. W., Dukas R., The influence of phenotypic modifications on evolution: The Baldwin effect and modern perspectives. Oikos 85, 582–589 (1999).
    1. Gupta P. B., Pastushenko I., Skibinski A., Blanpain C., Kuperwasser C., Phenotypic plasticity: Driver of cancer initiation, progression, and therapy resistance. Cell Stem Cell 24, 65–78 (2019). - PMC - PubMed
    1. Lemons J. M. S., et al. , Quiescent fibroblasts exhibit high metabolic activity. PLoS Biol. 8, e1000514 (2010). - PMC - PubMed
    1. Slavov N., Macinskas J., Caudy A., Botstein D., Metabolic cycling without cell division cycling in respiring yeast. Proc. Natl. Acad. Sci. U.S.A. 108, 19090–19095 (2011). - PMC - PubMed

Publication types

MeSH terms

LinkOut - more resources