. 2020 May 5;13(630):eaau9529.
doi: 10.1126/scisignal.aau9529.

p53 is regulated by aerobic glycolysis in cancer cells by the CtBP family of NADH-dependent transcriptional regulators

Affiliations

p53 is regulated by aerobic glycolysis in cancer cells by the CtBP family of NADH-dependent transcriptional regulators

Charles N Birts et al. Sci Signal. .

Abstract

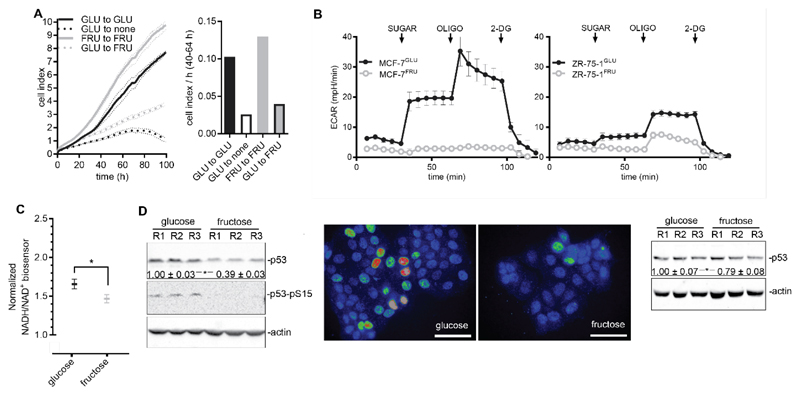
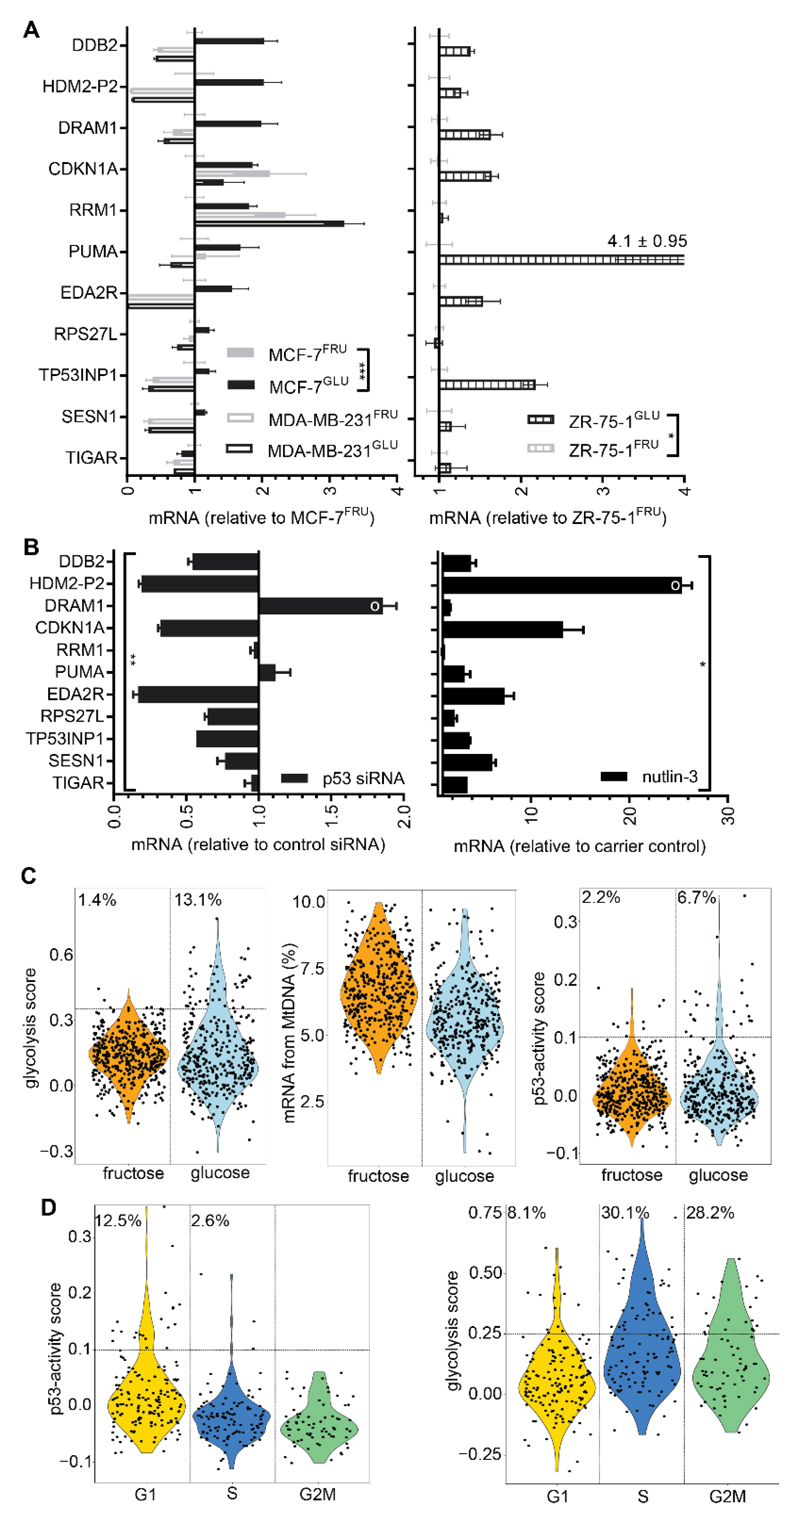
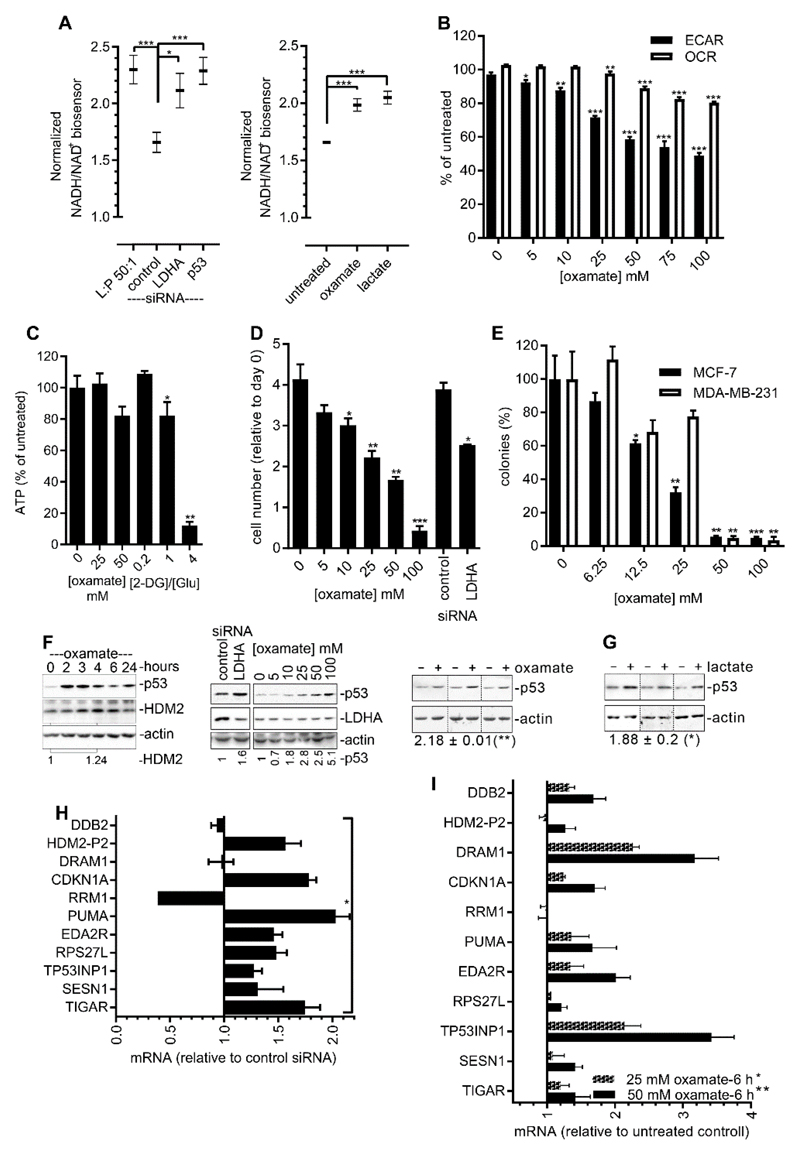
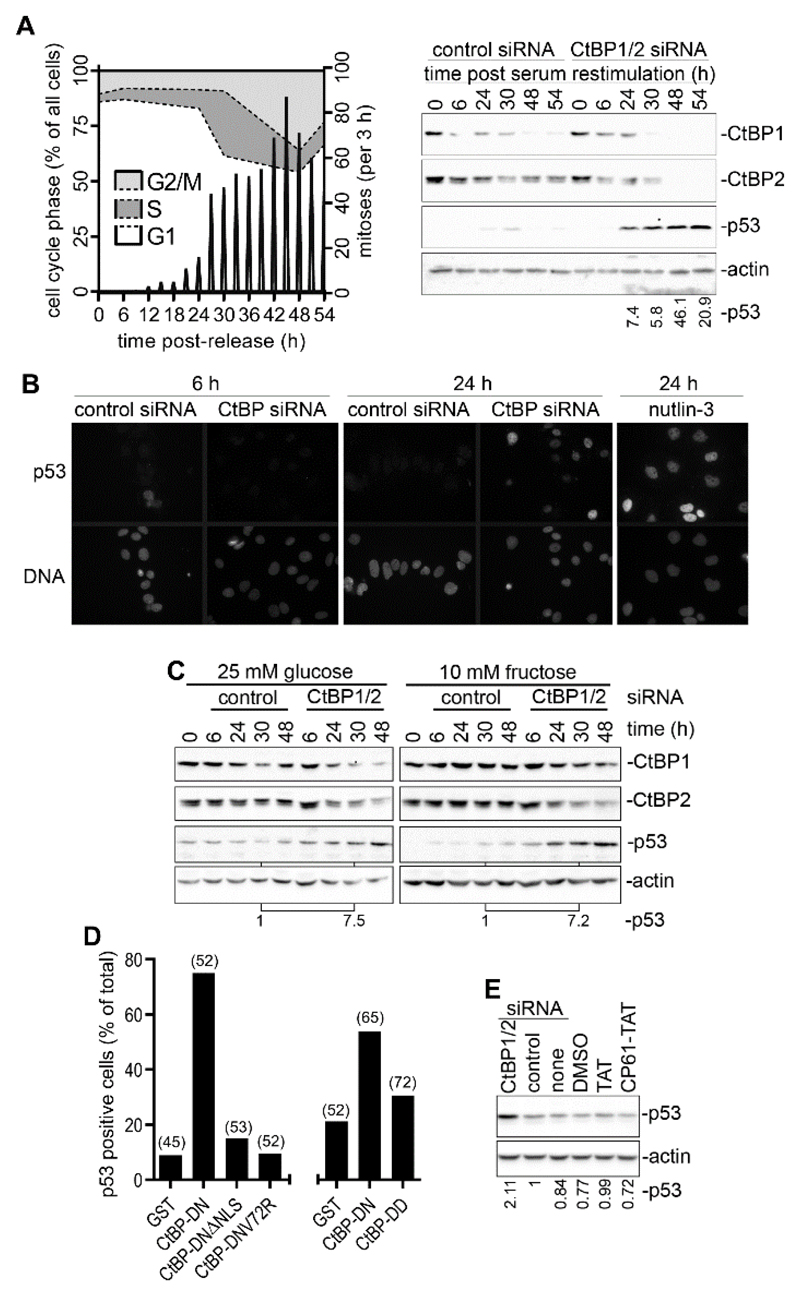
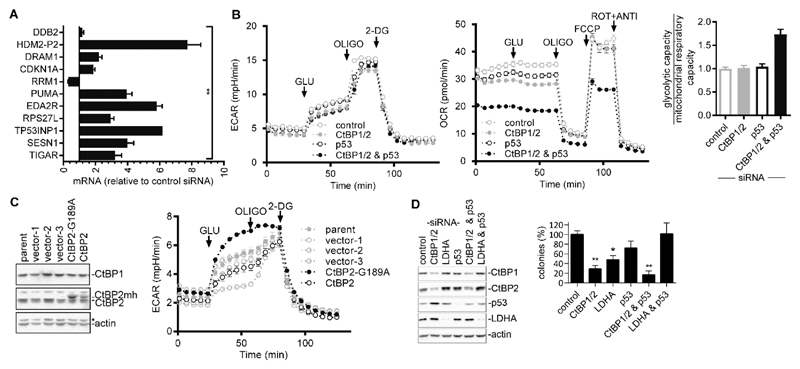
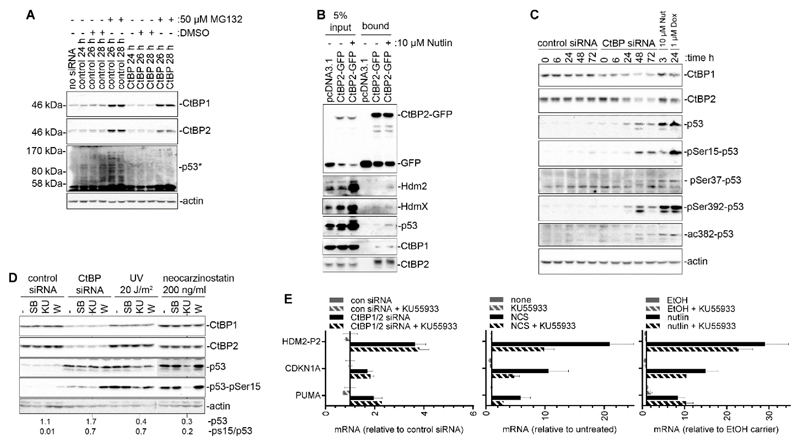
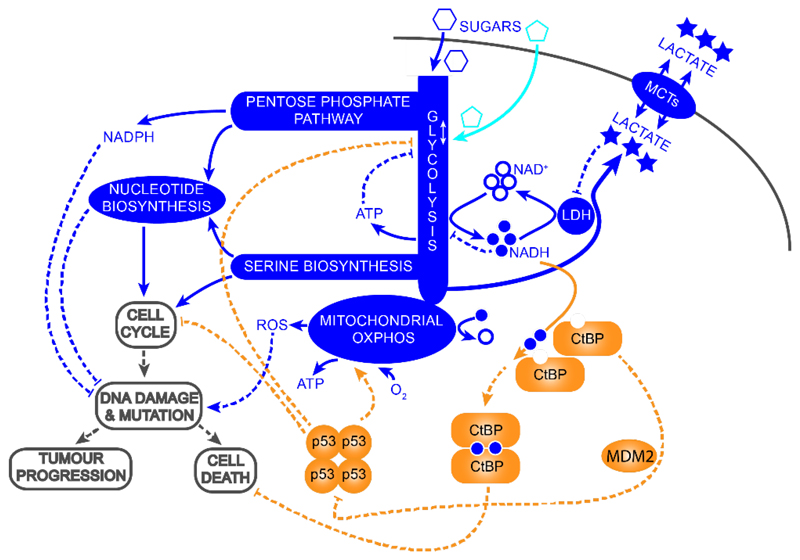
High rates of glycolysis in cancer cells are a well-established characteristic of many human tumors, providing rapidly proliferating cancer cells with metabolites that can be used as precursors for anabolic pathways. Maintenance of high glycolytic rates depends on the lactate dehydrogenase-catalyzed regeneration of NAD+ from GAPDH-generated NADH because an increased NADH:NAD+ ratio inhibits GAPDH. Here, using human breast cancer cell models, we identified a pathway in which changes in the extramitochondrial-free NADH:NAD+ ratio signaled through the CtBP family of NADH-sensitive transcriptional regulators to control the abundance and activity of p53. NADH-free forms of CtBPs cooperated with the p53-binding partner HDM2 to suppress p53 function, and loss of these forms in highly glycolytic cells resulted in p53 accumulation. We propose that this pathway represents a "glycolytic stress response" in which the initiation of a protective p53 response by an increased NADH:NAD+ ratio enables cells to avoid cellular damage caused by mismatches between metabolic supply and demand.


Conflict of interest statement

Competing interests: J.P.B. has served as a member of the Scientific Advisory Board of Breast Cancer Now. The other authors declare that they have no competing interests.

Figures

Fig. 1
Fig. 1. p53 protein abundance is increased in glycolytic cells.
(A) MCF-7GLU and MCF-7FRU cells had their culture medium replaced with one containing the indicated sugar and then were analyzed for proliferation using xCELLigence. Left: Cell index showing cell proliferation from 1 to 100 hours after plating. Data are means ± range of at least two experiments. Right: Proliferation rates (40 to 100 hours). Data are representative of two experiments. (B) Glucose or fructose-adapted breast cancer cells (as indicated) were analyzed for rates of glycolysis-dependent extracellular acidification (ECAR) using a Seahorse XF96. Initial readings were taken in medium lacking sugar, and then ports were injected with the sugar to which the cells had been adapted. Data are means ± SEM of four technical replicates. Data are representative of two experiments. (C) Determination of the NADH/NAD+ ratios of glucose- and fructose-cultured MCF-7 cells by Peredox biosensor analysis. Data are means ± SEM of at least 80 cells from a representative of two experiments and were analyzed by unpaired t test. Calibration is shown in fig. S1C. (D) Left: MCF-7 cells adapted to the indicated sugar were lysed and subjected to Western blotting analysis with antibodies specific for the indicated targets. Numbers indicate the mean ± SEM of the normalized p53 band intensities from three experiments (R1 to R3) and were analyzed by paired t test. Middle: Immunofluorescence staining of p53 in MCF-7GLU and MCF-7FRU cells. A rainbow lookup table demonstrates p53 staining intensity (blue/low → red/high, ~15-fold maximum range between cells). Scale bar, 50 μm. Right: ZR-75-1 cells adapted to the indicated sugar were lysed and subjected to Western blotting analysis with antibodies specific for the indicated targets. Numbers indicate the mean ± SEM of the normalized p53 band intensities from three experiments and were analyzed by paired t test. p53-pSer15 was undetectable in these cells.
Fig. 2
Fig. 2. Glycolysis promotes p53-dependent gene expression.
(A) RT-qPCR analysis of the expression of a panel of known p53-responsive genes in glucose- and fructose-cultured cells. Data are means ± SEM of three experiments. (B) mRNAs were extracted from MCF-7 cells in which p53 had been either suppressed by p53-specific siRNA (72 hours after transfection; data are means ± SEM of three experiments) or induced by treatment with 5 μM nutlin-3 for 24 hours (data are means ± SEM of three experiments), o, outlier. (C and D) Whole-transcriptome, single-cell mRNA-seq was performed on MCF-7GLU and MCF-7FRU cells. Data are combined from three experiments. (C) Violin plots comparing MCF-7GLU cells with MCF-7FRU cells in terms of glycolysis gene expression score (left), percentage of all mRNA transcripts that are derived from mitochondrial DNA (middle), and p53-activity gene expression score (right). (D) Analysis of MCF-7GLU cells alone. Violin plots of p53-activity score (left) and glycolysis score (right), according to assigned cell cycle phase. The percentage of cells in each phase with a score greater than the threshold value is indicated.
Fig. 3
Fig. 3. Inhibition of LDH activates p53.
(A) NADH/NAD+ ratios in MCF-7GLU cells were measured using the Peredox biosensor. Left: Forty-eight hours after transfection with the indicated siRNAs. Data from control siRNA–transfected cells 6 min after the addition of 50 mM lactate to the medium (L:P 50:1) are included as a positive control. Right: No transfection with siRNA. The cells were imaged as described earlier, and 6 min after the addition of medium containing 50 mM sodium oxamate or 50 mM lactate, the fold change in green/red ratio was determined. Control, medium alone added. Data in both panels are means ± SEM of at least 35 cells from a representative of two or more experiments and were analyzed by unpaired t test. (B) The effect of increasing concentrations of sodium oxamate on ECAR and OCR in MCF-7 cells was determined using Seahorse XF96. Data are means ± SEM of four experiments. Data were analyzed by unpaired t test and compared to the 0 mM control. (C) ATP was measured in MCF-7GLU cells in 25 mM glucose (Glu) 2 hours after the initiation of treatment with oxamate or 2-deoxyglucose (2-DG). Data are means ± SEM of three experiments and were analyzed by paired t test compared to the 0 mM control. (D) MCF-7GLU cells were transfected with the indicated siRNAs or were continuously exposed to the indicated concentrations of sodium oxamate, and the effect on proliferation was determined at 72 hours. Data are means ± SEM of three experiments and were analyzed by unpaired t test compared to either the 0 mM oxamate condition or to the control siRNA. (E) Cells were plated as single cells at a low density and exposed to the indicated concentrations of sodium oxamate for 10 days before colonies were counted. Data are means ± SEM of three experiments and were analyzed by unpaired t-test and compared to the 0 mM oxamate condition. (F) MCF-7GLU cells. Left: Western blotting analysis of p53 and HDM2 protein abundance during exposure to 50 mM sodium oxamate for the indicated times. Data are representative of two experiments. Middle: Western blotting analysis of p53 protein abundance after 2 hours of exposure to the indicated concentrations of sodium oxamate or 48 hours after transfection with control of LDHA-specific siRNA. Right: Western blotting analysis of p53 abundance in three biological replicates (separated by vertical dotted lines) after 2 hours of exposure to 50 mM sodium oxamate. Numbers under the blot indicate the mean ± SEM of the relative intensity of the p53 bands in the oxamate-treated cells compared to that in the untreated cells, which was set at 1. Data were analyzed by paired t test. (G) MCF-7GLU cells (three biological replicates separated by vertical dotted lines) were cultured as described in (A) for 6 hours in the absence or presence of 50 mM lactate before being analyzed by Western blotting for p53 abundance. Numbers under the blot indicate the mean ± SEM of the relative intensity of the p53 bands in the lactate-treated cells compared to that in the untreated cells, which was set at 1. Data were analyzed by paired t test. (H) RT-qPCR analysis of mRNAs extracted from MCF-7GLU cells in which LDHA was knocked down by LDHA-specific siRNA. Samples were analyzed 72 hours after transfection. Data are means ± SEM of three experiments. Knockdown of LDHA protein by the specific siRNA is shown in fig. S3. (I) RT-qPCR analysis of mRNAs extracted from MCF-7GLU cells in which LDH was inhibited by treatment with the indicated concentrations of sodium oxamate for 6 hours. Data are means ± SEM of three experiments.
Fig. 4
Fig. 4. CtBPs are required to prevent the accumulation of p53 protein in proliferating cells.
(A) MCF-7 cells were synchronized by serum starvation for 48 hours and then transfected with control of CtBP1/2-specific siRNAs at the point of re-stimulation with serum. Left: Cell cycle phase in the control siRNA–transfected cells was determined by propidium iodide flow cytometry (left axis), whereas mitotic events were determined by time-lapse video microscopy (right axis). Right: Western blotting of the indicated samples for CtBP1, CtBP2, and p53. Blots are representative of three experiments. Quantification shows the effect (fold-increase) of CtBP1/2-specific siRNA on p53 abundance compared to that of control siRNA at the equivalent times. (B) MCF-7 cells were transfected and re-stimulated with serum as described in (A) and p53 was detected by immunofluorescence staining. Cells exposed to 5 μM nutlin-3 are included for comparison. Images are representative of two experiments. (C) MCF-7GLU and MCF-7FRU cells transfected with the indicated siRNAs were analyzed by Western blotting at the indicated times after culture under the indicated conditions. Blots are from a single experiment. Quantification of the effect of CtBP1/2-specific siRNA versus control siRNA on p53 abundance at the 30-hour time point is shown . (D) At the point of release from serum starvation MCF-7 cells were microinjected with the indicated GST miniproteins. Twenty-four hours later, p53 in the injected cells was determined by immunofluorescence staining and the percentages of p53-positive cells were determined. The numbers of microinjected cells analyzed are shown in parentheses. The broken x-axis indicates that the results are from independently controlled experiments (E) MCF-7 cells were treated with CP61-TAT, TAT only, or DMSO for 48 hours before being subjected to Western blotting analysis for p53. Cells transfected with CtBP1/2-specific siRNA are included as a positive control. Blots are representative of three experiments.
Fig. 5
Fig. 5. Functional consequences of the regulation of p53 by CtBPs.
(A) mRNAs were extracted from MCF-7 cells 72 hours after they had been transfected with control or CtBP1/2-specific siRNAs. Data are means ± SEM of three experiments. Knockdown of CtBP proteins by the specific siRNA is shown in fig. S3. (B) MCF-7 cells were transfected with the indicated siRNAs. Forty-eight hours later, the effects on ECAR (left) and OCR (middle) were determined using the Seahorse XF96 instrument. Data are means ± SEM of five technical replicates and are representative of two experiments. Right: The ratio of glycolytic capacity to mitochondrial respiratory capacity. (C) MCF-7 cells were stably transfected with empty vector or with plasmids encoding CtBP2 or CtBP2G189A and individual clones were isolated. Left: Cells were analyzed by Western blotting with antibodies against the indicated proteins. Blots are representative of two or more experiments. Right: Glycolytic ECAR was determined by Seahorse XF96. (D) MCF-7 cells were transfected with the indicated siRNAs and then analyzed 48 hours later. Left: Western blotting analysis of the indicated proteins. Blots are representative of three experiments. Right: Equal numbers of cells were plated at low density for colony-forming assays. Colonies were counted 10 days later. Data are means ± SEM of three experiments and were analyzed by Fisher’s LSD test.
Fig. 6
Fig. 6. Mechanisms of regulation of p53 by CtBPs.
(A) MCF-7 cells were serum-starved for 48 hours transfected with the indicated siRNAs at the point of serum re-stimulation, and then treated with MG132 or DMSO 24 hours later. Cells were lysed and analyzed by Western blotting at the indicated times after serum re-stimulation. The asterisk indicates the non-ubiquitylated p53 signal is overexposed to enable visualization of the ubiquitylated p53 bands. Blots are representative of two experiments. (B) MCF-7 cells were transfected with the indicated plasmids together with pEGFP-N1, treated with or without 10 μM nutlin-3, and protein complexes were analyzed by GFP-Trap immunoprecipitation. Blots are representative of two experiments. (C) MCF-7 cells were transfected with the indicated siRNAs at the point of release from 48 hours of serum-starvation. Samples were prepared for Western blotting at the indicated times after release. Nutlin and doxorubicin were included as positive controls for p53 induction and modification. Quantification of the blots is shown in fig. S7. (D) MCF-7 cells were treated with 2 μM SB202190, 10 μM KU55933, or 5 μM wortmannin for 4 hours either 48 hours after transfection with the indicated siRNAs or in the presence of neocarzinostatin (200 ng/ml) or exposure to 20 J/m2 UV-C. Proteins were then analyzed by Western blotting. Quantification shows the effect of KU55933 on both p53 abundance and the p53-Ser15/p53 ratio under each treatment condition. Blots are representative of three experiments. The dotted vertical line indicates noncontiguous blots. (E) MCF-7 cells were transfected with control or CtBP1/2-specific siRNA. Forty-eight hours later, the cells were treated with 10 μM KU55933 for a further 24 hours. MCF-7 cells pretreated with 10 μM KU55933 for 24 hours were treated with neocarzinostatin (200 ng/ml) or 10 μM nutlin-3 for a further 4 hours before being harvested and being subjected to RT-qPCR of the relative abundances of the indicated mRNAs. Data are means ± SD of two experiments.
Fig. 7
Fig. 7. Model for the role of the NADH-CtBP-p53 pathway in the regulation of glycolytic homeostasis.
Primary metabolic pathways are shown in blue (fructose model is in cyan), cellular phenotypes are in gray, and the CtBP-p53 pathway in shown in orange. Solid lines show metabolic reactions, whereas dashed lines show regulatory relationships. Regeneration of NAD+ from GAPDH-generated NADH by the mitochondrial electron transport chain is reduced by decreased O2 concentrations and increased by ATP generation through glycolysis. The ability of LDH to regenerate NAD+ is linked to rates of lactate export, which are inhibited by high tumor lactate concentrations. Oncogenic mutations drive both cell proliferation and increased rates of glycolysis for the synthesis of anabolic metabolites. The biochemical limitation of glycolysis due to an increased NADH:NAD+ ratio may lead to an imbalance between metabolic demand and supply, resulting in cellular damage. Sensing of this ratio by CtBPs, and the subsequent regulation of p53, matches metabolic demand with supply and reduces cellular damage. In the absence of functional p53, cells continue to proliferate in adverse microenvironments despite metabolic imbalances, and surviving cells acquire further mutations resulting in tumor progression.

Similar articles

Cited by

References

    1. Warburg O. On the origin of cancer cells. Science. 1956;123:309–314. - PubMed
    1. Schulze A, Harris AL. How cancer metabolism is tuned for proliferation and vulnerable to disruption. Nature. 2012;491:364–373. - PubMed
    1. Mullarky E, Cantley LC. In: Innovative Medicine: Basic Research and Development. Nakao K, Minato N, Uemoto S, editors. Tokyo: 2015. pp. 3–23. - PubMed
    1. Pavlova NN, Thompson CB. The Emerging Hallmarks of Cancer Metabolism. Cell Metab. 2016;23:27–47. - PMC - PubMed
    1. Lehninger AL, Nelson DL, Cox MM. Principles of Biochemistry. ed. 2. Worth; New York: 1992.

Publication types