. 2020 Jun 3;40(23):4565-4575.
doi: 10.1523/JNEUROSCI.0216-20.2020. Epub 2020 May 5.

Pupil Diameter Tracks Statistical Structure in the Environment to Increase Visual Sensitivity

Affiliations

Pupil Diameter Tracks Statistical Structure in the Environment to Increase Visual Sensitivity

Caspar M Schwiedrzik et al. J Neurosci. .

Abstract

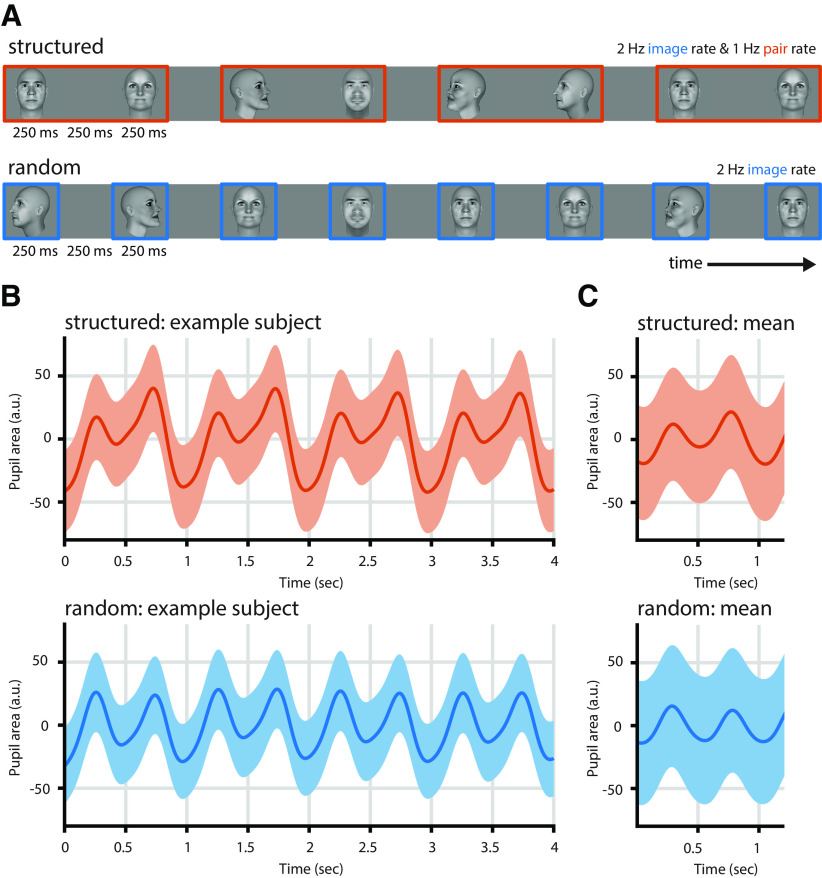
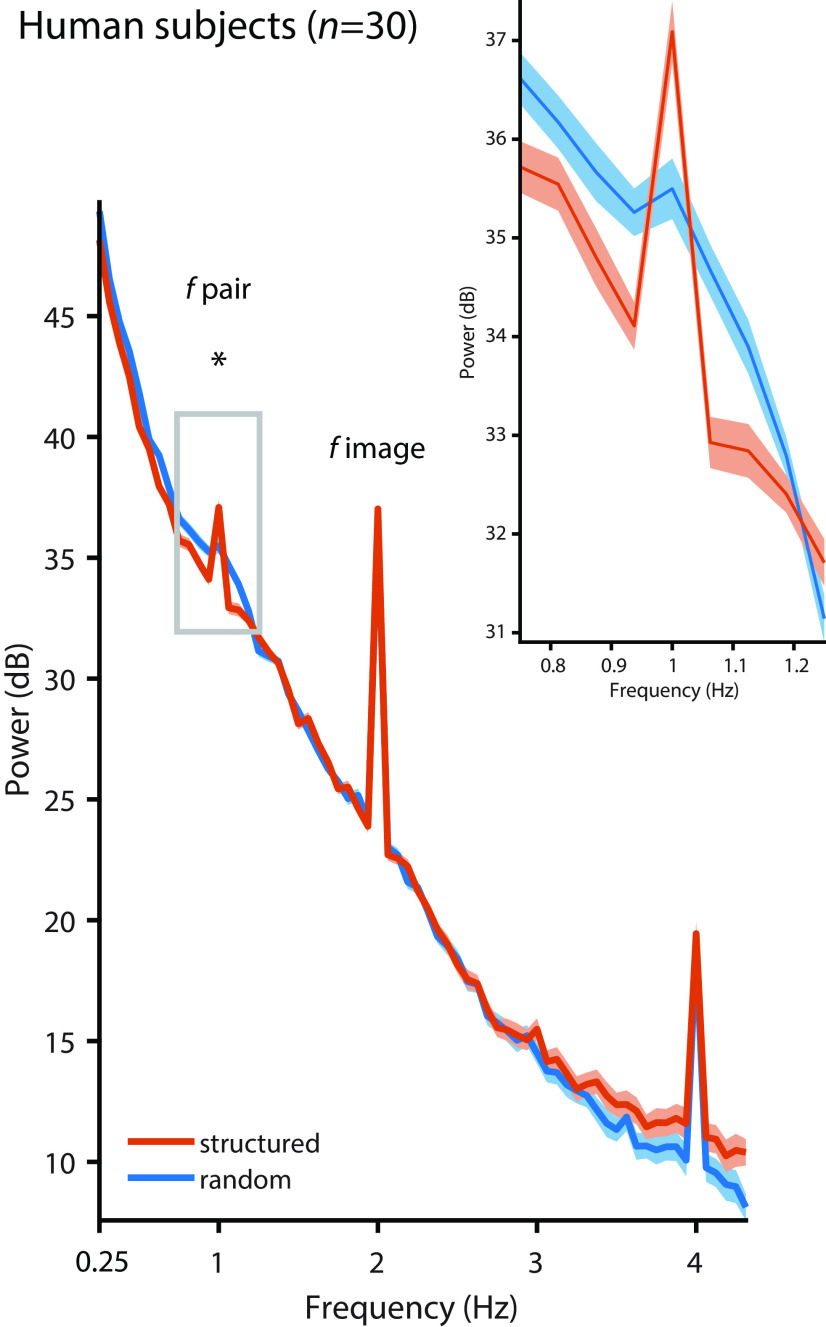
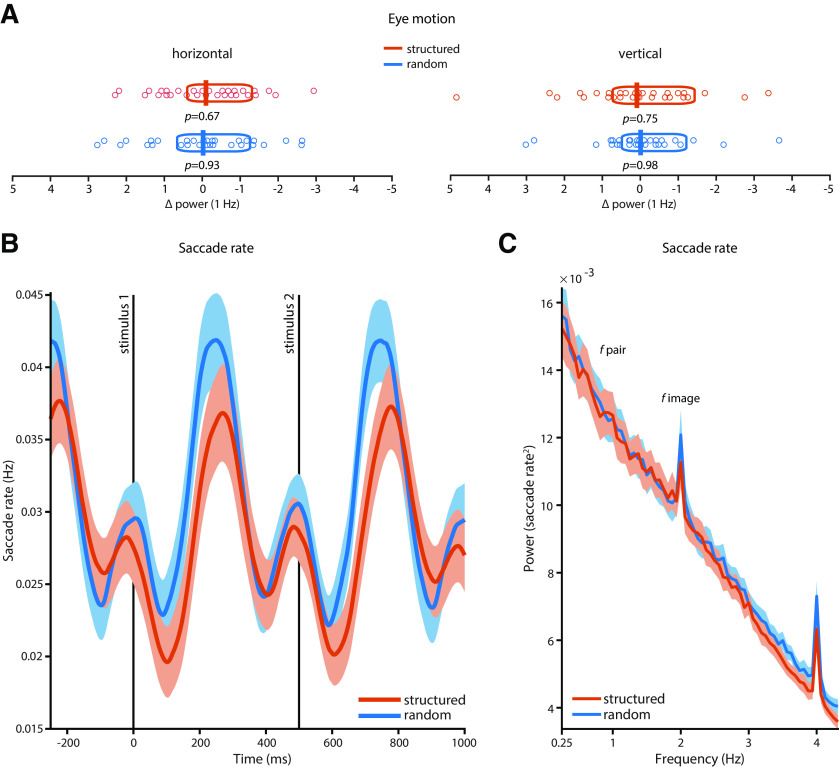
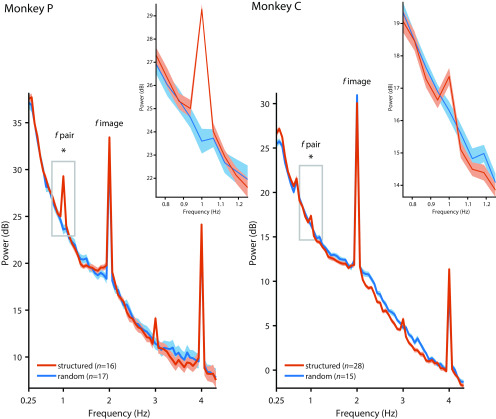
Pupil diameter determines how much light hits the retina and, thus, how much information is available for visual processing. This is regulated by a brainstem reflex pathway. Here, we investigate whether this pathway is under the control of internal models about the environment. This would allow adjusting pupil dynamics to environmental statistics to augment information transmission. We present image sequences containing internal temporal structure to humans of either sex and male macaque monkeys. We then measure whether the pupil tracks this temporal structure not only at the rate of luminance variations, but also at the rate of statistics not available from luminance information alone. We find entrainment to environmental statistics in both species. This entrainment directly affects visual processing by increasing sensitivity at the environmentally relevant temporal frequency. Thus, pupil dynamics are matched to the temporal structure of the environment to optimize perception, in line with an active sensing account.SIGNIFICANCE STATEMENT When light hits the retina, the pupil reflexively constricts. This determines how much light and thus how much information is available for visual processing. We show that the rate at which the pupil constricts and dilates is matched to the temporal structure of our visual environment, although this information is not directly contained in the light variations that usually trigger reflexive pupil constrictions. Adjusting pupil diameter in accordance with environmental regularities optimizes information transmission at ecologically relevant temporal frequencies. We show that this is the case in humans and macaque monkeys, suggesting that the reflex pathways that regulate pupil diameter are under some degree of cognitive control across primate species.

Keywords: active sensing; primate; pupil; statistical learning.


Figures

Figure 1.
Figure 1.
Paradigm and pupil entrainment. A, We presented sequences of faces in structured or random order. In the random condition, faces were shown in random order at 2 Hz, the image rate. In the structured condition, faces were shown at the same rate (2 Hz). To induce statistical structure, images were grouped into pairs, such that one particular image always followed on another particular image. This gives rise to the pair rate at 1 Hz. B, Pupil entrainment was evident at the single-subject level (here: mean over 83 trials). The structured condition (orange) shows a clear modulation at the 2 Hz image rate and slower dynamics, including the pair rate at 1 Hz. The predominant frequency in the random condition (blue) is the image rate (2 Hz). C, Pupil entrainment at 1 and 2 Hz is also clearly evident when averaged across all runs and subjects. In B and C, gray vertical lines indicate image onsets, shading represents the SEM, and data are lightly detrended.
Figure 2.
Figure 2.
Pupil diameter in humans. Pupil diameter in human subjects (n = 30) followed the image rate at 2 Hz in the random condition (blue, t(29) = 13.494, p < 0.001, g = 2.140) and the structured condition (orange, t(29) = 15.018, p < 0.001, g = 2.314; compared with the mean of the four surrounding frequencies), but the pair rate at 1 Hz was only evident in the structured condition (structured vs random: t(29) = 3.451, p = 0.002, g = 0.449). The inset shows a zoomed version of the power spectrum at ∼1 Hz. Peaks at 4 Hz likely reflect harmonics. Shading represents the SEM across subjects, corrected for intersubject variability (Morey, 2008). Asterisk indicates statistical significance at p < 0.05 for the contrast structured vs. random condition.
Figure 3.
Figure 3.
Eye motion in humans. A, There were no statistically significant peaks at 1 Hz in the dynamics of horizontal or vertical eye position in the random or structured condition in human subjects (n = 30) relative to the four surrounding frequency bins. Vertical bars indicate the mean; boxes indicate the 95% Bayes-bootstrapped high-density interval; circles indicate the individual subjects' data points; and p values are from paired, two-sided t tests of 1 Hz power against the average of four surrounding frequency bins (all p > 0.6). B, Saccade rates time locked to the onset of the first stimulus in a pair showed no statistically significant differences between the structured and the random condition on a time point-by-time point basis (all p > 0.05, FDR corrected). C, There was no entrainment of saccade rates at the pair rate (1 Hz); i.e., there was no distinct peak at 1 Hz compared with the surrounding bins in the structured condition (t(29) = 1.7532, p = 0.0901, g = 0.0434) or in the random condition (t(29) = 0.6698, p = 0.5083, g = 0.0195). Power at 1 Hz also did not differ between the structured and random conditions (mean difference, −0.0001; t(29) = −0.1042; p = 0.9178; g = −0.0131). Shading in B and C represents the SEM across subjects, corrected for intersubject variability (Morey, 2008).
Figure 4.
Figure 4.
Pupil diameter in monkeys. Pupil diameter in monkeys followed the image rate at 2 Hz in the random (blue) and the structured (orange) conditions, but the pair rate at 1 Hz was only evident in the structured condition (structured vs random: monkey P: t(31) = 10.37, p < 0.001, g = 3.524; monkey C: t(41) = 2.327, p = 0.025, g = 0.731). The inset show a zoomed-in version of the power spectrum at ∼1 Hz. Peaks at 3 and 4 Hz likely reflect harmonics of the 1 and 2 Hz response, respectively. Shading represents the SEM across sessions. Asterisk indicates statistical significance at p < 0.05 for the contrast structured vs. random condition.
Figure 5.
Figure 5.
Eye motion in monkeys. There were no statistically significant peaks at 1 Hz in the dynamics of horizontal or vertical eye position in the random or structured condition in monkey P and monkey C relative to the four surrounding frequency bins. Horizontal bars indicate the mean; boxes indicate the 95% Bayes-bootstrapped high-density interval; circles indicate the data points of individual runs; p values are from paired, two-sided t tests of 1 Hz power against the average of four surrounding frequency bins (all p > 0.3).
Figure 6.
Figure 6.
Offline learning test and relation to pupil entrainment. A, On each trial of the RSVP task, subjects had to detect a target face. Targets were embedded into a stream of faces (250 ms on, 250 ms off). The face immediately preceding the target could be the previously exposed predictor (“exposed” condition, black), an identity or a head orientation that had been paired with another face during the exposure phase (foil condition, green), or a completely novel identity (novel condition, blue). B, Human subjects were more accurate (exposed vs foil: t(29) = 2.928, p = 0.007, g = 0.376; exposed vs novel: t(29) = 4.715, p < 0.001, g = 0.962) and faster (exposed vs foil: t(29) = −4.522, p < 0.001, g = −0.266; exposed vs novel: t(29) = −5.464, p < 0.001, g = −0.403) in detecting the target when it was preceded by the previously exposed predictor than in the foil or the novel conditions. Horizontal bars indicate the mean, boxes indicate the 95% Bayes-bootstrapped high-density interval, and circles indicate the individual subjects' data points (n = 30). C, Pupil entrainment at the 1 Hz pair rate during the exposure phase (normalized against the mean of the four surrounding frequencies) predicted offline learning effects: the stronger the entrainment at 1 Hz, the larger the accuracy benefit in the exposed over the foil condition (r = 0.481, p = 0.007) and the novel condition (r = 0.402, p = 0.027).
Figure 7.
Figure 7.
Effects of pupil entrainment to higher-order environmental structure on visual sensitivity. A, Subjects (n = 10) had to detect a small, foveally presented disk that could appear either within or between pairs in the structured condition, or at temporally matched time points in the random condition (in the absence of statistical structure and 1 Hz pupil entrainment). The luminance contrast level required to detect the disk was used as a measure of visual sensitivity. B, Luminance contrast required to detect the discs was significantly higher between pairs than within pairs, particularly in the structured condition (condition × time point interaction: F(1,9) = 6.943, p = 0.027, η2 = 0.435). There was no significant difference in luminance contrast between the random and the structured conditions between pairs (t(9) = 1.298, p = 0.226, g = 0.306), but only within pairs (t(9) = 3.818, p = 0.004, g = 0.654), reflecting wider pupil diameter as a result of 1 Hz entrainment in the structured condition. Horizontal bars indicate the mean, boxes indicate the 95% Bayes-bootstrapped high-density interval, and circles indicate the individual subjects' data points (n = 10).

References

    1. Alamia A, VanRullen R, Pasqualotto E, Mouraux A, Zenon A (2019) Pupil-linked arousal responds to unconscious surprisal. J Neurosci 39:5369–5376. 10.1523/JNEUROSCI.3010-18.2019 - DOI - PMC - PubMed
    1. Alexandridis E, Manner M (1977) Folgefrequenz der Pupille bei flimmernden Lichtreizen [Frequency of the pupillary response following flicker stimuli (Author's Transl)]. Albrecht Von Graefes Arch Klin Exp Ophthalmol 202:175–180. 10.1007/BF00407866 - DOI - PubMed
    1. Barbur JL, Harlow AJ, Sahraie A (1992) Pupillary responses to stimulus structure, colour and movement. Ophthalmic Physiol Opt 12:137–141. 10.1111/j.1475-1313.1992.tb00276.x - DOI - PubMed
    1. Barczak A, O'Connell MN, McGinnis T, Ross D, Mowery T, Falchier A, Lakatos P (2018) Top-down, contextual entrainment of neuronal oscillations in the auditory thalamocortical circuit. Proc Natl Acad Sci U S A 115:E7605–E7614. 10.1073/pnas.1714684115 - DOI - PMC - PubMed
    1. Benjamini Y, Yekutieli D (2001) The control of the false discovery rate in multiple testing under dependency. Ann Stat 29:1165–1188.

Publication types

LinkOut - more resources