. 2020 Jun 24;40(26):5051-5062.
doi: 10.1523/JNEUROSCI.2618-19.2020. Epub 2020 May 5.

Identification of an Amygdala-Thalamic Circuit That Acts as a Central Gain Mechanism in Taste Perceptions

Affiliations

Identification of an Amygdala-Thalamic Circuit That Acts as a Central Gain Mechanism in Taste Perceptions

Maria G Veldhuizen et al. J Neurosci. .

Abstract

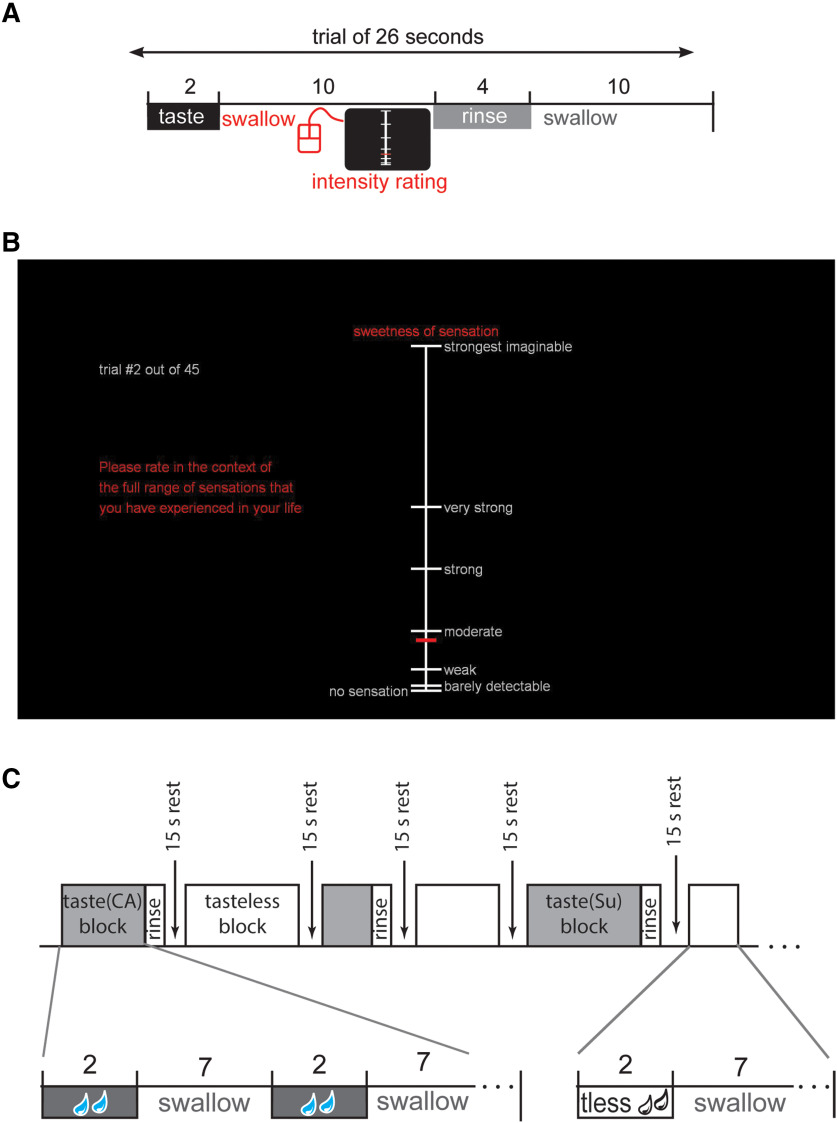
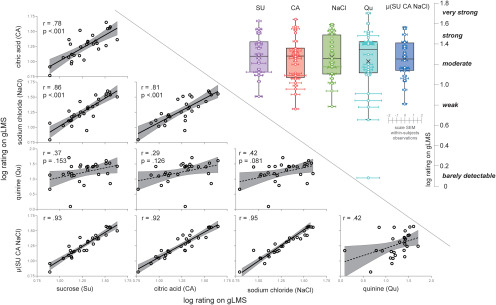
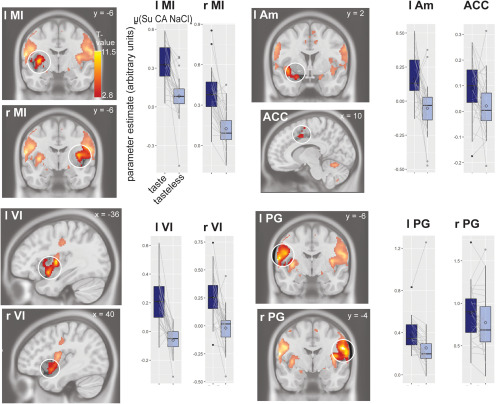
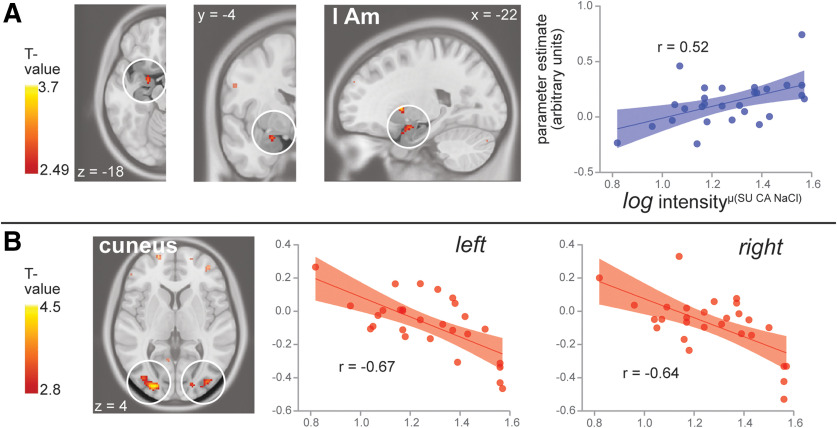
Peripheral sources of individual variation in taste intensity perception have been well described. The existence of a central source has been proposed but remains unexplored. Here we used functional magnetic resonance imaging in healthy human participants (20 women, 8 men) to evaluate the hypothesis that the amygdala exerts an inhibitory influence that affects the "gain" of the gustatory system during tasting. Consistent with the existence of a central gain mechanism (CGM), we found that central amygdala response was correlated with mean intensity ratings across multiple tastants. In addition, psychophysiological and dynamic causal modeling analyses revealed that the connection strength between inhibitory outputs from amygdala to medial dorsal and ventral posterior medial thalamus predicted individual differences in responsiveness to taste stimulation. These results imply that inhibitory inputs from the amygdala to the thalamus act as a CGM that influences taste intensity perception.SIGNIFICANCE STATEMENT Whether central circuits contribute to individual variation in taste intensity perception is unknown. Here we used functional magnetic resonance imaging in healthy human participants to identify an amygdala-thalamic circuit where network dynamics and connectivity strengths during tasting predict individual variation in taste intensity ratings. This finding implies that individual differences in taste intensity perception do not arise solely from variation in peripheral gustatory factors.

Keywords: amygdala; fMRI; gustation; perception; taste intensity; thalamus.


Figures

Figure 1.
Figure 1.
Overview of task design. A, Chronological events and their duration in a trial during the taste psychophysics session. Each trial commenced with a taste delivery of.5 ml over 2 s. The participant was instructed to swallow immediately after receiving each liquid and then rate the intensity of taste. The intensity scale disappeared from the screen after ∼7 s or as soon as the rating was submitted by clicking a mouse button, whichever occurred first. Then a water rinse of 1 ml was presented over 4 s, followed by a rest period of 10 s before the next trial started, except after the tasteless stimulus, which was immediately followed by the next trial. B, The gLMS that was used for measuring perceived taste intensity. The specific taste quality to be rated (e.g., “sweetness” for sucrose and “saltiness” for sodium chloride) was indicated above the scale. When a participant received the tasteless solution the label was “overall intensity,” since no specific taste quality is associated with this stimulus. Participants used a scanner-compatible handheld trackball mouse to make ratings. The horizontal red cursor tracks up and down the scale with vertical mouse position, and clicking the left mouse button submitted the rating. A new gLMS then appeared on the screen to rate the next taste stimulus. C, Chronological events during a run in the fMRI session. Each block consisted of four, six, of eight repeats of a taste stimulus. Each repeat consists of a taste stimulus presentation over 2 s (0.5 ml), followed by a 7 s interval for swallowing. At the end of each block, a water rinse is presented over 4 s (1 ml), followed by a 15 s rest period before the start of the next block. Tasteless blocks are identical except that there is no water rinse before the 15 s rest period. Each run contained four taste blocks (one for each taste quality) and four tasteless blocks. No intensity ratings were made during the fMRI run.
Figure 2.
Figure 2.
Taste intensity ratings. Below the diagonal: scatterplots of log-transformed intensity ratings on the gLMS for all tastant pairs and each tastant with the average of the three significantly correlated tastants (from top to bottom: citric acid, sodium chloride, quinine, and mean log intensityμ(Su CA NaCl); from left to right sucrose, citric acid, sodium chloride, quinine). Each datapoint represents one participant. Above the diagonal, The boxplots indicate central tendencies and spread of the log-transformed intensity rating (y-axis on far right), as follows: average (represented by a cross symbol), median (middle bar in box), first and third quartiles (lower and upper hinge), 1.5 × the interquartile range (top and bottom whiskers) and outlying points (separate dots outside the whiskers). We overlaid individual data points (one for each participant) on the boxplots with within-participant SEM of the average of eight ratings they gave for each tastant represented as horizontal error bars. From left to right, the boxplots represent the following: sucrose, citric acid, sodium chloride, quinine, and mean log intensityμ(Su CA NaCl). For interpretation, gLMS label placement is given on the y-axis on the far right.
Figure 3.
Figure 3.
Neural response to taste(μ Su CA NaCl)-tasteless in insula, pre- and post-central gyrus, amygdala, and anterior cingulate cortex (ACC; key: r, right; l, left; MI, middle insula; VI, ventral insula; PG, pre- and post-central gyrus; AM, amygdala; ACC, anterior cingulate cortex). Sections (slice location indicated in MNI coordinates) show canonical anatomic template with SPM T-map overlaid, thresholded at puncorrected < 0.005, and a minimum of five contiguous voxels. The color gradient scale depicts suprathreshold t values. Boxplot graphs show median (center line), mean (diamond), first and third quartiles (lower and upper hinge), 1.5 × the interquartile range (top and bottom whiskers), and outlying points (separate dots outside the whiskers). We plotted parameter estimate of the peak voxels within a significant cluster for the average of taste(μ Su CA NaCl)-tasteless. We overlaid individual data points on the boxplots and connected the dots of an individual participant between the taste and tasteless bars to make it easier to inspect the difference within a single participant.
Figure 4.
Figure 4.
Neural response to taste(μ Su CA NaCl)-tasteless correlated with mean log intensityμ(Su CA NaCl) in A, left amygdala (AM), and B, bilateral cuneus. Brain slices are as described in Figure 3. Scatterplots show each participant's values, with mean log intensityμ(Su CA NaCl) on the x-axis and parameter estimate on the y-axis for the peak voxel within a significant cluster. Regression line with regression coefficient and 95% confidence interval bands are overlaid for illustrative purposes. Positive associations are shown in blue, and negative associations are shown in red.
Figure 5.
Figure 5.
Connectivity correlated with mean log intensityμ(Su CA NaCl). A, Connectivity parameter estimates from PPI analysis between seed region in left amygdala (am) and regions in thalamus (md and vpm/pul) that correlated with log mean intensityμ(Su CA NaCl). Brain sections are as described in Figure 3, and scatterplots are as described in Figure 4. B, Connectivity Bayesian estimates in the DCM of the amygdala and thalamus areas. The gradient of arrows indicates the estimates for connection strengths (positive in orange or negative in blue) between regions for any connections with a posterior probability of p > 0.95. The scatterplot shows each participant's values from the multivariate LOOCV regression, with mean log intensityμ(Su CA NaCl) on the x-axis and connectivity parameter estimate of the multivariate linear DCM model on the y-axis. The regression line with regression coefficient and 95% confidence interval bands is overlaid for illustrative purposes. Asterisks in the model indicate the connection that survived univariate LOOCV regression.

Comment in

Similar articles

Cited by

References

    1. Adolphs R, Tranel D, Damasio H, Damasio A (1994) Impaired recognition of emotion in facial expressions following bilateral damage to the human amygdala. Nature 372:669–672. 10.1038/372669a0 - DOI - PubMed
    1. Aggleton JP, Burton MJ, Passingham RE (1980) Cortical and subcortical afferents to the amygdala of the rhesus monkey (Macaca mulatta). Brain Res 190:347–368. 10.1016/0006-8993(80)90279-6 - DOI - PubMed
    1. Aggleton JP, Mishkin M (1984) Projections of the amygdala to the thalamus in the cynomolgus monkey. J Comp Neurol 222:56–68. 10.1002/cne.902220106 - DOI - PubMed
    1. Allen AL, McGeary JE, Hayes JE (2014) Polymorphisms in TRPV1 and TAS2Rs associate with sensations from sampled ethanol. Alcohol Clin Exp Res 38:2550–2560. 10.1111/acer.12527 - DOI - PMC - PubMed
    1. Amunts K, Lepage C, Borgeat L, Mohlberg H, Dickscheid T, Rousseau M-É, Bludau S, Bazin P-L, Lewis LB, Oros-Peusquens A-M, Shah NJ, Lippert T, Zilles K, Evans AC (2013) BigBrain: an ultrahigh-resolution 3D human brain model. Science 340:1472–1475. 10.1126/science.1235381 - DOI - PubMed

Publication types