. 2020 May 5;10(1):7595.
doi: 10.1038/s41598-020-64617-w.

18F-FDG positron emission tomography and diffusion-weighted magnetic resonance imaging for response evaluation of nanoparticle-mediated photothermal therapy

Affiliations

18F-FDG positron emission tomography and diffusion-weighted magnetic resonance imaging for response evaluation of nanoparticle-mediated photothermal therapy

Marina Simón et al. Sci Rep. .

Abstract

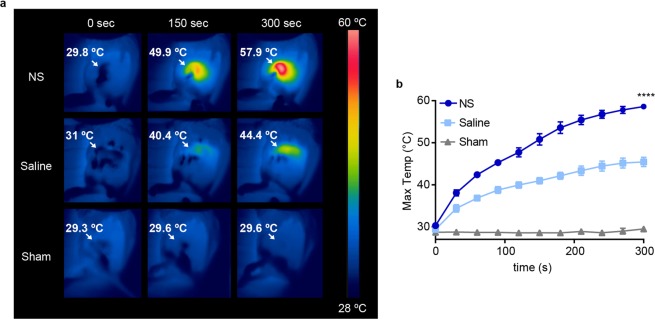
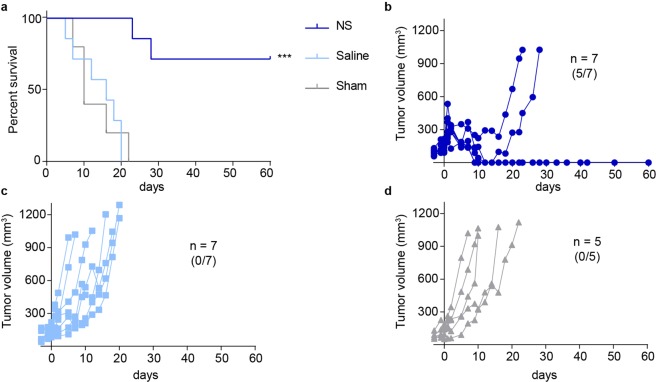
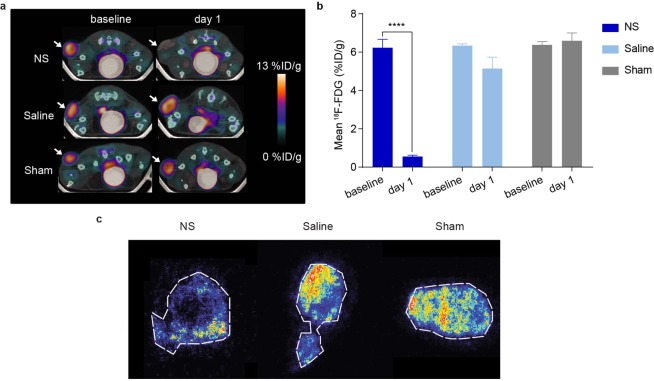
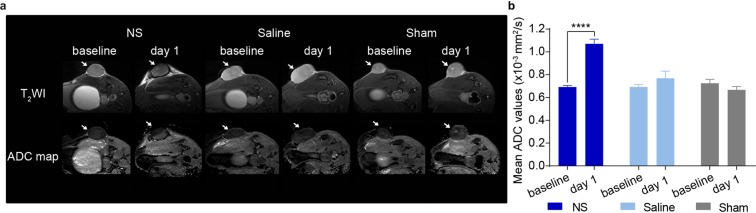
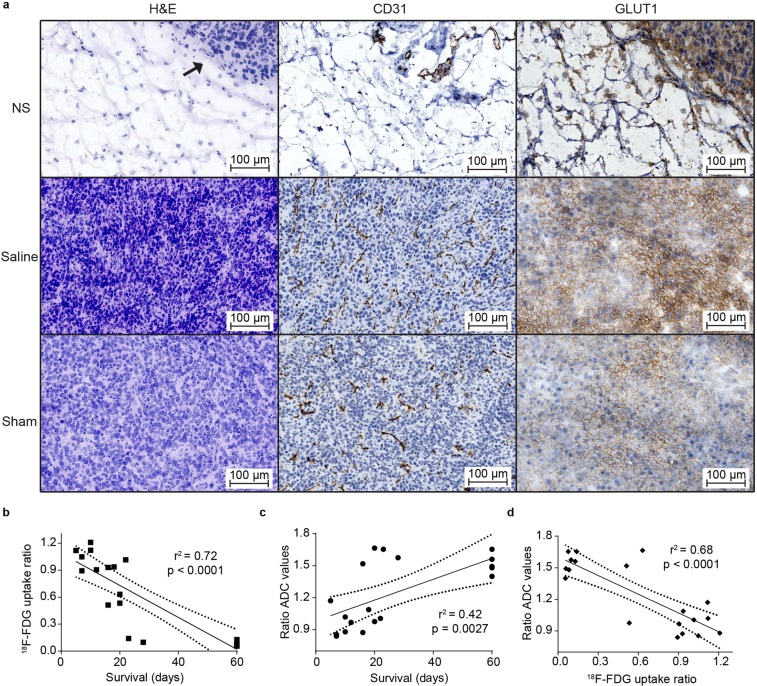
Nanoparticle-mediated photothermal cancer therapy (PTT) is a treatment which creates localized damage to tumors via nanoparticles that generate heat when irradiated with near infrared light. Substantial work has been dedicated to developing efficient heat-transducing nanoparticles that can be delivered systemically to the tumor. However, less attention has been given to clinically relevant assessment methods of treatment outcome that could be used for personalizing the therapy. Here, we compare 18F-FDG positron emission tomography combined with computed tomography (PET/CT) and diffusion-weighted imaging (DWI) for early evaluation and prognosis of PTT in tumor-bearing mice using silica-gold nanoshells (NS). The NS-treated mice experienced inhibited tumor growth and significantly prolonged survival compared to control mice. One day after PTT, PET/CT and DWI scans showed a decrease in tumor 18F-FDG uptake of ~90% and an increase of ~50% in apparent diffusion coefficient (ADC) values respectively, compared to baseline. No significant changes were observed for control groups. Additionally, the changes in 18F-FDG uptake and ADC values correlated significantly with survival, demonstrating that both methods can be used for early evaluation of PTT although 18F-FDG PET/CT showed the strongest prognostic value. Based on these results, both modalities should be considered for therapy monitoring of PTT when clinically translated.


Conflict of interest statement

The authors declare no competing interests.

Figures

Figure 1
Figure 1
Temperature changes on tumor surface during laser irradiation. (a) Representative thermographic images of NS, saline, and sham-treated tumors at three different time points during laser treatment. White arrows point to the tumors and the maximum temperature measured in the frame is given. (b) Maximum temperature on the tumor surface during the treatment. Data shown is mean ± SEM. (standard error of the mean). **** denotes p < 0.0001 vs. both saline and sham. NS group; n = 7, Saline group; n = 7, sham group; n = 5.
Figure 2
Figure 2
Evaluation of PTT by tumor growth and survival. (a) Overall survival for NS (n = 7), saline (n = 7) and sham (n = 5) groups. *** denotes p value <0.001 vs. both saline and sham groups. (b) Tumor growth for the NS group. 5 out of 7 mice experienced tumor regression up until day 60, when the study was terminated. (c,d) Tumor growth curves for saline and sham groups, respectively. No mice experienced tumor regression in these groups.
Figure 3
Figure 3
18F-FDG PET/CT for early evaluation of PTT. (a) Representative 18F-FDG PET/CT images of NS (n = 7), saline (n = 7) and sham (n = 5) treated mice before and after PTT. White arrows point to the tumors. (b) The mean 18F-FDG tumor uptake at baseline and day 1. **** denotes p value <0.0001. Data shown is mean ± SEM. (c) Autoradiography of NS, saline and sham tumors one day after PTT (n = 2 for each group).
Figure 4
Figure 4
DWI for early evaluation of PTT. (a) Representative T2WI and ADC maps of NS (n = 7), saline (n = 7) and sham (n = 5) treated animals at baseline and after treatment (day 1). White arrows point to the tumors. (b) The mean ADC values at baseline and day 1. **** denotes p value <0.0001. Data shown is mean ± SEM.
Figure 5
Figure 5
Correlation between treatment-induced changes in the18F-FDG uptake and ADC values and survival length. (a) Representative images of the H&E (left), CD31 (middle), and GLUT1 (right) staining of tumors from the NS, saline and sham groups one day after PTT (n = 2 for each group). In the H&E staining, the arrow on the NS tumor points to the border between healthy and necrotic tumor tissue. The brown color indicates CD31 and GLUT1 positive cells. (b) Correlation between the ratio of 18F-FDG uptake and days of survival. (c) Correlation between the ratio of ADC values and days of survival. (d) Correlation between the ratio of ADC values and 18F-FDG uptake. (b–d) n = 19.

Similar articles

Cited by

References

    1. Basu S, et al. Fundamentals of PET and PET/CT imaging. Ann. N. Y. Acad. Sci. 2011;1228:1–18. doi: 10.1111/j.1749-6632.2011.06077.x. - DOI - PubMed
    1. Fischer BM, et al. PET/CT is a cost-effective tool against cancer: synergy supersedes singularity. Eur. J. Nucl. Med. Mol. Imaging. 2016;43:1749–1752. doi: 10.1007/s00259-016-3414-5. - DOI - PMC - PubMed
    1. Marcu LG, Moghaddasi L, Bezak E. Imaging of Tumor Characteristics and Molecular Pathways With PET: Developments Over the Last Decade Toward Personalized Cancer Therapy. Int. J. Radiat. Oncol. 2018;102:1165–1182. doi: 10.1016/j.ijrobp.2018.04.055. - DOI - PubMed
    1. de Melo-Diogo, D., Pais-Silva, C., Dias, D. R., Moreira, A. F. & Correia, I. J. Strategies to Improve Cancer Photothermal Therapy Mediated by Nanomaterials. Adv. Healthc. Mater. 6, (2017). - PubMed
    1. Jaque D, et al. Nanoparticles for photothermal therapies. Nanoscale. 2014;6:9494–530. doi: 10.1039/C4NR00708E. - DOI - PubMed

Publication types

MeSH terms

Substances