

Characterization of experimental diabetic neuropathy using multicontrast magnetic resonance neurography at ultra high field strength
- PMID: 32371885
- PMCID: PMC7200726
- DOI: 10.1038/s41598-020-64585-1
Characterization of experimental diabetic neuropathy using multicontrast magnetic resonance neurography at ultra high field strength
Abstract
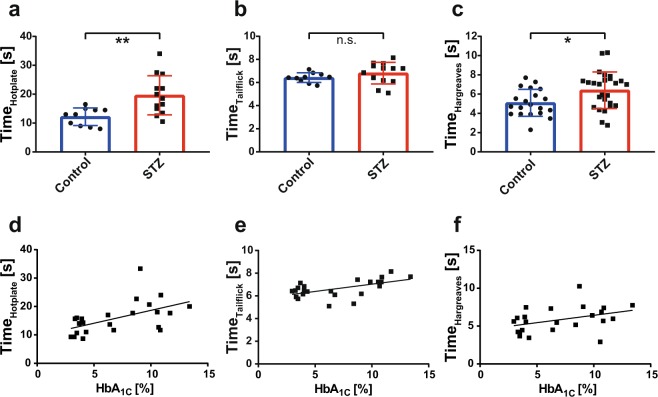
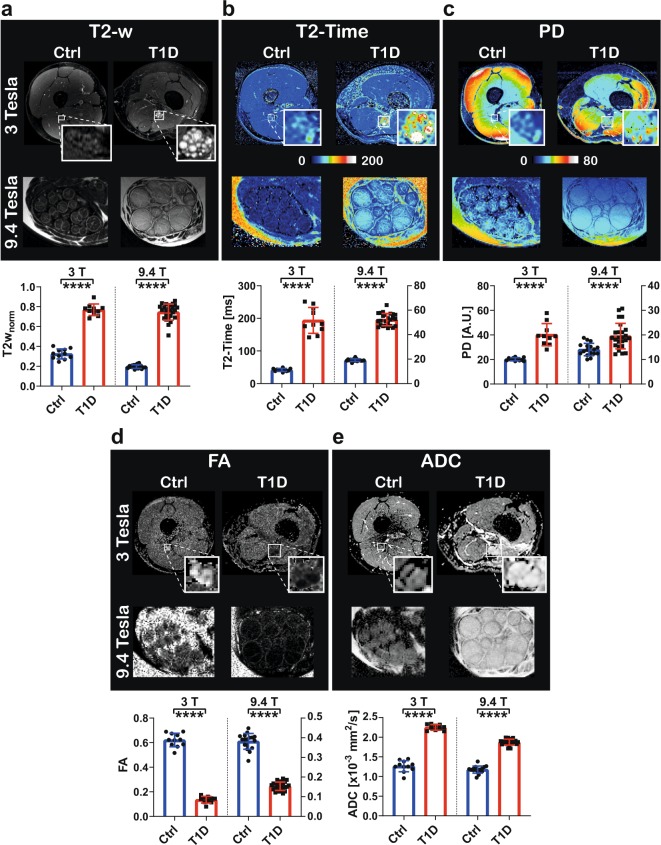
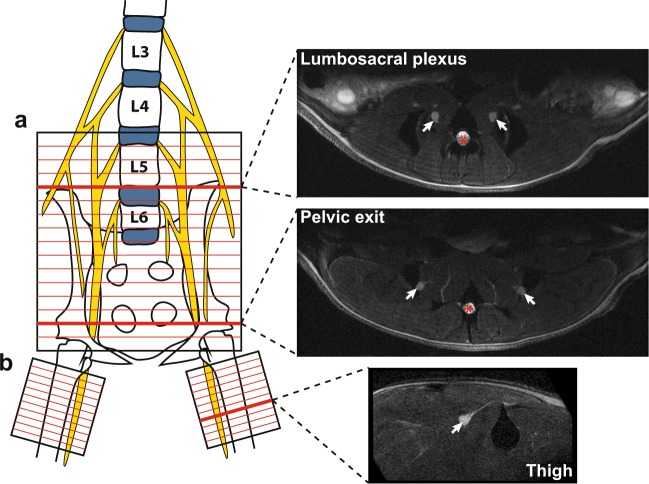
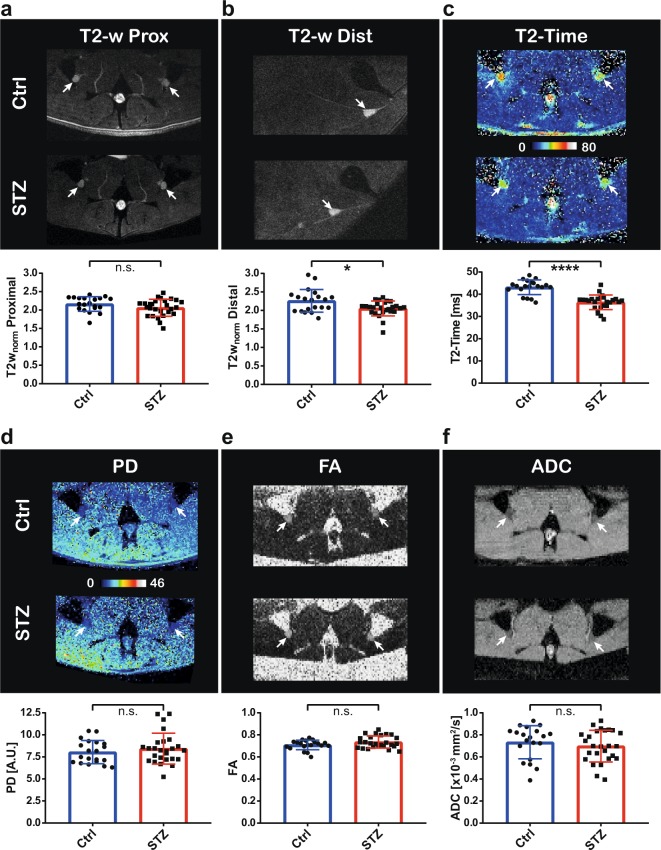
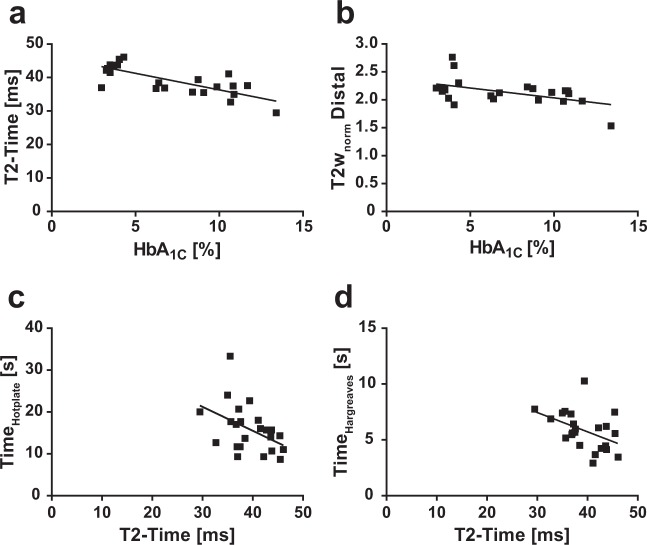
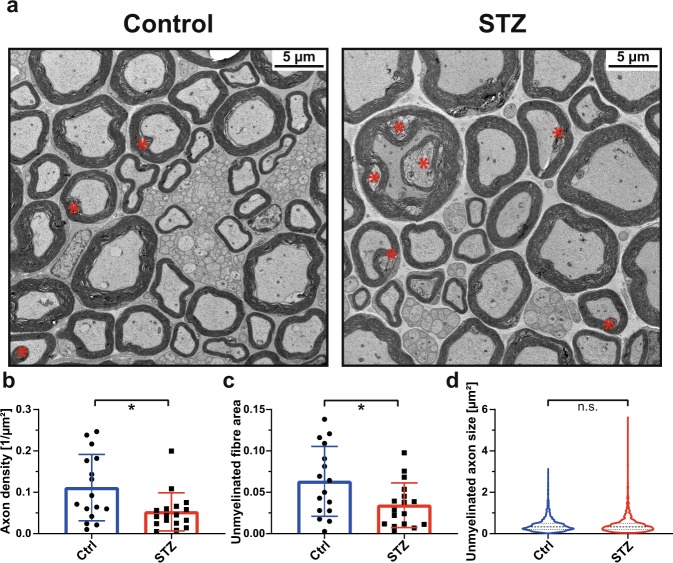
In light of the limited treatment options of diabetic polyneuropathy (DPN) available, suitable animal models are essential to investigate pathophysiological mechanisms and to identify potential therapeutic targets. In vivo evaluation with current techniques, however, often provides only restricted information about disease evolution. In the study of patients with DPN, magnetic resonance neurography (MRN) has been introduced as an innovative diagnostic tool detecting characteristic lesions within peripheral nerves. We developed a novel multicontrast ultra high field MRN strategy to examine major peripheral nerve segments in diabetic mice non-invasively. It was first validated in a cross-platform approach on human nerve tissue and then applied to the popular streptozotocin(STZ)-induced mouse model of DPN. In the absence of gross morphologic alterations, a distinct MR-signature within the sciatic nerve was observed mirroring subtle changes of the nerves' fibre composition and ultrastructure, potentially indicating early re-arrangements of DPN. Interestingly, these signal alterations differed from previously reported typical nerve lesions of patients with DPN. The capacity of our approach to non-invasively assess sciatic nerve tissue structure and function within a given mouse model provides a powerful tool for direct translational comparison to human disease hallmarks not only in diabetes but also in other peripheral neuropathic conditions.
Conflict of interest statement
The authors declare no competing interests.
Figures

Similar articles
-
Magnetic Resonance Neurography Visualizes Abnormalities in Sciatic and Tibial Nerves in Patients With Type 1 Diabetes and Neuropathy.Diabetes. 2017 Jul;66(7):1779-1788. doi: 10.2337/db16-1049. Epub 2017 Apr 21. Diabetes. 2017. PMID: 28432188
-
Structural Nerve Remodeling at 3-T MR Neurography Differs between Painful and Painless Diabetic Polyneuropathy in Type 1 or 2 Diabetes.Radiology. 2020 Feb;294(2):405-414. doi: 10.1148/radiol.2019191347. Epub 2019 Dec 31. Radiology. 2020. PMID: 31891321
-
Diffusion tensor imaging MR Neurography detects polyneuropathy in type 2 diabetes.J Diabetes Complications. 2020 Feb;34(2):107439. doi: 10.1016/j.jdiacomp.2019.107439. Epub 2019 Sep 12. J Diabetes Complications. 2020. PMID: 31672457
-
Peripheral Neuropathy in Mouse Models of Diabetes.Curr Protoc Mouse Biol. 2016 Sep 1;6(3):223-255. doi: 10.1002/cpmo.11. Curr Protoc Mouse Biol. 2016. PMID: 27584552 Free PMC article. Review.
-
Mouse models of diabetic neuropathy.ILAR J. 2014;54(3):259-72. doi: 10.1093/ilar/ilt052. ILAR J. 2014. PMID: 24615439 Free PMC article. Review.
Cited by
-
Avoiding scar tissue formation of peripheral nerves with the help of an acellular collagen matrix.PLoS One. 2023 Aug 4;18(8):e0289677. doi: 10.1371/journal.pone.0289677. eCollection 2023. PLoS One. 2023. PMID: 37540691 Free PMC article.
-
Six-month periodic fasting does not affect somatosensory nerve function in type 2 diabetes patients.Front Endocrinol (Lausanne). 2023 May 12;14:1143799. doi: 10.3389/fendo.2023.1143799. eCollection 2023. Front Endocrinol (Lausanne). 2023. PMID: 37251671 Free PMC article. Clinical Trial.
-
Emerging Targets in Type 2 Diabetes and Diabetic Complications.Adv Sci (Weinh). 2021 Sep;8(18):e2100275. doi: 10.1002/advs.202100275. Epub 2021 Jul 28. Adv Sci (Weinh). 2021. PMID: 34319011 Free PMC article. Review.
-
Diffusion tensor imaging in anisotropic tissues: application of reduced gradient vector schemes in peripheral nerves.Eur Radiol Exp. 2024 Apr 2;8(1):37. doi: 10.1186/s41747-024-00444-2. Eur Radiol Exp. 2024. PMID: 38561526 Free PMC article.
-
Cutaneous innervation in impaired diabetic wound healing.Transl Res. 2021 Oct;236:87-108. doi: 10.1016/j.trsl.2021.05.003. Epub 2021 May 23. Transl Res. 2021. PMID: 34029747 Free PMC article. Review.
References
Publication types
MeSH terms
LinkOut - more resources
Full Text Sources
Medical
