. 2020 May 5;10(1):7581.
doi: 10.1038/s41598-020-64118-w.

The calcitonin-like system is an ancient regulatory system of biomineralization

Affiliations

The calcitonin-like system is an ancient regulatory system of biomineralization

João C R Cardoso et al. Sci Rep. .

Abstract

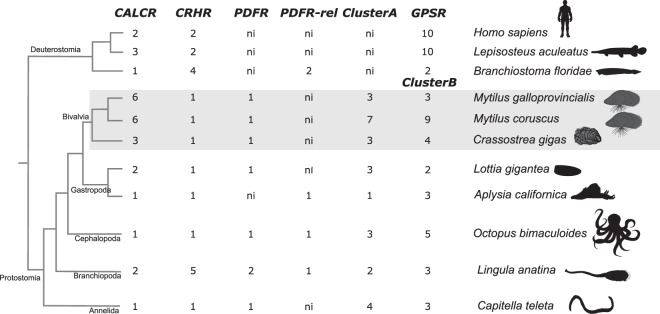
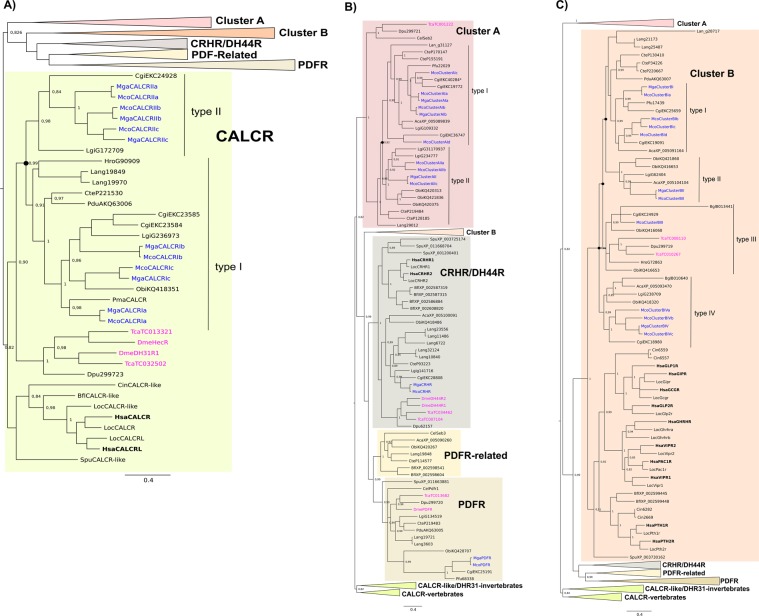
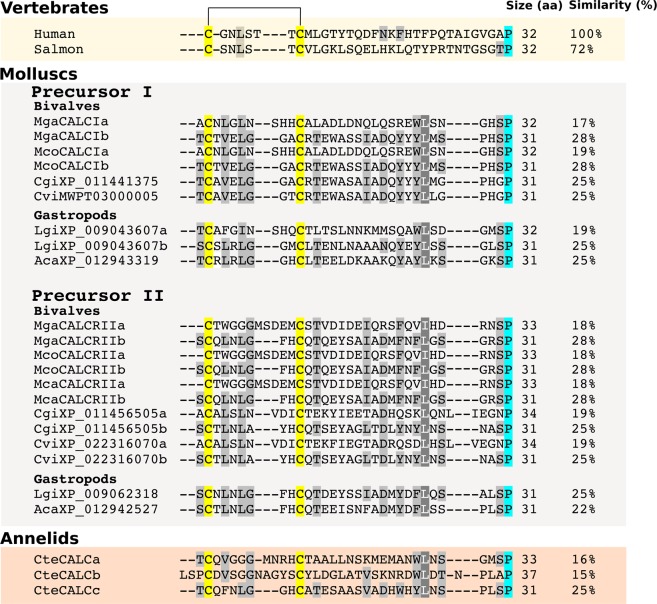
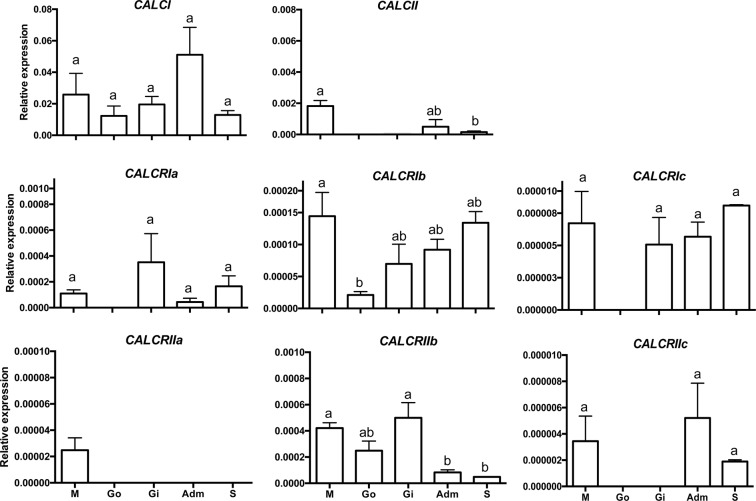
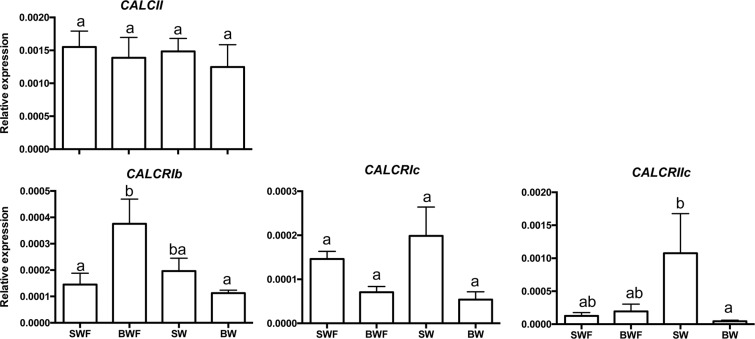
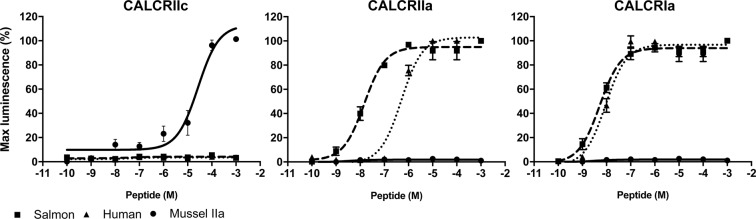
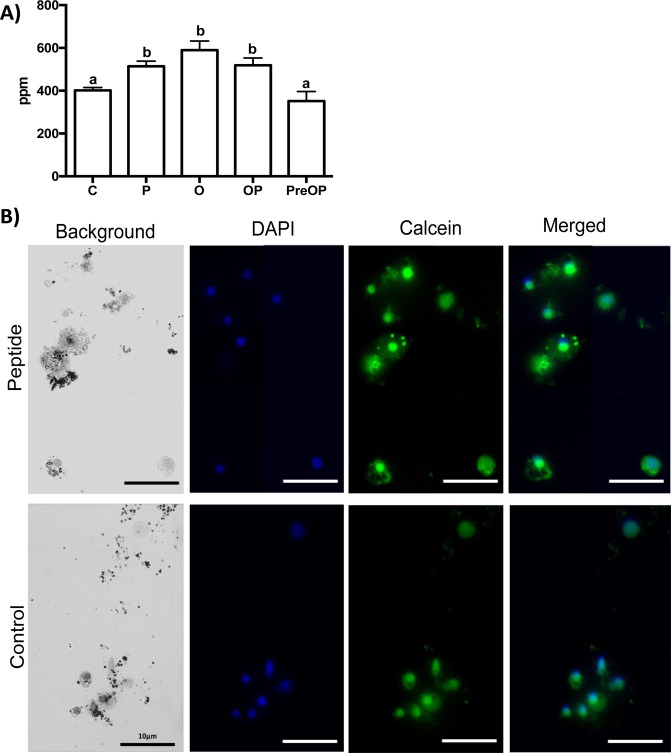
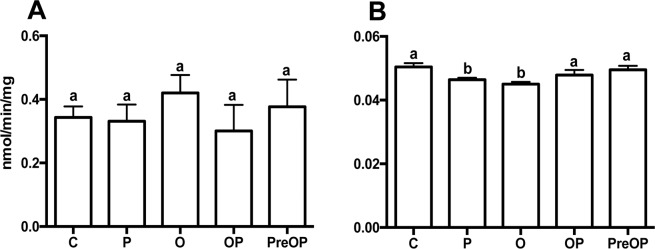
Biomineralization is the process by which living organisms acquired the capacity to accumulate minerals in tissues. Shells are the biomineralized exoskeleton of marine molluscs produced by the mantle but factors that regulate mantle shell building are still enigmatic. This study sought to identify candidate regulatory factors of molluscan shell mineralization and targeted family B G-protein coupled receptors (GPCRs) and ligands that include calcium regulatory factors in vertebrates, such as calcitonin (CALC). In molluscs, CALC receptor (CALCR) number was variable and arose through lineage and species-specific duplications. The Mediterranean mussel (Mytilus galloprovincialis) mantle transcriptome expresses six CALCR-like and two CALC-precursors encoding four putative mature peptides. Mussel CALCR-like are activated in vitro by vertebrate CALC but only receptor CALCRIIc is activated by the mussel CALCIIa peptide (EC50 = 2.6 ×10⁻⁵ M). Ex-vivo incubations of mantle edge tissue and mantle cells with CALCIIa revealed they accumulated significantly more calcium than untreated tissue and cells. Mussel CALCIIa also significantly decreased mantle acid phosphatase activity, which is associated with shell remodelling. Our data indicate the CALC-like system as candidate regulatory factors of shell mineralization. The identification of the CALC system from molluscs to vertebrates suggests it is an ancient and conserved calcium regulatory system of mineralization.


Conflict of interest statement

The authors declare no competing interests.

Figures

Figure 1
Figure 1
Number of Calcitonin receptors and other family B GPCRs in molluscs and other lophotrochozoans. Receptors were identified based on searches against available genomes and mussel (Mediterranean mussel, Mytilus galloprovincialis and hard-shelled mussel, Mytilus coruscus) mantle edge transcriptomes. Vertebrates (human, Homo sapiens, and spotted gar, Lepisosteus aculeatus) and invertebrate deuterostome (amphioxus, Branchiostoma floridae) family B GPCR members are represented for comparison. Family B GPCR subfamilies: Corticotropin-Releasing Hormone Receptor (CRHR), Pigment Dispersing Factor Receptor (PDFR), Pigment Dispersing Factor Receptor-related (PDFR-rel), Cluster A and Cluster B receptors. GPSR represents the deuterostome Glucagon (GCG), Parathyroid Hormone (PTH) and Secretin (SCT) receptor subfamilies that are homologues of the invertebrate Cluster B. A dendrogram depicting the current accepted evolutionary species relationship is represented. ni- not identified. Bivalves are highlighted in grey. Searches were performed in February/March 2019. Drawings were made using Inkscape, 2.7.11 (https://inkscape.org).
Figure 2
Figure 2
Phylogenetic trees of the lophotrochozoan CALCR and other family B GPCRs. The consensus tree was constructed with the BI method and was mid-rooted and the probability support values at nodes for the main clades are indicated. Three subsets of the same phylogenetic tree show the details of different family members and they are highlighted with different coloured boxes: (A) CALCR, (B) Cluster A, CRHR/DH44R, PDFR-related and PDFR and (C) Cluster B. The Pacific oyster CALCR-like sequence (Cgi, EKC40284) previously described is indicated by “*” and groups within Cluster A. To facilitate interpretation the positions of the Mediterranean mussel (Mytilus galloprovincialis, Mga) and hard-shelled mussel (Mytilus coruscus, Mco) receptors are highlighted in blue, the human (Homo sapiens, Hsa) in bold and the arthropod (fruit-fly, Drosophila melanogaster, Dme and flour beetle, Tribolium castaneum, Tca) in pink. Duplication events in molluscs that led to the two CALCR types and other family B GPCR types are indicated at the tree branches by a full circle. The ML trees are available as Supplementary Figure 1. The sequences included in the phylogenetic trees are listed in Supplementary Table 1.
Figure 3
Figure 3
Multiple sequence comparison of the molluscan putative mature calcitonin-like peptide sequences with human and salmon calcitonins. The deduced calcitonin-like peptides from the Mediterranean mussel (Mga), hard-shelled mussel (Mco), Pacific oyster (Cgi) and eastern oyster (Cvi) as well as the gastropod owl limpet (Lgi) and California sea hare (Aca) are represented and are grouped as precursor I or precursor II types based on their sequence similarity (Supplementary Table 3). The three peptides deduced from the annelid (Capitella teleta, Cte) calcitonin-like precursor are also included for comparison. The conserved cysteine residues are annotated in yellow and the cysteine disulphide bridge is represented . The C-terminal conserved proline amide is annotated in blue. Amino acids shaded in grey indicate the conservation between the different sequences. The predicted size of the mature peptides (aa) and their percentage (%) aa sequence similarity with human calcitonin is indicated. The deduced peptide sequences were retrieved from the peptide precursor sequences available in Supplementary Figure 2.
Figure 4
Figure 4
Tissue distribution of the Mediterranean mussel (Mytilus galloprovincialis) calcitonin peptide precursors and receptors. Gene expression levels were determined by quantitative PCR and normalized using the geometric mean of two reference genes (ef1α and 18 s). The results are represented as the mean ± SEM of three (n = 3) biological replicates. One-way Anova and Tukey’s multiple comparison test was used to assess differences in transcript expression with Prism GraphPad v5 software. Bars with different letters are significantly different (p < 0.05). M: mantle (posterior edge); Go: Gonads; Gi: Gills; Adm: Adductor muscle ; S: Stomach.
Figure 5
Figure 5
Effect of salinity and food on the expression of calcitonin-like precursors and receptors in the mantle edge of the Mediterranean mussel. Changes in expression levels were investigated in the posterior mantle edge exposed to full (SW) or decreased (brackish water, BW) water salinity in fed or fasted (F) mussels. Preliminary q-PCR analysis suggested that no significant differences between samples were likely to exist for CALCI and CALCRIa, CALCRIIa and CALCRIIb and so they were not further analysed. Gene expression levels were normalized using the geometric mean of two reference genes (ef1α and 18 s). The results are represented as the mean ± SEM (n = 5–6 biological replicates). One-way Anova and Tukey’s multiple comparison test was used to assess differences in transcript expression with Prism GraphPad v5 software. Bars with different letters are significantly different (p < 0.05).
Figure 6
Figure 6
Stimulation of the mussel CALCRs with mussel, human and salmon calcitonin peptides. Dose-response profiles of the three peptides that activated the mussel CALCR-like receptors. Receptors were stimulated with 1 μM to 0.01 nM of the mussel calcitonin-like peptide CALCIIa (•) or salmon (□) and human (Δ) calcitonin peptides and the mobilization of intracellular calcium was measured using HEK 293 cells co-transfected with the apoaequorin vector. The mussel CALCRIIc was exclusively activated by the mussel CALCIIa. The peptide potency profile for the mussel CALCRIIa was salmon » human (p < 0.001) and for CALCRIa was salmon > human (p < 0.05) and these receptors were not activated by the mussel peptide. Data was calculated as a percentage (%) of the highest response obtained (100% activation). Values represent the mean ± SEM of at least three independent experiments performed in duplicate and EC50 values were calculated from dose–response curves obtained from the three independent assays. Differences between EC50 were analysed using a two-tailed unpaired t-test.
Figure 7
Figure 7
Effect of the mussel calcitonin-like peptide on (A) calcium (ppm) concentration in the mantle edge and (B) calcium uptake by mantle cells of the Mediterranean mussel. (A) The quantity of calcium (ppm) present in the mantle edge after mussel CALCIIa peptide incubation was measured using a Microwave Plasma-Atomic Emission Spectrometer (MP-AES, Agilent) at 393.366 nm. A standard curve for calcium was performed before analysing the samples. In vitro mantle assays with CALCIIa peptide and with ouabain and control (culture medium and mantle) were repeated on at least 3 independent occasions. For each assay at least ten replicates were performed and the mantle edge distal to the umbo was used (one mantle fragment per replica). Prism GraphPad v5 software was used to assess the significance of differences between the groups using a One-way Anova and Tukey’s multiple comparison test. Bars with different letters are significantly different (p < 0.05). C - control (no peptide or ouabain); P - peptide (10 μM); O - ouabain (2 mM), OP - ouabain (2 mM) and peptide (10 μM); PreOP - pre -stimulation for 1 hour with the peptide followed by 4 hours incubation with OP. (B) Digital photographs of the mussel mantle cells in the presence (CALCIIa, 10 μM) or absence (control) of the mussel CALCIIa peptide. Calcium ions were stained with 50 mM of Calcein (green) and cell nuclei (blue) with DAPI (Acros Organics). An increase in cellular fluorescence represents an increase in calcium uptake. Fluorescence of the CALCIIa peptide stimulated cells was 1.9 times higher than the control. The average mantle cell size was 3–4 μm and fluorescent images were taken using a Leica DM IL microscope coupled to a Visicam HDMI 6 digital camera and photographs were analysed using ImageJ software (v. 1.52a) to calculate the fluorescence intensity and for image overlay. The scale bar is indicated.
Figure 8
Figure 8
Activity of enzymes involved in biomineralization in the mantle after incubation with the mussel peptide. (A) Esterase activity and (B) Acid phosphatase activity. Enzyme activity was quantified in protein extracts from the mantle of control or challenged samples that were incubated with the mussel CALCIIa peptide. Values represent the mean ± SEM (CA, n = 6 and TRAP, n = 10) performed in duplicate. Prism GraphPad v5 software was used to assess the significance of the differences between the groups using One-way Anova and Tukey’s multiple comparison test. Bars with different letters are significantly different (p < 0.05). C - control; P - peptide (10 μM); O - ouabain (2 mM), OP - ouabain (2 mM) and peptide (10 μM); PreOP - pre stimulation for 1 hour with the peptide and 4 hours incubation with OP.

Similar articles

Cited by

References

    1. Marin F, Le Roy N, Marie B. The formation and mineralization of mollusk shell. Front. Biosci. 2012;4:1099–1125. doi: 10.2741/s321. - DOI - PubMed
    1. Suzuki M, Nagasawa H. Mollusk shell structures and their formation mechanism. Can. J. Zool. Can. Zool. 2013;91:349–366. doi: 10.1139/cjz-2012-0333. - DOI
    1. Bjarnmark NA, et al. Transcriptomics provides insight into Mytilus galloprovincialis (Mollusca: Bivalvia) mantle function and its role in biomineralisation. Mar. Genomics. 2016;27:37–45. doi: 10.1016/j.margen.2016.03.004. - DOI - PubMed
    1. Clark MS, et al. Insights into shell deposition in the Antarctic bivalve Laternula elliptica: gene discovery in the mantle transcriptome using 454 pyrosequencing. BMC Genomics. 2010;11:362. doi: 10.1186/1471-2164-11-362. - DOI - PMC - PubMed
    1. Kocot KM, Aguilera F, McDougall C, Jackson DJ, Degnan BM. Sea shell diversity and rapidly evolving secretomes: insights into the evolution of biomineralization. Front. Zool. 2016;13:23. doi: 10.1186/s12983-016-0155-z. - DOI - PMC - PubMed

Publication types