

Sexual Dimorphism of Metabolomic Profile in Arterial Hypertension
- PMID: 32371946
- PMCID: PMC7200712
- DOI: 10.1038/s41598-020-64329-1
Sexual Dimorphism of Metabolomic Profile in Arterial Hypertension
Abstract
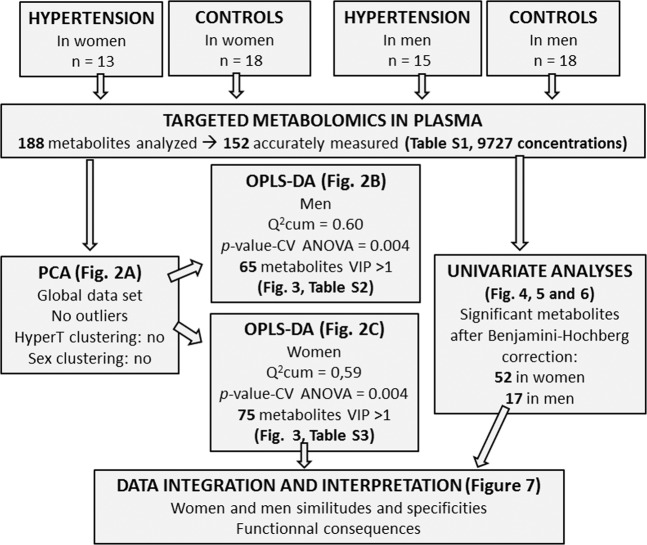
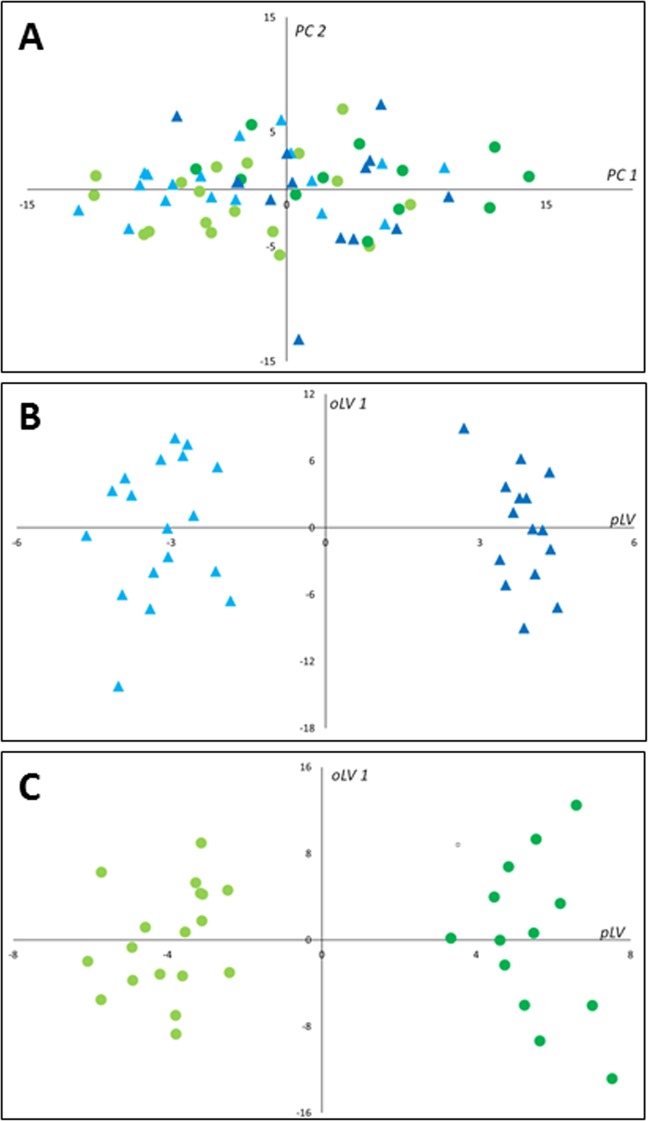
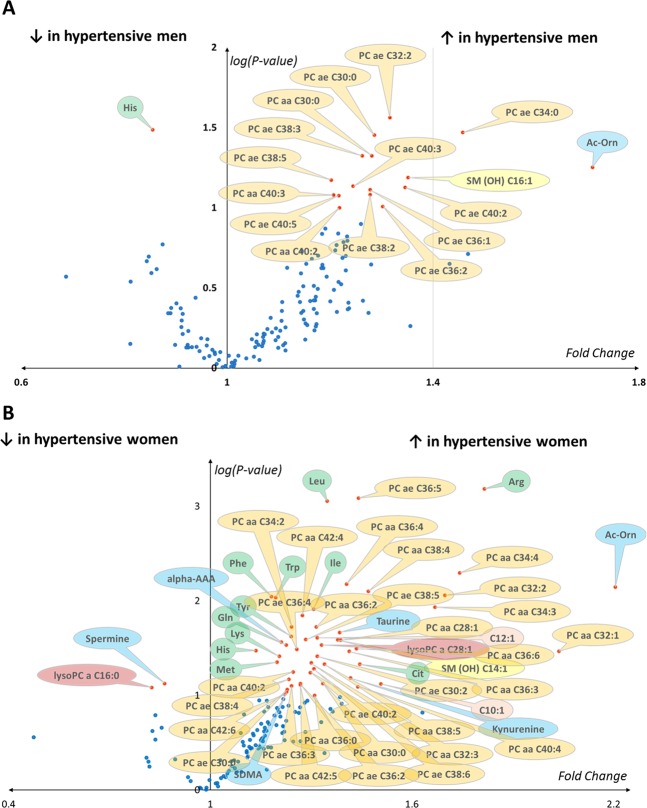
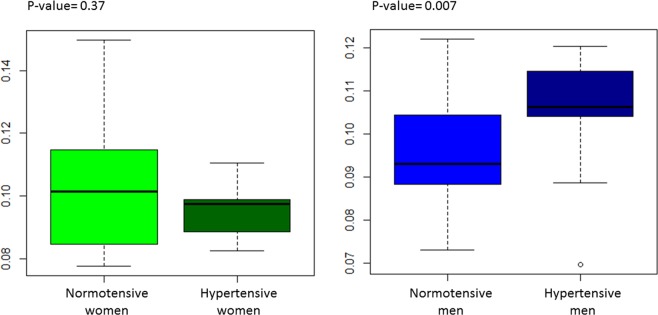
Metabolomic studies have demonstrated the existence of biological signatures in blood of patients with arterial hypertension, but no study has hitherto reported the sexual dimorphism of these signatures. We compared the plasma metabolomic profiles of 28 individuals (13 women and 15 men) with essential arterial hypertension with those of a healthy control group (18 women and 18 men), using targeted metabolomics. Among the 188 metabolites explored, 152 were accurately measured. Supervised OPLS-DA (orthogonal partial least squares-discriminant analysis) showed good predictive performance for hypertension in both sexes (Q2cum = 0.59 in women and 0.60 in men) with low risk of overfitting (p-value-CV ANOVA = 0.004 in women and men). Seventy-five and 65 discriminant metabolites with a VIP (variable importance for the projection) greater than 1 were evidenced in women and men, respectively. Both sexes showed a considerable increase in phosphatidylcholines, a decrease in C16:0 with an increase in C28:1 lysophosphatidylcholines, an increase in sphingomyelins, as well as an increase of symmetric dimethylarginine (SDMA), acetyl-ornithine and hydroxyproline. Twenty-nine metabolites, involved in phospholipidic and cardiac remodeling, arginine/nitric oxide pathway and antihypertensive and insulin resistance mechanisms, discriminated the metabolic sexual dimorphism of hypertension. Our results highlight the importance of sexual dimorphism in arterial hypertension.
Conflict of interest statement
The authors declare no competing interests.
Figures


Similar articles
-
Deconstructing the pig sex metabolome: Targeted metabolomics in heavy pigs revealed sexual dimorphisms in plasma biomarkers and metabolic pathways.J Anim Sci. 2015 Dec;93(12):5681-93. doi: 10.2527/jas.2015-9528. J Anim Sci. 2015. PMID: 26641177
-
Metabolomic Profiling of Plasma and Erythrocytes in Sickle Mice Points to Altered Nociceptive Pathways.Cells. 2020 May 26;9(6):1334. doi: 10.3390/cells9061334. Cells. 2020. PMID: 32466566 Free PMC article.
-
Study on plasmatic metabolomics of Uygur patients with essential hypertension based on nuclear magnetic resonance technique.Eur Rev Med Pharmacol Sci. 2014;18(23):3673-80. Eur Rev Med Pharmacol Sci. 2014. PMID: 25535139
-
Metabolomic signature of the seminal plasma in men with severe oligoasthenospermia.Andrology. 2020 Nov;8(6):1859-1866. doi: 10.1111/andr.12882. Epub 2020 Aug 31. Andrology. 2020. PMID: 32770844
-
Targeted metabolomics reveals reduced levels of polyunsaturated choline plasmalogens and a smaller dimethylarginine/arginine ratio in the follicular fluid of patients with a diminished ovarian reserve.Hum Reprod. 2017 Nov 1;32(11):2269-2278. doi: 10.1093/humrep/dex303. Hum Reprod. 2017. PMID: 29040513
Cited by
-
Age, Sex, Body Mass Index, Diet and Menopause Related Metabolites in a Large Homogeneous Alpine Cohort.Metabolites. 2022 Feb 24;12(3):205. doi: 10.3390/metabo12030205. Metabolites. 2022. PMID: 35323648 Free PMC article.
-
Understanding Hypertension: A Metabolomic Perspective.Biology (Basel). 2025 Apr 11;14(4):403. doi: 10.3390/biology14040403. Biology (Basel). 2025. PMID: 40282268 Free PMC article. Review.
-
Oral administration of TiO2 nanoparticles during early life impacts cardiac and neurobehavioral performance and metabolite profile in an age- and sex-related manner.Part Fibre Toxicol. 2022 Jan 5;19(1):3. doi: 10.1186/s12989-021-00444-9. Part Fibre Toxicol. 2022. PMID: 34986857 Free PMC article.
-
Relationship between amniotic fluid metabolic profile with fetal gender, maternal age, and gestational week.BMC Pregnancy Childbirth. 2021 Sep 18;21(1):638. doi: 10.1186/s12884-021-04116-6. BMC Pregnancy Childbirth. 2021. PMID: 34537001 Free PMC article.
-
Metabolic Profiling and Metabolites Fingerprints in Human Hypertension: Discovery and Potential.Metabolites. 2021 Oct 7;11(10):687. doi: 10.3390/metabo11100687. Metabolites. 2021. PMID: 34677402 Free PMC article. Review.
References
-
- Amah G, Lévy BI. Particularités de l’hypertension artérielle du sujet noir-africain. Sang Thrombose Vaisseaux (STV). 2007;19:519–25.
Publication types
MeSH terms
Substances
LinkOut - more resources
Full Text Sources
Medical
