. 2020 May;17(5):505-508.
doi: 10.1038/s41592-020-0821-0. Epub 2020 May 4.

Combining native and 'omics' mass spectrometry to identify endogenous ligands bound to membrane proteins

Affiliations

Combining native and 'omics' mass spectrometry to identify endogenous ligands bound to membrane proteins

Joseph Gault et al. Nat Methods. 2020 May.

Abstract

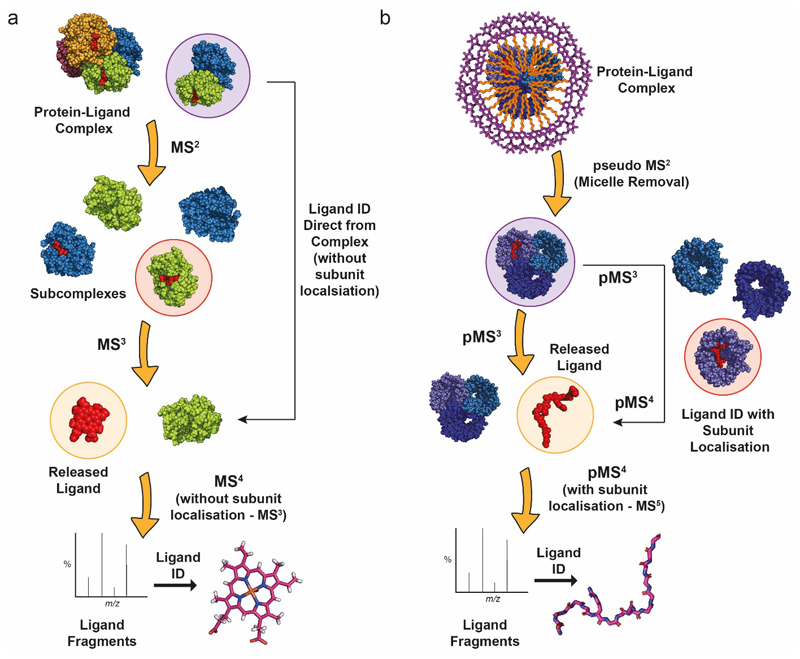
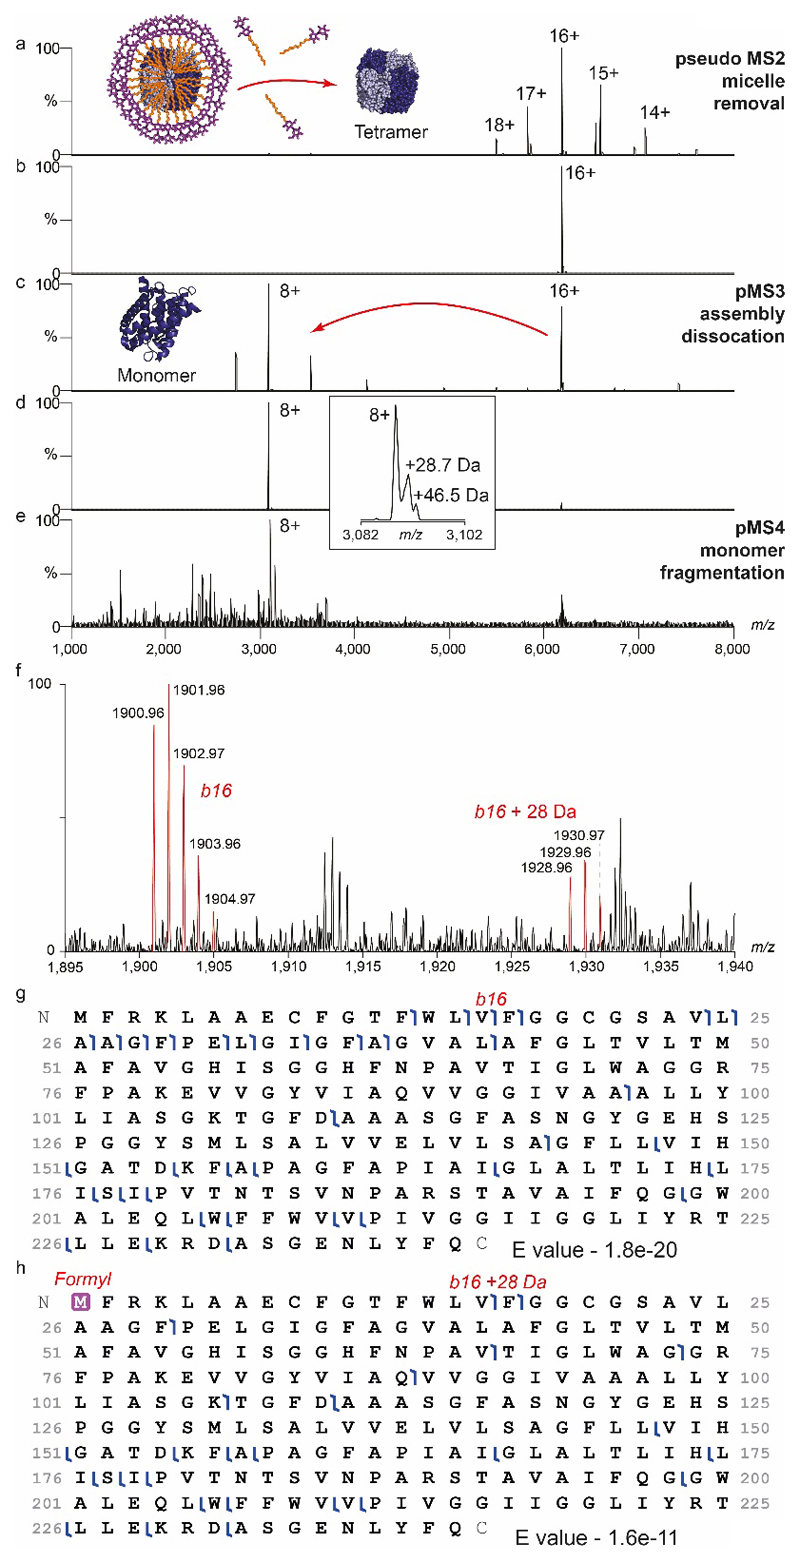
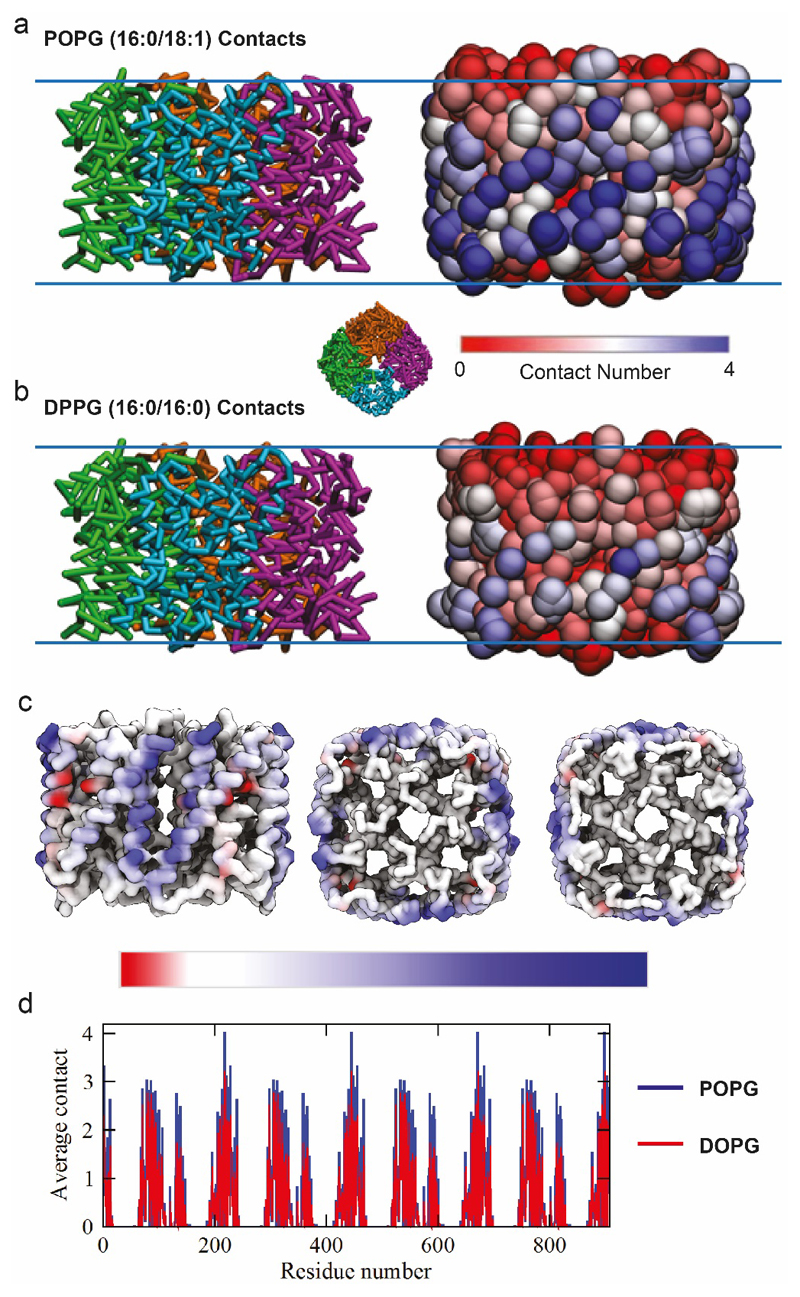
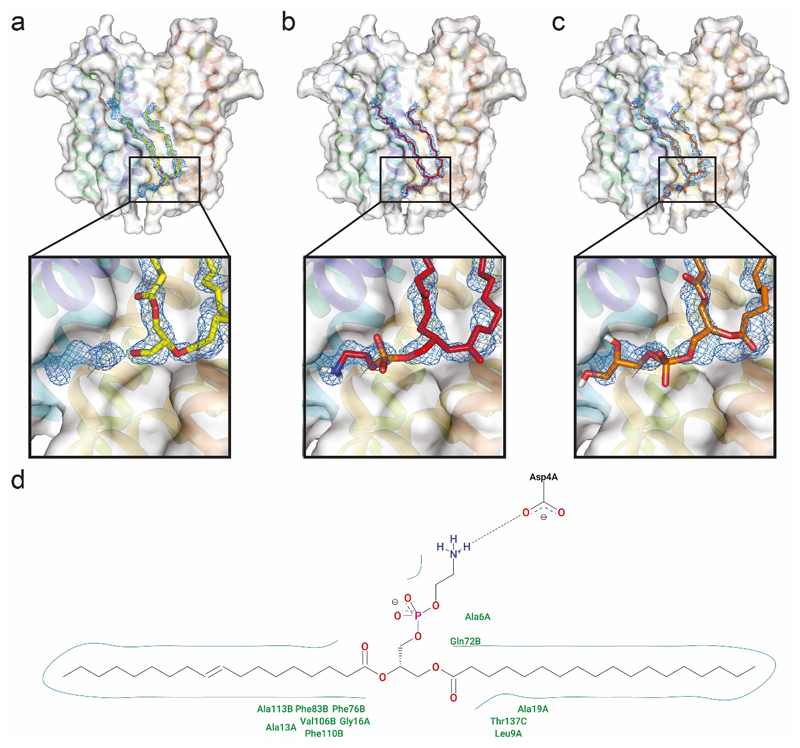
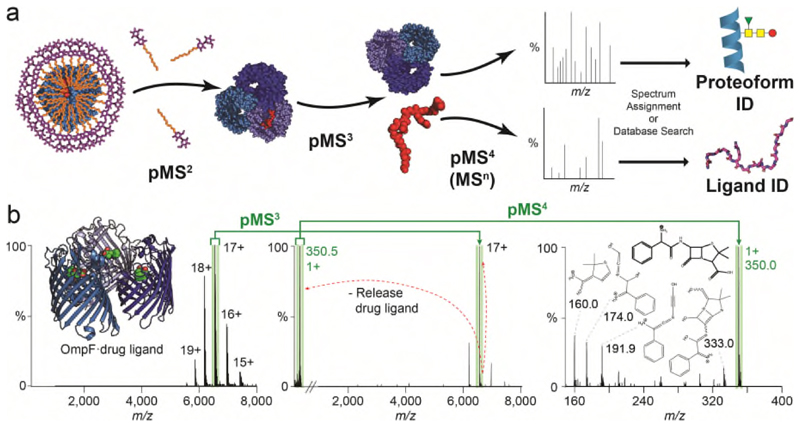
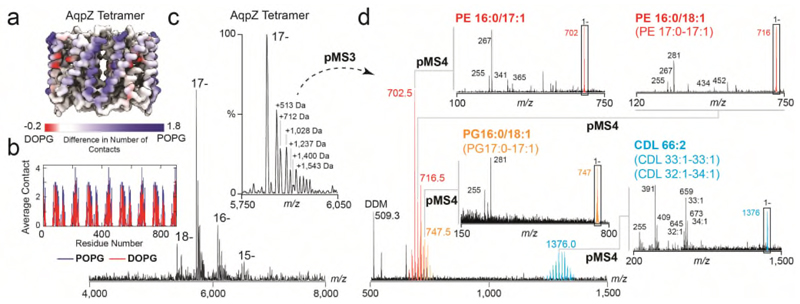
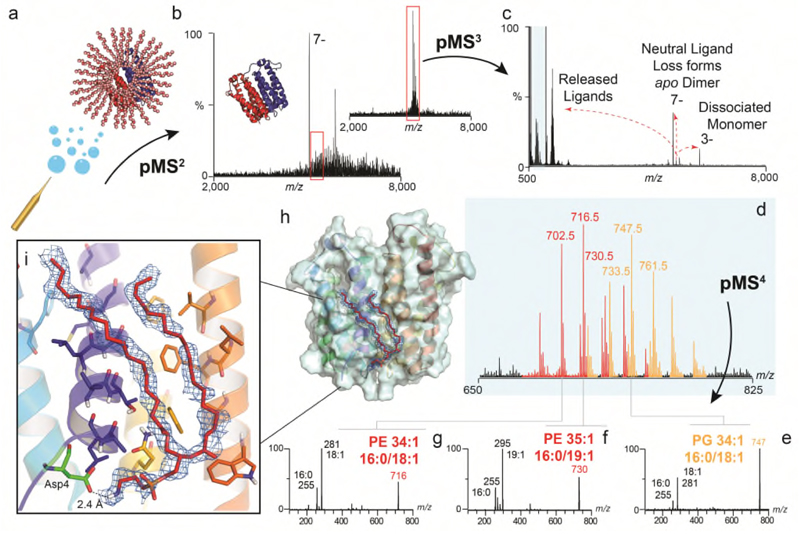
Ligands bound to protein assemblies provide critical information for function, yet are often difficult to capture and define. Here we develop a top-down method, 'nativeomics', unifying 'omics' (lipidomics, proteomics, metabolomics) analysis with native mass spectrometry to identify ligands bound to membrane protein assemblies. By maintaining the link between proteins and ligands, we define the lipidome/metabolome in contact with membrane porins and a mitochondrial translocator to discover potential regulators of protein function.


Conflict of interest statement

Competing Interests Statement

IL and HYY are employees of OMass Therapeutics. JG and CVR provide consultancy services to OMass Therapeutics. CM, PR, RH, GM, MG, RV, JS are employees of Thermo Fisher Scientific

Figures

Extended Data Figure 1
Extended Data Figure 1. Schematic of the Nativeomics workflow for identification of ligands from soluble and membrane proteins assemblies
Successive rounds of MS/MS are applied to identify ligands bound to (a) soluble, and (b) membrane, protein assemblies. For multi-subunit complexes this can be achieved with or without subunit localisation of ligand binding, which if desired, adds at least one further MS/MS stage, as indicated in the flow schemes. (see Supplementary Table 1).
Extended Data Figure 2
Extended Data Figure 2. Schematic of the Thermo Scientific Orbitrap Eclipse tribrid mass spectrometer
Important components for native MS are labelled. Guidance for tuning of important parameters for native MS is provided in Online Methods and Supplementary Figures 1-3 and is applicable to both soluble and membrane proteins assemblies.
Extended Data Figure 3
Extended Data Figure 3. Native MS of soluble and membrane protein assemblies performed using the Orbitrap Eclipse tribrid platform
Soluble protein assemblies (a) (17-386 kDa), and membrane protein assemblies (b) (22-128 kDa) are ordered with increasing molecular mass and MS conditions were optimised to maximise ion intensity and retain the intact assembly. Charge state (CS) distributions are all approximately Gaussian (Note that DHODH has a slight LDAO effect and semiSWEET is mixture of monomer and dimer) and maximum CSs are as expected from native folded protein ions. The glycan profile of antibody Trastuzumab (Herceptin) is shown in the inset. In the cases of myoglobin and DHODH there is complete retention of the non-covalently bound co-factors haem and flavin mononucleotide (FMN) respectively. Most membrane proteins harbour residual detergent adducts - adduct peaks in the spectra of semiSWEET and AmtB, for example. All membrane proteins were electrosprayed from buffers containing “charge reducing”, detergents. This, together with the reduction in the number of ionisable residues and reduced exposed surface area for charging, means that CSs are shifted to lower m/z values compared to soluble protein assemblies of similar mass. (c) A plot of mass against expected m/z of the average charge state (Zave) based on previously observed empirical relationships indicates good agreement between the size of complexes predicted, and those achieved experimentally, up to the m/z 8,000 limit of the instrument. Arbitrary bounds of ±7% are included to represent the approximate width of the CS envelope. Curves are Zave = a MW^b where a=0.0467 and b = 0.533 for soluble proteins and a= 0.0036, b= 0.71 for membrane proteins. HSP16.5 oligomers usually appear at > m/z 8,000 but have been supercharged with meta nitro benzyl alcohol to shift the CS envelope into a range below m/z 8,000.
Extended Data Figure 4
Extended Data Figure 4. Nativeomics defines lipid, peptide and drug bound to the trimeric membrane porin OmpF through progressive dissection using multiple stages of MSn
(a) OmpF bound to lipids is released from detergent micelles (pMS2), the 16+ charge state isolated (red), with lipids released from the complex (pMS3), the peak (m/z 760.5) is then isolated and fragmented to yield fragments at m/z 504.3 and 478.1 (MS4). Spectral matching assigns this lipid as PC 16:0/18:1 (b) OmpF bound to peptide OBS1 is released from detergent micelle (pMS2) and a charge state assigned to the OmpF trimer and three OBS1 peptides was isolated (17+, orange) for pMS3. m/z 777.3 is isolated and fragmented (pMS4) to yield b and y ions that enable peptide sequence determination. (c) OmpF bound to ampicillin. The 17+ charge state (green) was isolated for activation and the ligand released at m/z 350.5 (pMS3). Fragmentation (pMS4) yields characteristic ions that identify ampicillin following database searching or spectral matching. For MS parameters see Online Methods.
Extended Data Figure 5
Extended Data Figure 5. Nativeomics applied to AqpZ tetramer to progressively dissect the assembly and identify multiple proteoforms
(a) pMS2 effects the removal of the C8E4 detergent micelle in the source region (in-source activation 136V, source compensation voltage 10%) (b) the 16+ charge state (m/z 6,183) is then selected using the ion trap and (c) dissociated (MS3) in the HCD cell (NCE 22%) ejecting monomers. (d) Isolation of the monomer (8+) (m/z 3,090) is performed in the ion trap, the inset (expansion) shows additional species at ~ +29 Da and ~ +46 Da. (e) pMS4 top-down fragmentation (CID NCE 20%) of these species in the ion trap and detection at high-resolution in the Orbitrap reveals predominantly b and y fragment ions in the low m/z region. (f) Assignment of the 1+ charge, b16 ion at m/z 1,900.96, and +28 Da partner at m/z 1,928.96 is consistent with assignment of the +28 Da modification to N-terminal formylation as previously suggested. Percentage formylation of 30-40% estimated based on b ion intensity ratios. (g) Coverage of non-modified AqpZ identified with E value of 1.8e-20. h) Coverage map of N-terminally formylated AqpZ identified with E value of 1.6e-11. The top-down data presented here, does not represent a fully optimised top-down experiment for proteoform ID. Longer acquisition times and other complimentary fragmentation methods would likely improve sequence coverage, however, this data clearly demonstrates the capability of the modified ion trap on the Orbitrap Eclipse platform for isolation and fragmentation of high m/z ions (m/z 3,000-8,000). Furthermore it showcases the application of protein-centric Nativeomics to isolate individual membrane protein assemblies from mixtures, dissect them into subunits and identify proteoforms through top-down pMS4. Data is representative of two biological repeats.
Extended Data Figure 6
Extended Data Figure 6. MD simulations of AqpZ in mixed lipid bilayers
(a) Side view snapshots of aquaporin in the POPE-POPG bilayer after 3780 ns of simulation time. Snapshots show the protein backbone-bonding scheme (left) and using a RWB colour bar, protein residues are coloured according to the number of times they come into contact with POPG lipids (based on a 0.6 nm cutoff), during the last 1000 ns of simulation time (right). The inset figure shows a representative top view snapshot of aquaporin. (b) Side view snapshots of aquaporin in the POPE-DPPG bilayer after 3780 ns of simulation time. Snapshots show the protein backbone-bonding scheme (left) and using a RWB colour bar, protein residues are coloured according to the number of times they come into contact with DOPG lipids, during the last 1000 ns of simulation time (right). (c) The number of aquaporin-DOPG contacts is subtracted from the number of aquaporin-POPG contacts (during the last 1000 ns of simulation time) and the resulting quantities (per residue) are assigned a colour based on the asymmetric RWB colour bar provided. In other words, the differences in lipid binding per residue (based on a 0.6 nm cut-off) are depicted using a RWB colour scale for clarity. (d) The average number of contacts for each residue of aquaporin (based on a 0.6 nm cut-off) during the last 1000 ns of simulation time. Data are shown for the simulations with POPG (blue) and DOPG (red) lipids.
Extended Data Figure 7
Extended Data Figure 7. Comparison of TSPO lipid structures after fitting lipids into the electron density map of TSPO structure (PDB 4UC1)
The FEM omit map, is shown in blue and is contoured at 1.0s. (a) shows the previous fitting where DG(16:0/18:1) was modelled (yellow sticks), (b) shows PE(16:0/18:1) fitting, which is accommodated extremely well (red sticks) (c) shows PG(16:0/18:1) fitting (orange sticks) with quite poor matching between the PG headgroup and electron density in that region (d) displays the favourable interactions between PE (16:0/18:1) and the protein, notably the hydrogen bond between the terminal amine and the aspartic acid Asp4. Hydrophobic and hydrogen bonding interactions are indicated (green and black dots respectively).
Figure 1
Figure 1. Nativeomics defines ligands bound to the trimeric membrane porin OmpF through progressive dissection using multiple stages of MSn
(a) Schematic of the Nativeomics workflow to identify ligands or proteoform components of membrane protein assemblies. The protein-ligand complex is released from its encapsulating detergent micelle MS (pMS2) and the assembly isolated and dissociated to release proteoforms and ligands (pMS3) for selection and fragmentation (pMS4 up to MSn). Identification is achieved through spectral matching or database searching. The protein assembly is illustrated by blue spheres, with subunits coloured in different shades. Ligand is represented by red spheres or lines. (b) OmpF (PDB 4GCP) bound to drug ligand ampicillin is released from detergent micelles (pMS2), the 17+ charge state (green) isolated for activation and the ligand released at m/z 350.5 (pMS3). Isolation and fragmentation of the ligand (pMS4) yields characteristic ions that identify ampicillin following database searching or spectral matching. See Online Methods for MS parameters.
Figure 2
Figure 2. Nativeomics and MD simulations define the structure of endogenous lipids bound directly to aquaporin Z
(a) Result of MD simulations of lipid binding to AqpZ performed in mixed lipid bilayers containing PG 16:0/18:1 (POPG) or 16:0/18:0 (DOPG). AqpZ is coloured according to the difference in the number of contacts between POPG (blue) and DOPG (red), averaged over the trajectories of POPG contacts. (b) Plot of the average number of contacts lipids make per AqpZ residue. (c) nMS spectrum of AqpZ acquired in negative ion polarity. Removal of detergent micelles (pMS2) reveals AqpZ charge state (17-) bound to multiple endogenous ligands. Peaks corresponding to a heterogenous mixture of multiple ligands bound to apo protein are annotated with their apparent additional mass (Da). (inset) Isolation and activation releases bound ligands (pMS3), yielding at least 46 distinct species from m/z 500-1500 and three distinct families of ligands (red, orange and blue). (d) Selection and fragmentation of individual released ligands in negative ion polarity (pMS4) produces spectra indicative of lipids. Fragment ions define the unsaturation and asymmetry of chain length through spectral matching with LIPIDMAPS. Predominant lipids are PE 16:0-17:1, PG 16:0/18:1 and CDL 33:1-33:1 and distributions can therefore be assigned to cohorts of PE (red), PG (orange) and CDL (blue) lipids. See Online Methods for MS parameters and Supplementary Figure 8 for complete MS dataset. Lipid identification is representative of two independent protein preparations.
Figure 3
Figure 3. Identification of unknown ligands bound to TSPO and subsequent fitting of PE 16:0/18:1 into unresolved electron density in the X-ray structure
(a) Schematic showing electrospray and release of the TSPO dimer from detergent micelles in negative ion polarity (subunits red and blue cartoon, with detergent micelle orange spheres) (b) Native mass spectrum of the TSPO dimer (pMS2) and isolation of the 7- charge state (red box) (inset). (c) Collisional activation (pMS3) yields dissociated monomer, apo dimer produced from neutral ligand loss, and multiple ligands at low m/z (blue box). (d) Zoom of low m/z region showing two peak series corresponding to multiple lipids PE (red) and PG (orange). (e-g) Isolation and subsequent fragmentation of released lipids (pMS4) defines the hydrocarbon chain length and extent of unsaturation. (h) Fitting of the most abundant PE lipid identified - PE (16:0/18:1) (red sticks) into the electron density (blue mesh) in the TSPO A139T crystal structure (each monomer in blue and yellow helices) (PDB 4UC1). Critical protein-lipid interactions are shown (zoom box) with PE interacting favourably with surrounding amino acids through hydrophobic interactions and the headgroup terminal amine forming a hydrogen-bonded interaction with the carboxylic acid side chain of Asp4 (green sticks). Other homologous PEs with different acyl tails (e.g. 16:0/19:1 and 18:/18:1) can also be accommodated within this density. See Online Methods for MS parameters and Supplementary Figure 9 for complete MS dataset. Lipid identification is representative of two independent protein preparations.

References

    1. Li F, Liu J, Zheng Y, Garavito RM, Ferguson-Miller S. Protein structure. Crystal structures of translocator protein (TSPO) and mutant mimic of a human polymorphism. Science. 2015;347:555–8. - PMC - PubMed
    1. Smart OS, et al. Validation of ligands in macromolecular structures determined by X-ray crystallography. Acta Crystallogr Sect D Struct Biol. 2018;74:228–236. - PMC - PubMed
    1. Foster SR, et al. Discovery of Human Signaling Systems: Pairing Peptides to G Protein-Coupled Receptors. Cell. 2019;179:895–908.e21. - PMC - PubMed
    1. Coman C, et al. Simultaneous Metabolite, Protein, Lipid Extraction (SIMPLEX): A Combinatorial Multimolecular Omics Approach for Systems Biology. Mol Cell Proteomics. 2016;15:1453–66. - PMC - PubMed
    1. Laschet C, Dupuis N, Hanson J. The G protein-coupled receptors deorphanization landscape. Biochem Pharmacol. 2018;153:62–74. - PubMed

Publication types