

Diagnostic value of the novel CMR parameter "myocardial transit-time" (MyoTT) for the assessment of microvascular changes in cardiac amyloidosis and hypertrophic cardiomyopathy
- PMID: 32372287
- PMCID: PMC7806531
- DOI: 10.1007/s00392-020-01661-6
Diagnostic value of the novel CMR parameter "myocardial transit-time" (MyoTT) for the assessment of microvascular changes in cardiac amyloidosis and hypertrophic cardiomyopathy
Abstract
Background: Coronary microvascular dysfunction (CMD) is present in various non-ischemic cardiomyopathies and in particular in those with left-ventricular hypertrophy. This study evaluated the diagnostic value of the novel cardiovascular magnetic resonance (CMR) parameter "myocardial transit-time" (MyoTT) in distinguishing cardiac amyloidosis from other hypertrophic cardiomyopathies.
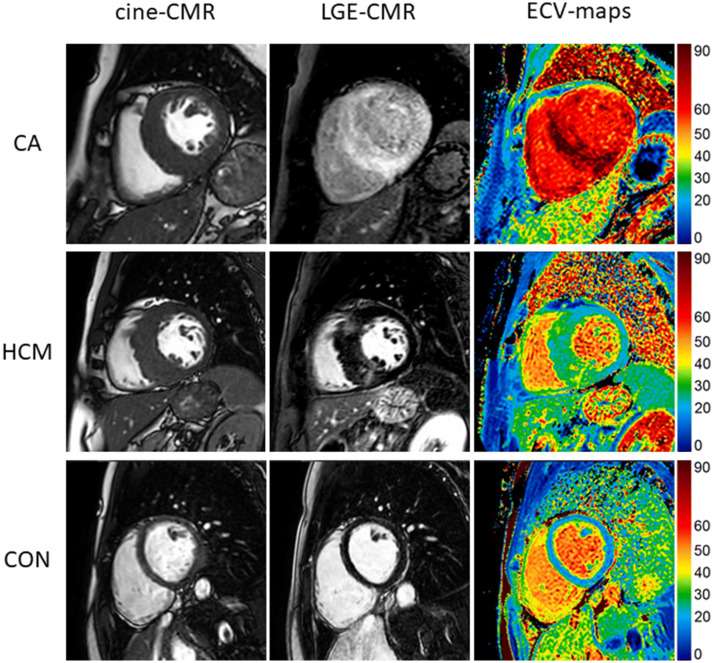
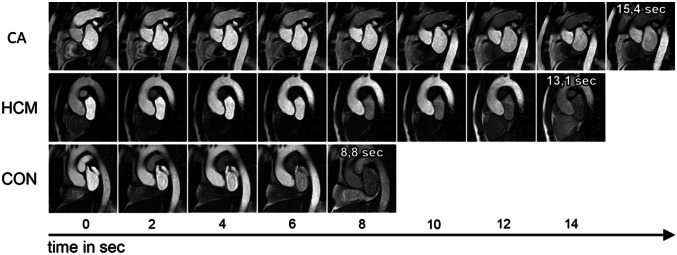
Methods: N = 20 patients with biopsy-proven cardiac amyloidosis (CA), N = 20 patients with known hypertrophic cardiomyopathy (HCM), and N = 20 control patients without relevant cardiac disease underwent dedicated CMR studies on a 1.5-T MR scanner. The CMR protocol comprised cine and late-gadolinium-enhancement (LGE) imaging as well as first-pass perfusion acquisitions at rest for MyoTT measurement. MyoTT was defined as the blood circulation time from the orifice of the coronary arteries to the pooling in the coronary sinus (CS) reflecting the transit-time of gadolinium in the myocardial microvasculature.
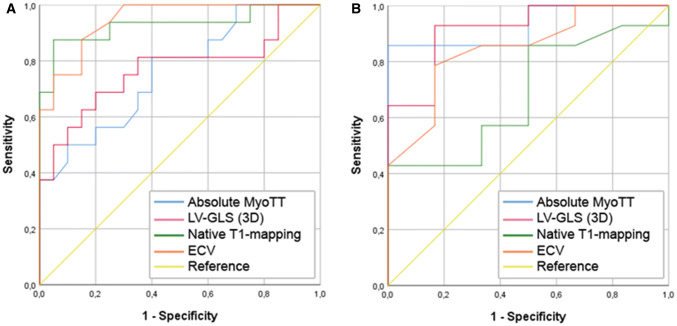
Results: MyoTT was significantly prolonged in patients with CA compared to both groups: 14.8 ± 4.1 s in CA vs. 12.2 ± 2.5 s in HCM (p = 0.043) vs. 7.2 ± 2.6 s in controls (p < 0.001). Native T1 and extracellular volume (ECV) were significantly higher in CA compared to HCM and controls (p < 0.001). Both parameters were associated with a higher diagnostic accuracy in predicting the presence of CA compared to MyoTT: area under the curve (AUC) for native T1 = 0.93 (95% confidence interval (CI) = 0.83-1.00; p < 0.001) and AUC for ECV = 0.95 (95% CI = 0.88-1.00; p < 0.001)-compared to the AUC for MyoTT = 0.76 (95% CI = 0.60-0.92; p = 0.008). In contrast, MyoTT performed better than all other CMR parameters in differentiating HCM from controls (AUC for MyoTT = 0.93; 95% CI = 0.81-1.00; p = 0.003 vs. AUC for native T1 = 0.69; 95% CI = 0.44-0.93; p = 0.20 vs. AUC for ECV = 0.85; 95% CI = 0.66-1.00; p = 0.017).
Conclusion: The relative severity of CMD (measured by MyoTT) in relationship to extracellular changes (measured by native T1 and/or ECV) is more pronounced in HCM compared to CA-in spite of a higher absolute MyoTT value in CA patients. Hence, MyoTT may improve our understanding of the interplay between extracellular/intracellular and intravasal changes that occur in the myocardium during the disease course of different cardiomyopathies.
Keywords: CMD; CMR; ECV; HCM; MVD; MyoTT.
Conflict of interest statement
The author(s) declare that they have no conflict of interest.
Figures
References
-
- Cohen AS. Amyloidosis. N Engl J Med. 1967;277(10):522–530. - PubMed
-
- Quarta CC, Kruger JL, Falk RH. Cardiac amyloidosis. Circulation. 2012;126(12):e178–e182. - PubMed
-
- Palladini G, Dispenzieri A, Gertz MA, Kumar S, Wechalekar A, Hawkins PN, et al. New criteria for response to treatment in immunoglobulin light chain amyloidosis based on free light chain measurement and cardiac biomarkers: impact on survival outcomes. J Clin Oncol. 2012;30(36):4541–4549. - PubMed
-
- Takashio S, Izumiya Y, Jinnin M, Yamamuro M, Kojima S, Ihn H, et al. Diagnostic and prognostic value of subcutaneous tissue biopsy in patients with cardiac amyloidosis. Am J Cardiol. 2012;110(10):1507–1511. - PubMed
-
- Brouwers S, Laptseva N, Gerber B, Schwotzer R, Ruschitzka F, Flammer JA. Cardiac amyloidosis. Cardiovasc Med. 2018;21(11):282–289. doi: 10.4414/cvm.2018.00592. - DOI
MeSH terms
LinkOut - more resources
Full Text Sources
Medical
