

Metabolomic Profiling Revealed Potential Biomarkers in Patients With Moyamoya Disease
- PMID: 32372905
- PMCID: PMC7186471
- DOI: 10.3389/fnins.2020.00308
Metabolomic Profiling Revealed Potential Biomarkers in Patients With Moyamoya Disease
Abstract
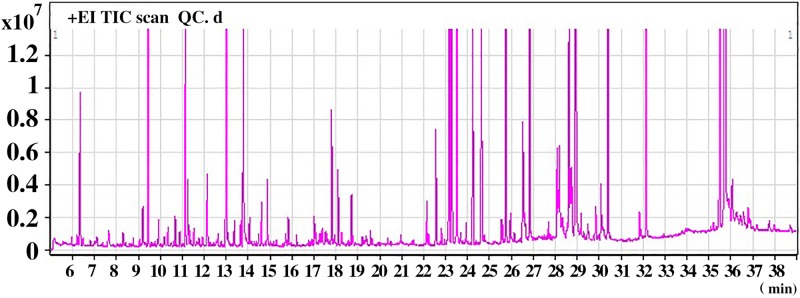
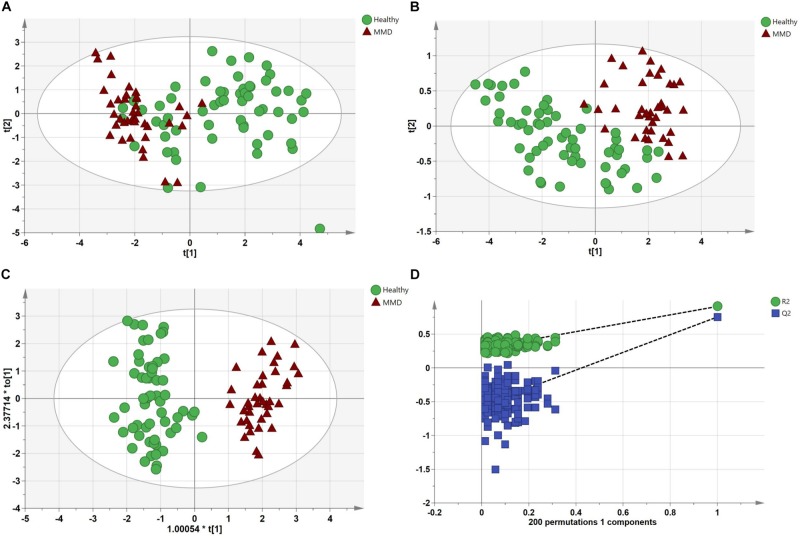
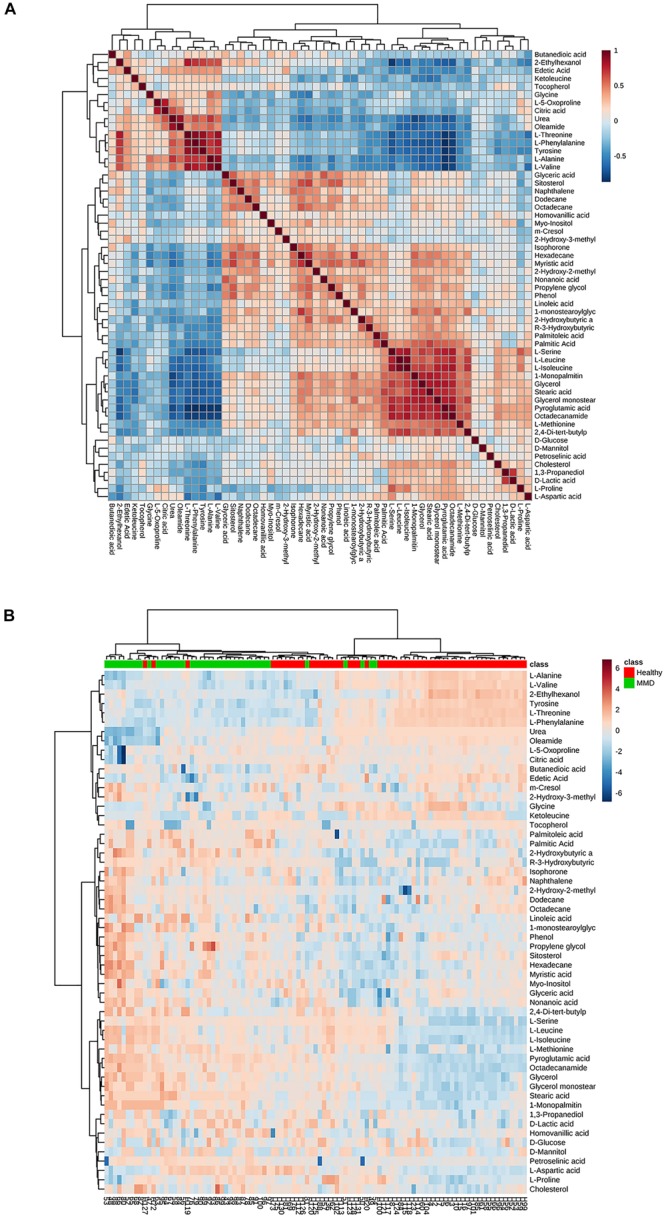
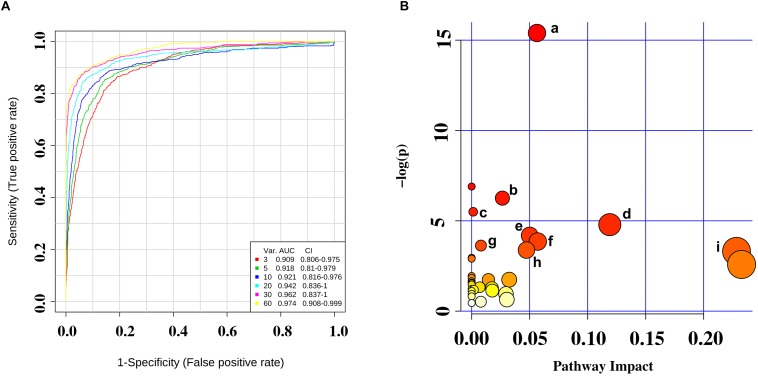
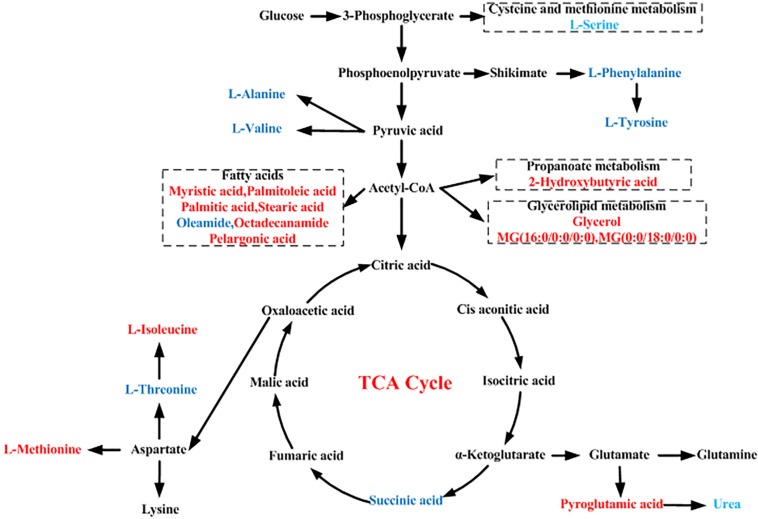
Metabolomics is increasingly used to observe metabolic patterns and disease-specific metabolic biomarkers. However, serum metabolite analysis of moyamoya disease (MMD) is rarely reported. We investigated serum metabolites in MMD and compared them with those of healthy controls (HCs) using a non-targeted gas chromatography-mass spectrometry (GC-MS) approach to identify metabolic biomarkers associated with MMD. Forty-one patients with MMD diagnosed by cerebral angiography and 58 HCs were recruited for our study. Comparative analyses (univariate, multivariate, correlation, heatmaps, receiver operating characteristi curves) were performed between MMD patients and HCs. Twenty-five discriminating serum metabolic biomarkers between MMD patients and HCs were identified. Compared with HCs, MMD patients had higher levels of phenol, 2-hydroxybutyric acid, L-isoleucine, L-serine, glycerol, pelargonic acid, L-methionine, myristic acid, pyroglutamic acid, palmitic acid, palmitoleic acid, stearic acid, octadecanamide, monoglyceride (MG) (16:0/0:0/0:0), and MG (0:0/18:0/0:0), and lower levels of L-alanine, L-valine, urea, succinic acid, L-phenylalanine, L-threonine, L-tyrosine, edetic acid, and oleamide. These metabolic biomarkers are involved in several pathways and are closely associated with the metabolism of amino acids, lipids, carbohydrates, and carbohydrate translation. A GC-MS-based metabolomics approach could be useful in the clinical diagnosis of MMD. The identified biomarkers may be helpful to develop an objective diagnostic method for MMD and improve our understanding of MMD pathogenesis.
Keywords: biomarkers; gas chromatography–mass spectrometry; metabolomics; moyamoya disease; serum.
Copyright © 2020 Geng, Cui, Guo, Wang, Zhang, Han, Jin, Chen and Jiang.
Figures
References
-
- Bechthold I., Bretz K., Kabasci S., Kopitzky R., Springer A. (2010). Succinic acid: anew platform chemical for biobased polymers from renewable resources. Chem. Eng. Technol. 31 647–654. 10.1002/ceat.200800063 - DOI
-
- Chen H. Y., Fang S., Wang L. (2017). Interactions of 1-butyl-2,3-dimethylimidazolium bromide ionic liquid with glycine, l -alanine and l -valine: a volumetric and NMR spectroscopic study. J. Mol. Liq. 225 706–712. 10.1016/j.molliq.2016.10.125 - DOI
LinkOut - more resources
Full Text Sources
Miscellaneous