

Assessing Population Diversity of Brettanomyces Yeast Species and Identification of Strains for Brewing Applications
- PMID: 32373090
- PMCID: PMC7177047
- DOI: 10.3389/fmicb.2020.00637
Assessing Population Diversity of Brettanomyces Yeast Species and Identification of Strains for Brewing Applications
Abstract
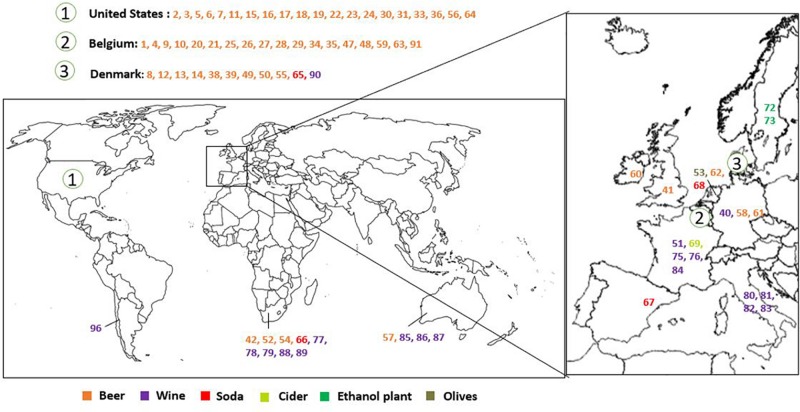
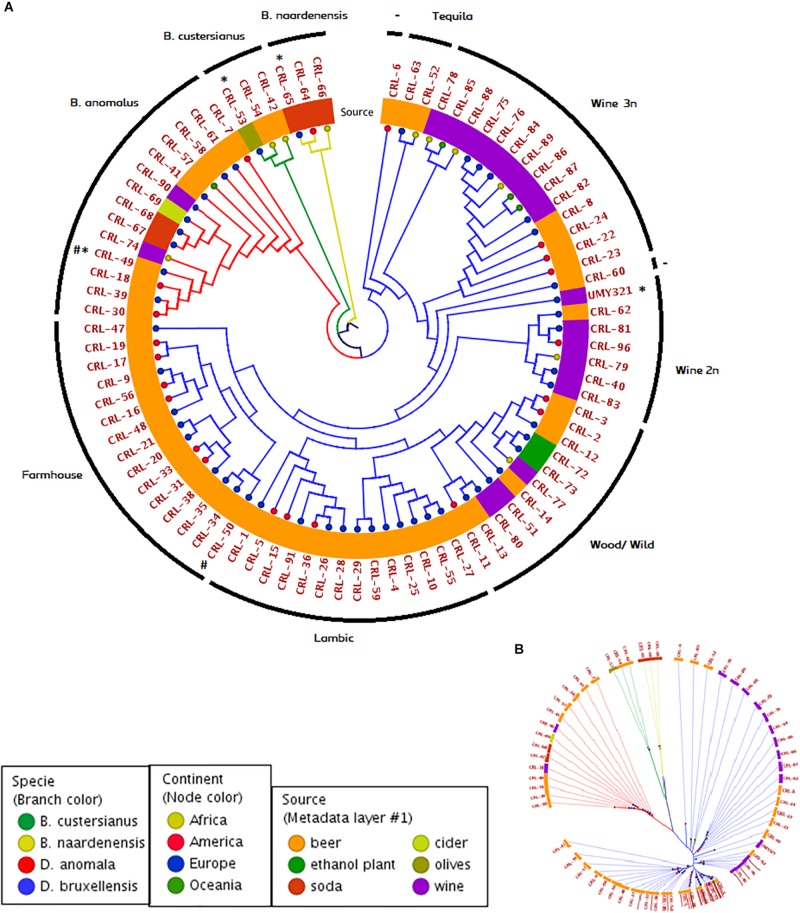
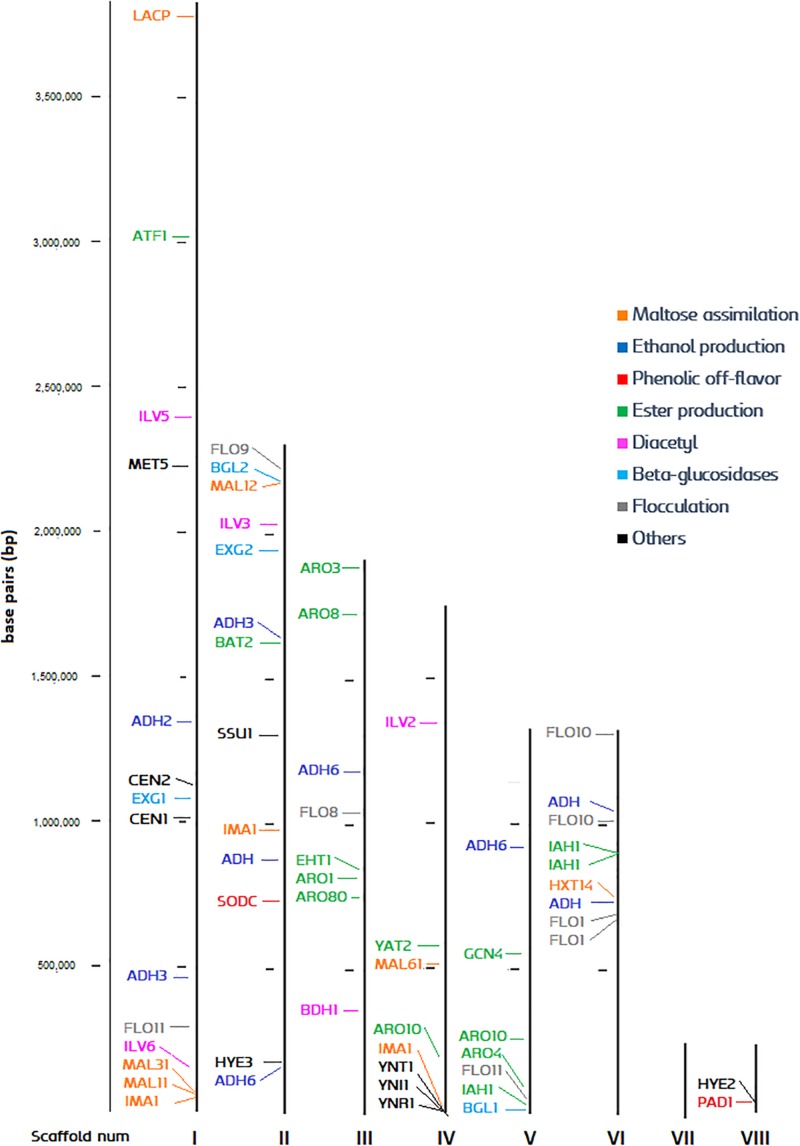
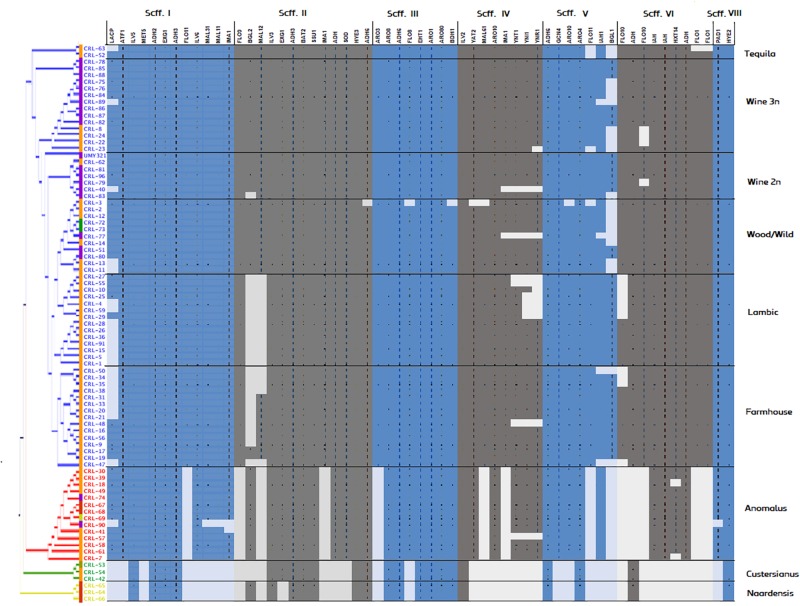
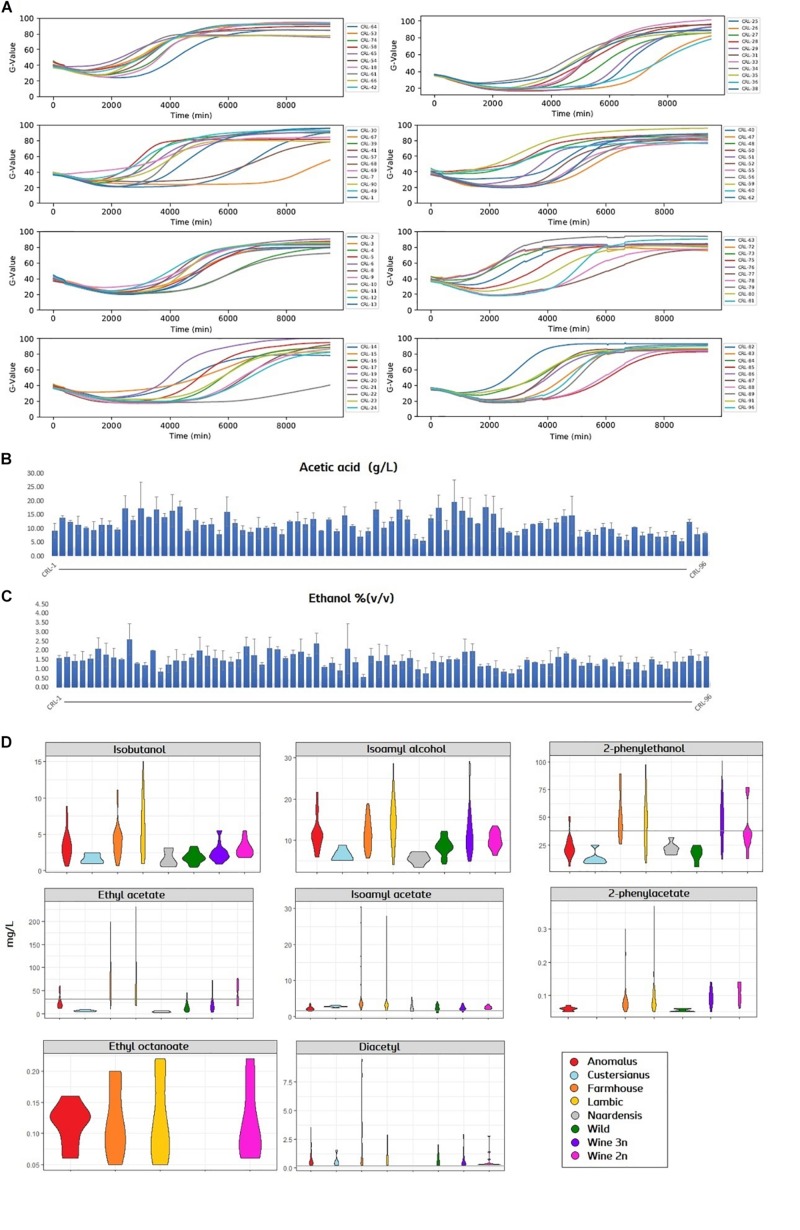
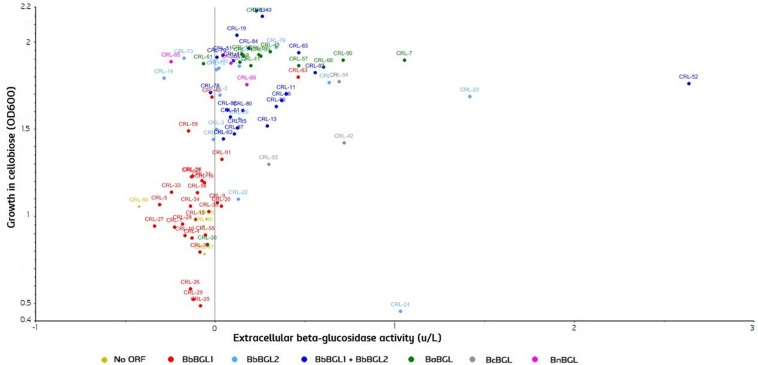
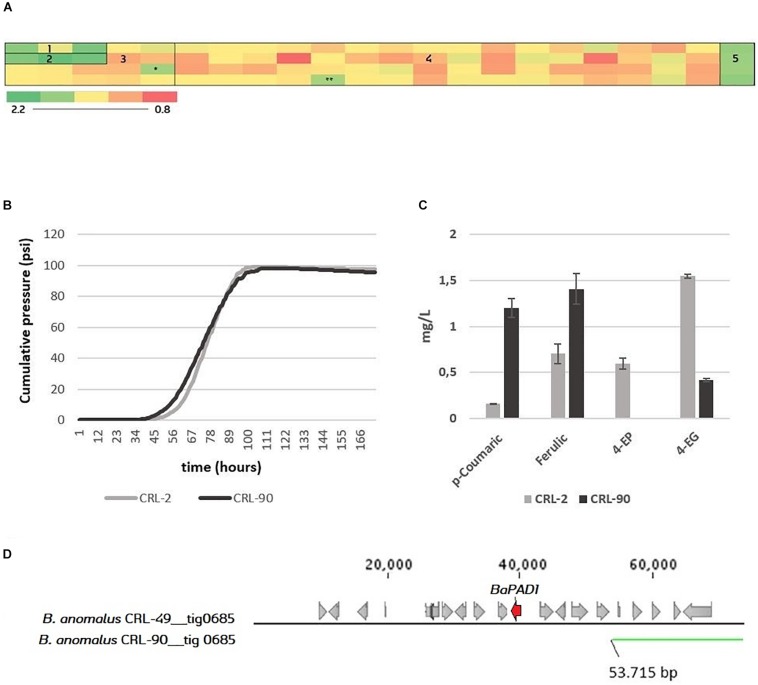
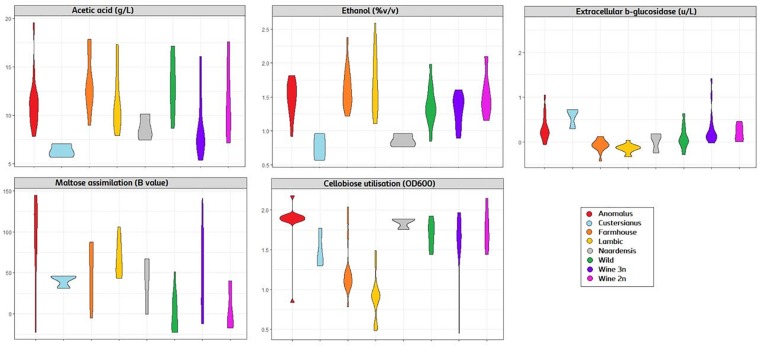
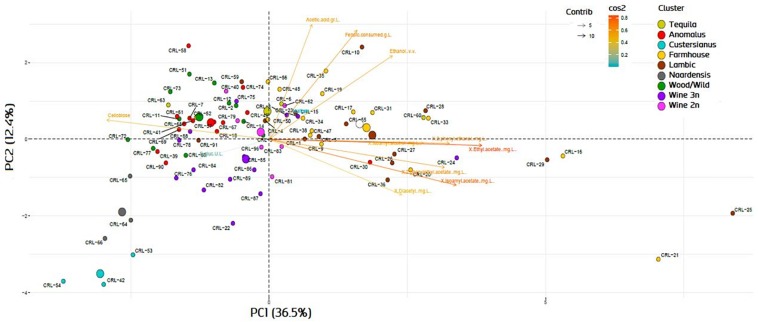
Brettanomyces yeasts have gained popularity in many sectors of the biotechnological industry, specifically in the field of beer production, but also in wine and ethanol production. Their unique properties enable Brettanomyces to outcompete conventional brewer's yeast in industrially relevant traits such as production of ethanol and pleasant flavors. Recent advances in next-generation sequencing (NGS) and high-throughput screening techniques have facilitated large population studies allowing the selection of appropriate yeast strains with improved traits. In order to get a better understanding of Brettanomyces species and its potential for beer production, we sequenced the whole genome of 84 strains, which we make available to the scientific community and carried out several in vitro assays for brewing-relevant properties. The collection includes isolates from different substrates and geographical origin. Additionally, we have included two of the oldest Carlsberg Research Laboratory isolates. In this study, we reveal the phylogenetic pattern of Brettanomyces species by comparing the predicted proteomes of each strain. Furthermore, we show that the Brettanomyces collection is well described using similarity in genomic organization, and that there is a direct correlation between genomic background and phenotypic characteristics. Particularly, genomic patterns affecting flavor production, maltose assimilation, beta-glucosidase activity, and phenolic off-flavor (POF) production are reported. This knowledge yields new insights into Brettanomyces population survival strategies, artificial selection pressure, and loss of carbon assimilation traits. On a species-specific level, we have identified for the first time a POF negative Brettanomyces anomalus strain, without the main spoilage character of Brettanomyces species. This strain (CRL-90) has lost DaPAD1, making it incapable of converting ferulic acid to 4-ethylguaiacol (4-EG) and 4-ethylphenol (4-EP). This loss of function makes CRL-90 a good candidate for the production of characteristic Brettanomyces flavors in beverages, without the contaminant increase in POF. Overall, this study displays the potential of exploring Brettanomyces yeast species biodiversity to find strains with relevant properties applicable to the brewing industry.
Keywords: 4-ethylguaiacol; Dekkera bruxellensis; beta-glucosidase; brewing fermentation; genomics; high-throughput screening; maltose assimilation; phenolic off-flavor.
Copyright © 2020 Colomer, Chailyan, Fennessy, Olsson, Johnsen, Solodovnikova and Forster.
Figures
Similar articles
-
Fermentation assays reveal differences in sugar and (off-) flavor metabolism across different Brettanomyces bruxellensis strains.FEMS Yeast Res. 2017 Jan;17(1):fow105. doi: 10.1093/femsyr/fow105. Epub 2016 Dec 11. FEMS Yeast Res. 2017. PMID: 27956491
-
Comparative phenomics and targeted use of genomics reveals variation in carbon and nitrogen assimilation among different Brettanomyces bruxellensis strains.Appl Microbiol Biotechnol. 2015 Nov;99(21):9123-34. doi: 10.1007/s00253-015-6769-9. Epub 2015 Jul 2. Appl Microbiol Biotechnol. 2015. PMID: 26135985
-
Mutagenesis, screening and isolation of Brettanomyces bruxellensis mutants with reduced 4-ethylphenol production.World J Microbiol Biotechnol. 2021 Jan 4;37(1):6. doi: 10.1007/s11274-020-02981-5. World J Microbiol Biotechnol. 2021. PMID: 33392812
-
The raise of Brettanomyces yeast species for beer production.Curr Opin Biotechnol. 2019 Apr;56:30-35. doi: 10.1016/j.copbio.2018.07.009. Epub 2018 Aug 30. Curr Opin Biotechnol. 2019. PMID: 30173102 Review.
-
Brettanomyces yeasts--From spoilage organisms to valuable contributors to industrial fermentations.Int J Food Microbiol. 2015 Aug 3;206:24-38. doi: 10.1016/j.ijfoodmicro.2015.04.005. Epub 2015 Apr 8. Int J Food Microbiol. 2015. PMID: 25916511 Review.
Cited by
-
The marula and elephant intoxication myth: assessing the biodiversity of fermenting yeasts associated with marula fruits (Sclerocarya birrea).FEMS Microbes. 2023 Oct 6;4:xtad018. doi: 10.1093/femsmc/xtad018. eCollection 2023. FEMS Microbes. 2023. PMID: 37854251 Free PMC article.
-
The Role of Bioactive Phenolic Compounds on the Impact of Beer on Health.Molecules. 2021 Jan 18;26(2):486. doi: 10.3390/molecules26020486. Molecules. 2021. PMID: 33477637 Free PMC article. Review.
-
Different trajectories of polyploidization shape the genomic landscape of the Brettanomyces bruxellensis yeast species.Genome Res. 2021 Dec;31(12):2316-2326. doi: 10.1101/gr.275380.121. Epub 2021 Nov 23. Genome Res. 2021. PMID: 34815309 Free PMC article.
-
Specialization restricts the evolutionary paths available to yeast sugar transporters.bioRxiv [Preprint]. 2024 Jul 23:2024.07.22.604696. doi: 10.1101/2024.07.22.604696. bioRxiv. 2024. Update in: Mol Biol Evol. 2024 Nov 1;41(11):msae228. doi: 10.1093/molbev/msae228. PMID: 39091816 Free PMC article. Updated. Preprint.
-
A high-throughput screening method for the discovery of Saccharomyces and non-Saccharomyces yeasts with potential in the brewing industry.Eng Biol. 2021 Aug 30;5(3):72-80. doi: 10.1049/enb2.12013. eCollection 2021 Sep. Eng Biol. 2021. PMID: 36968259 Free PMC article.
References
-
- Aguilar-Uscanga M. G., Garcia-Alvarado Y., Gomez-Rodriguez J., Phister T., Delia M. L., Strehaiano P. (2011). Modelling the growth and ethanol production of Brettanomyces bruxellensis at different glucose concentrations. Lett. Appl. Microbiol. 53 141–149. 10.1111/j.1472-765X.2011.03081.x - DOI - PubMed
-
- Andersion R. A. Y. (2012). Brewery One Yeast or Two? Pure Yeast and Top Fermentation. Brew. Hist. 149 30–38.
-
- Avramova M., Cibrario A., Peltier E., Coton M., Coton E., Schacherer J., et al. (2018a). Brettanomyces bruxellensis population survey reveals a diploid-triploid complex structured according to substrate of isolation and geographical distribution. Sci. Rep. 8:4136. 10.1038/s41598-018-22580-7 - DOI - PMC - PubMed
LinkOut - more resources
Full Text Sources