. 2020 Apr 21:11:217.
doi: 10.3389/fgene.2020.00217. eCollection 2020.

Whole Genome Scan Reveals Molecular Signatures of Divergence and Selection Related to Important Traits in Durum Wheat Germplasm

Affiliations

Whole Genome Scan Reveals Molecular Signatures of Divergence and Selection Related to Important Traits in Durum Wheat Germplasm

Francesca Taranto et al. Front Genet. .

Abstract

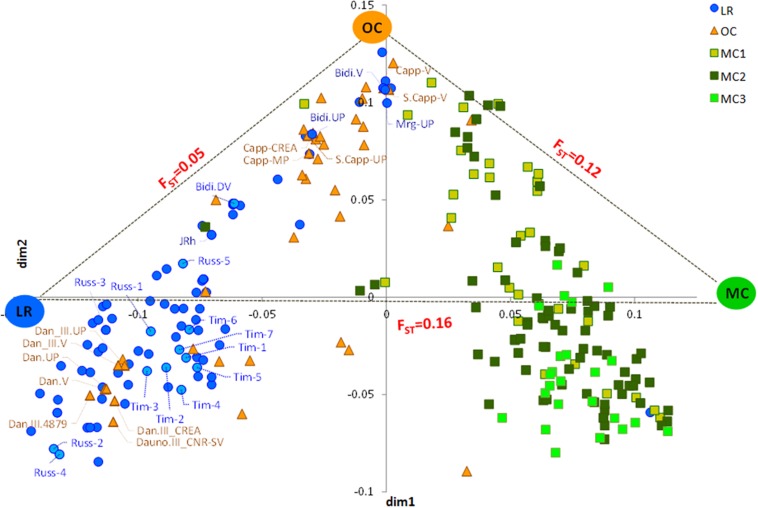
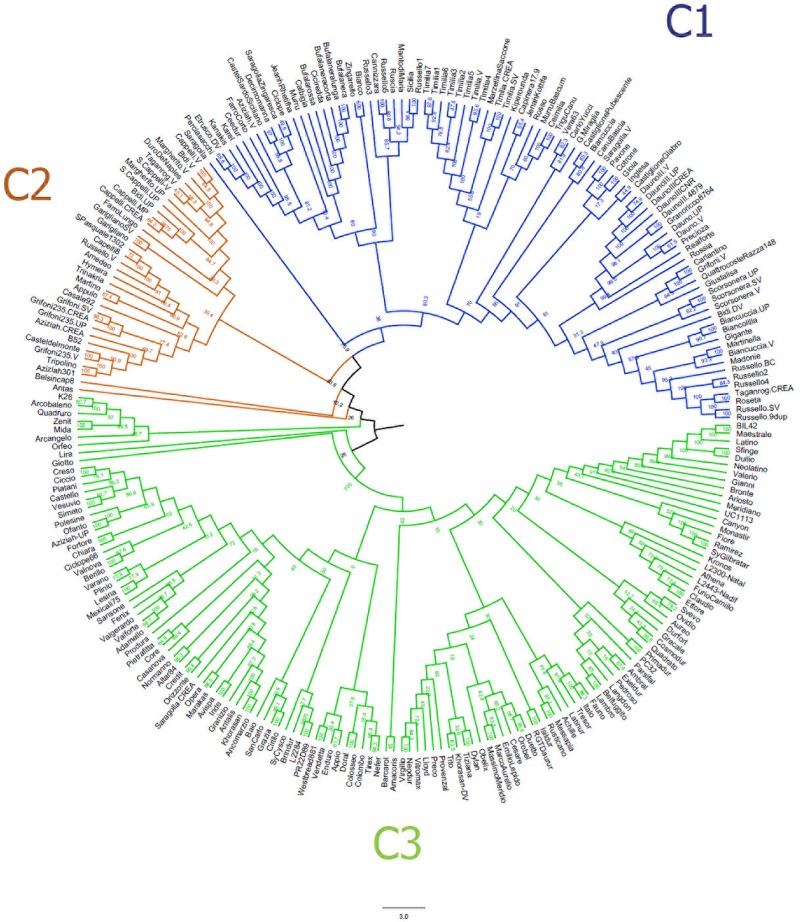
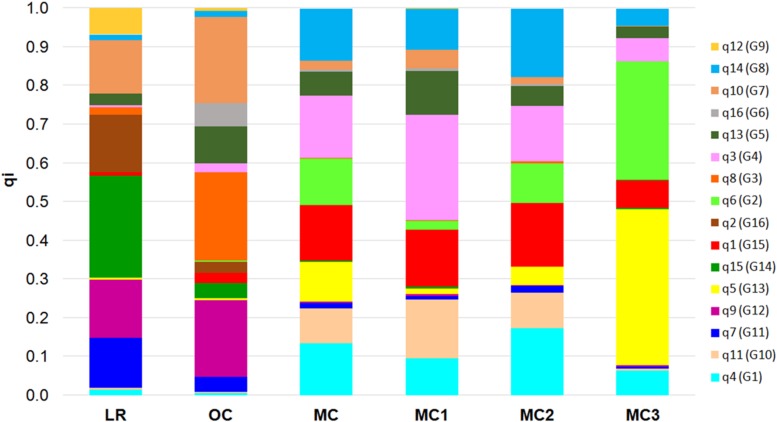
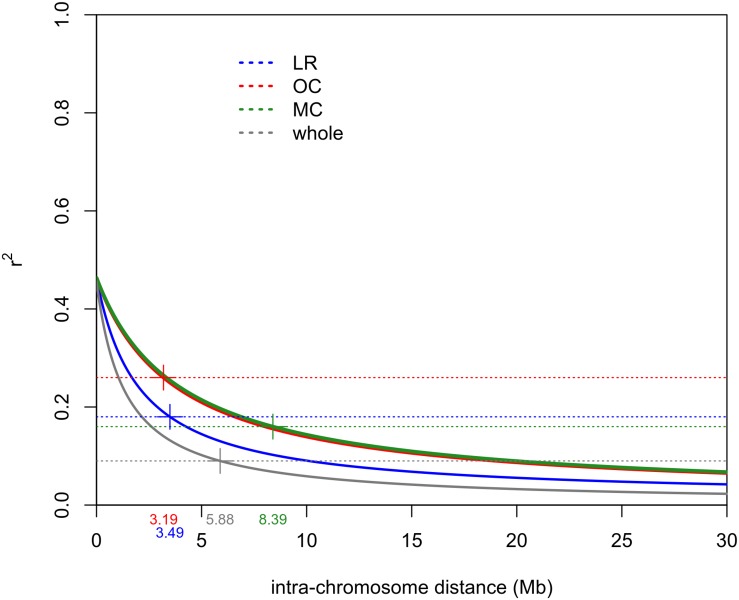
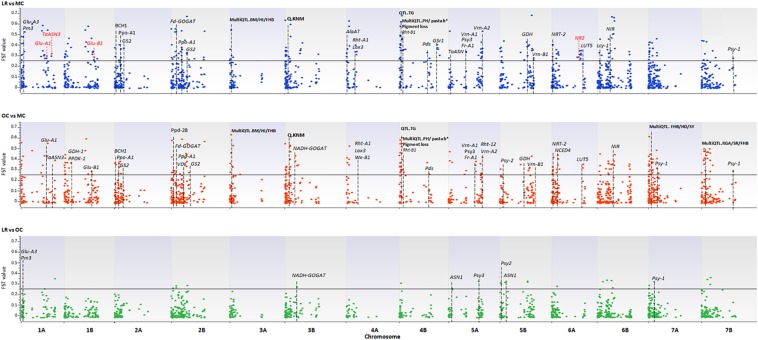
The first breeding program in the world for durum wheat was conceived in Italy in the early 1900s. Over the decades, pressure exerted by natural and artificial selection could have progressively reduced the genetic diversity of the durum wheat germplasm. In the present study, a large panel of Italian durum wheat accessions that includes landraces, old and modern cultivars was subjected to genotyping using the Illumina iSelect 15K wheat SNP array. The aim was to assess the impact that selection has in shaping Italian durum wheat genetic diversity and to exploit the patterns of genetic diversity between populations to identify molecular signatures of divergence and selection. Relatively small differences in genetic diversity have been observed among accessions, which have been selected and cultivated in Italy over the past 150 years. Indeed, directional selection combined with that operated by farmers/breeders resulted in the increase of linkage disequilibrium (LD) and in changes of the allelic frequencies in DNA regions that control important agronomic traits. Results from this study also show that major well-known genes and/or QTLs affecting plant height (RHT), earliness (VRN, PPD) and grain quality (GLU, PSY, PSD, LYC, PPO, LOX3) co-localized with outlier SNP loci. Interestingly, many of these SNPs fall in genomic regions where genes involved in nitrogen metabolism are. This finding highlights the key role these genes have played in the transition from landraces to modern cultivars. Finally, our study remarks on the need to fully exploit the genetic diversity of Italian landraces by intense pre-breeding activities aimed at introducing a new source of adaptability and resistance in the genetic background of modern cultivars, to contrast the effect of climate change. The list of divergent loci and loci under selection associated with useful agronomic traits represents an invaluable resource to detect new allelic variants for target genes and for guiding new genomic selection programs in durum wheat.

Keywords: SNP array genotyping; divergent loci; durum wheat; genetic diversity; loci under selection; nitrogen metabolism; population structure; private alleles.


Figures

FIGURE 1
FIGURE 1
Multidimensional scaling (MDS) plot representing relationships between the 259 durum wheat accessions under investigation. The plot visualizes genome-wide IBS (identity-by-state) pairwise distances between accessions based on 3,541 SNP markers. Colors refer to five different groups (i.e., LR, OC, MC1, MC2, and MC3). Pairwise FST distance values between the three main sub-populations (i.e., LR, OC and MC) were also reported. LR, landraces; OC, old cultivars; MC, modern cultivars; Tim, TIMILIA; Russ, RUSSELLO; S. Capp, SENATORE CAPPELLI; JRh, JEAN RHETIFAH; Mrg, MARGHERITO; Dan, DAUNO.
FIGURE 2
FIGURE 2
Neighbor-joining tree based on the genetic distances for 259 durum wheat accessions using 3,541 single nucleotide polymorphisms. Accessions are colored in blue (landraces), orange (old cultivars) and green (modern cultivars).
FIGURE 3
FIGURE 3
Bar plot that describes the ancestry proportions contributed by K ancestral source populations by calculating the average value of each of the 16 membership coefficients (qi) for each of the six groups a priori defined (i.e., LR, OC, MC, MC1, MC2, and MC3). LR, landraces; OC, old cultivars; MC, modern cultivars.
FIGURE 4
FIGURE 4
Intra-chromosomal LD decay distance (Mb) evaluated considering only 41 accessions for each sub-population (i.e., LR, OC and MC) and 123 accessions for the whole population. This was done to exclude possible bias due to the different sizes of sub-populations. Dashed lines indicate the r2 threshold for each dataset. The intersection point between the decay LD curve and the LD threshold was indicated by “+.” LR, landraces; OC, old cultivars; MC, modern cultivars.
FIGURE 5
FIGURE 5
The Manhattan plots show the results of the FST outlier tests performed between pairs of sub-populations (i.e., LR, OC, and MC). Zavitan chromosomes are indicated on the x-axis. The FST values (y-axis) indicate an outlier SNP when higher than the threshold (FST = 0.25) delineated by a continuous black line. LR, landraces; OC, old cultivars; MC, modern cultivars. Red arrows and the star indicate those genes harboring outlier SNPs. Dashed lines indicate genes/QTLs in the ±6 Mb flanking region of the outlier SNP. Gene name abbreviation: Glu-A1, high molecular weight glutenin subunit; Glu-A3, low molecular weight glutenin subunit; Glu-B1, high molecular weight glutenin subunit; Pm3, powdery mildew resistance; TaASN3, asparagine synthetase 3; NR1, nitrate reductase 1; Fd-GOGAT, ferredoxin-dependent glutamate synthase; NADH-GOGAT, NADH-glutamine oxoglutarate aminotransferase; GDH, glutamate dehydrogenase; GS, glutamine synthetase; Gsr1, Glutamine synthetase 1; NRT-2, nitrate transporter; ASN1/2, glutamine-dependent asparagine synthetase1/2; Rht1/12, plant height; Vrn-1/2, vernalization; Ppd, photoperiod response; Psy, phytoene synthase; Pds, phytoene desaturase; Lyc, lycopene cyclase; Ppo, polyphenol oxidase; Lox3, lipoxygenase; Wx, waxy. QTL name, abbreviation (in bold): BM, biomass; HI, harvester index; FBH, Fusarium head blight resistance; HD, heading date; YR, yellow rust; SR, stem rust; SL, spike length; SLNS, spikelets per spike; TRL, total root length; KNS, kernel number per spike; TW, test weight; KNM, kernel number of main spike; TNR, total root number; ARL, average root length; PRL, primary root length; GY, grain yield; PA, phytic acid; PH, plant height; TKW, thousand kernel weight; days from booting to anthesis (DSB); TG, tough glume and RGA, root growth angle.

Similar articles

Cited by

References

    1. Alexander D. H., Lange K. (2011). Enhancements to the ADMIXTURE algorithm for individual ancestry estimation. BMC Bioinformatics 12:246. 10.1186/1471-2105-12-246 - DOI - PMC - PubMed
    1. Alexander D. H., Novembre J., Lange K. (2009). Fast model-based estimation of ancestry in unrelated individuals. Genome Res. 19 1655–1664. 10.1101/gr.094052.109 - DOI - PMC - PubMed
    1. Allaby R. G., Ware R. L., Kistler L. (2019). A re-evaluation of the domestication bottleneck from archaeogenomic evidence. Evol. Appl. 12 29–37. 10.1111/eva.12680 - DOI - PMC - PubMed
    1. Atif R. M., Shahid L., Waqas M., Ali B., Rashid M. A. R., Azeem F., et al. (2019). Insights on calcium-dependent protein kinases (CPKs) signaling for abiotic stress tolerance in plants. Int. J. Mol. Sci. 20:5298. 10.3390/ijms20215298 - DOI - PMC - PubMed
    1. Autrique E., Nachit M., Monneveux P., Tanksley S. D., Sorrells M. E. (1996). Genetic diversity in durum wheat based on RFLPs, morphophysiological traits, and coefficient of parentage. Crop Sci. 36 735–742. 10.2135/cropsci1996.0011183X003600030036x - DOI