. 2020 Apr 6;10(12):5290-5304.
doi: 10.7150/thno.42658. eCollection 2020.

PTPROt aggravates inflammation by enhancing NF-κB activation in liver macrophages during nonalcoholic steatohepatitis

Affiliations

PTPROt aggravates inflammation by enhancing NF-κB activation in liver macrophages during nonalcoholic steatohepatitis

Kangpeng Jin et al. Theranostics. .

Erratum in

Abstract

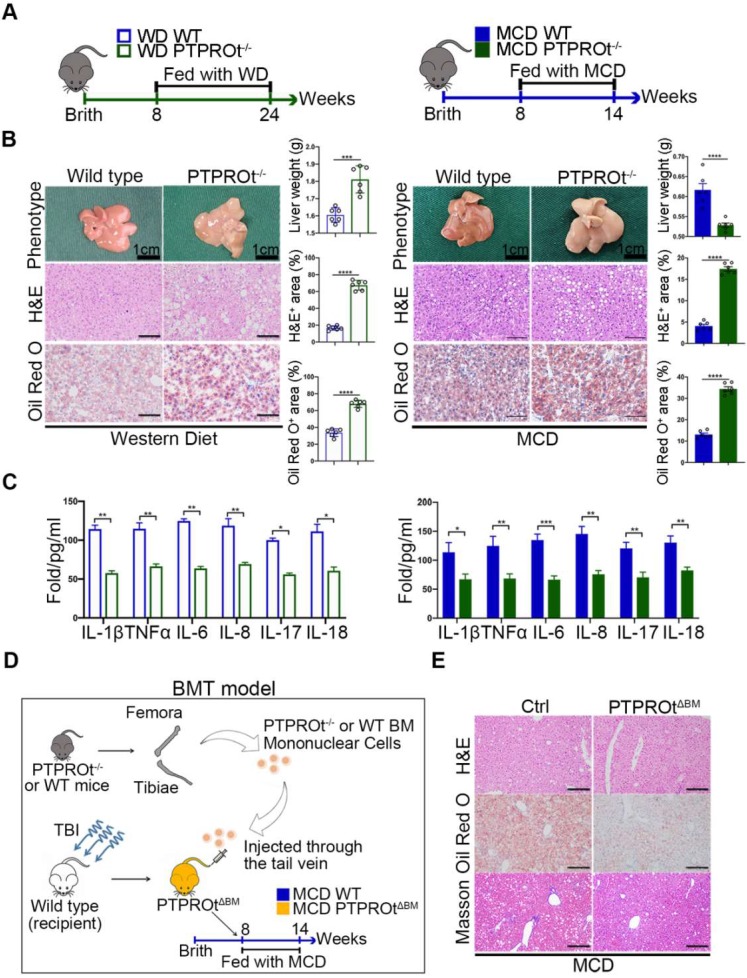
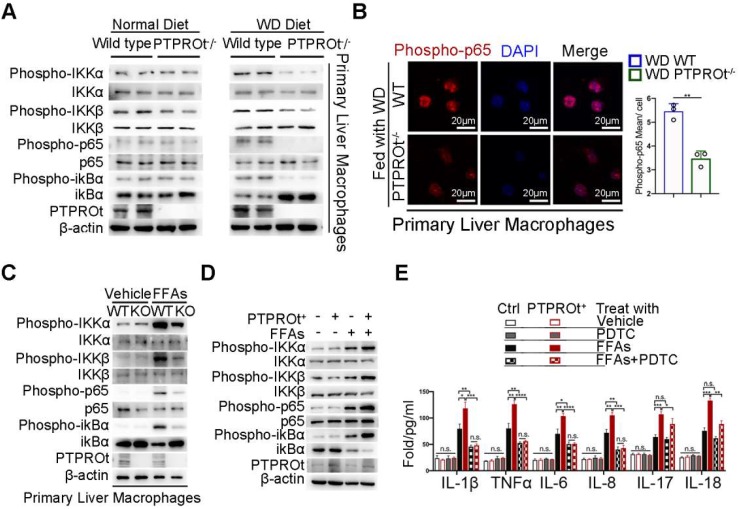
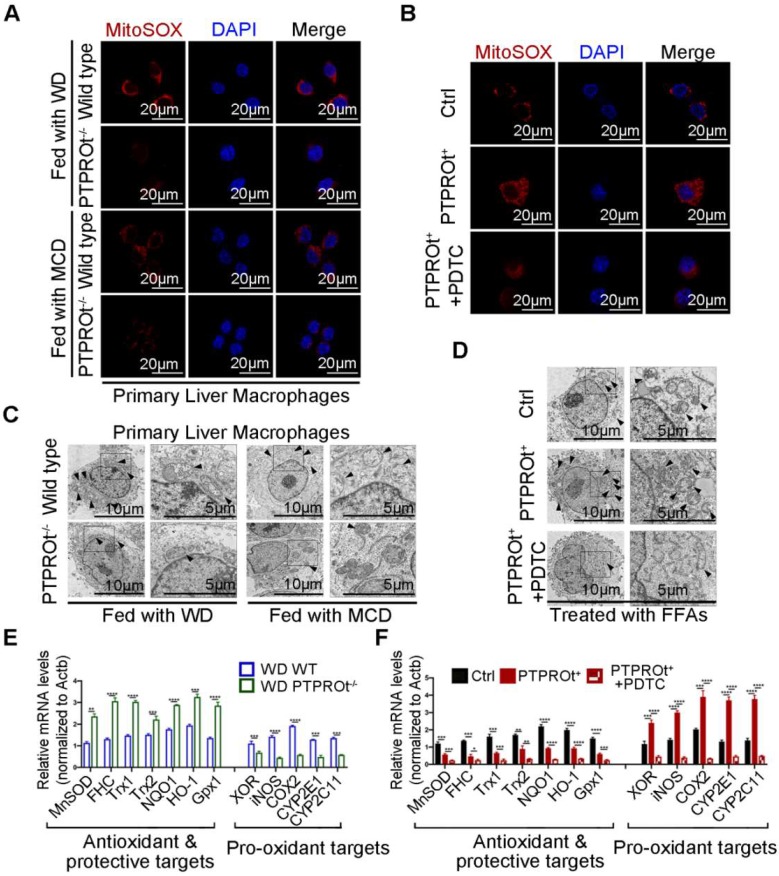
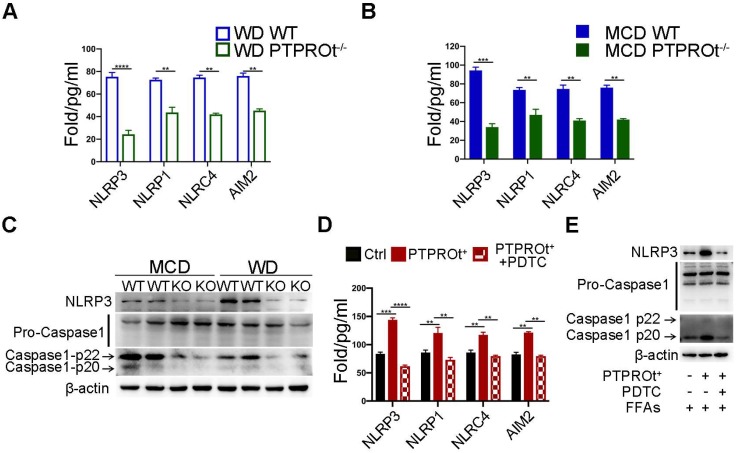
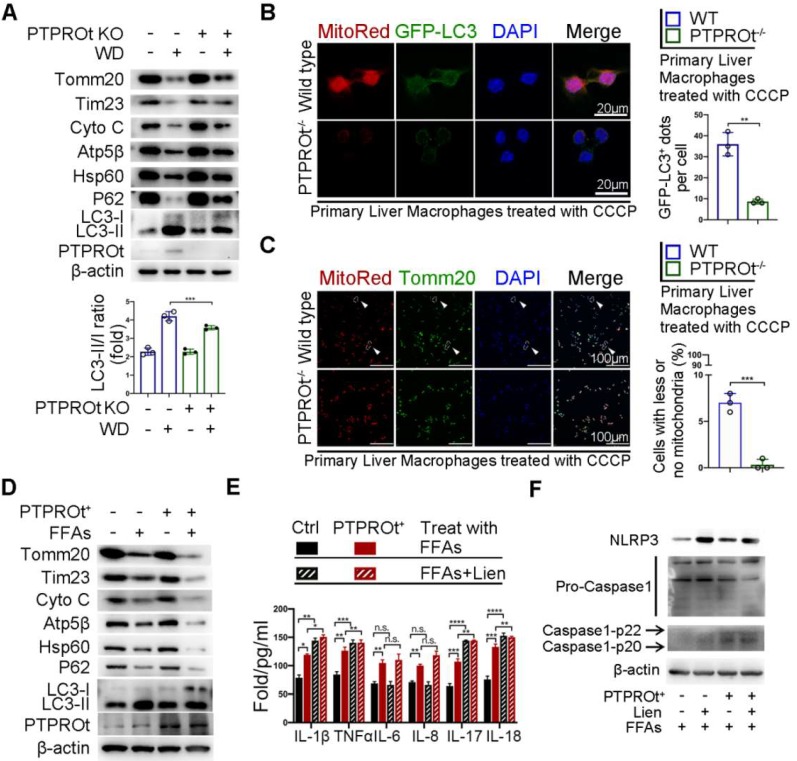
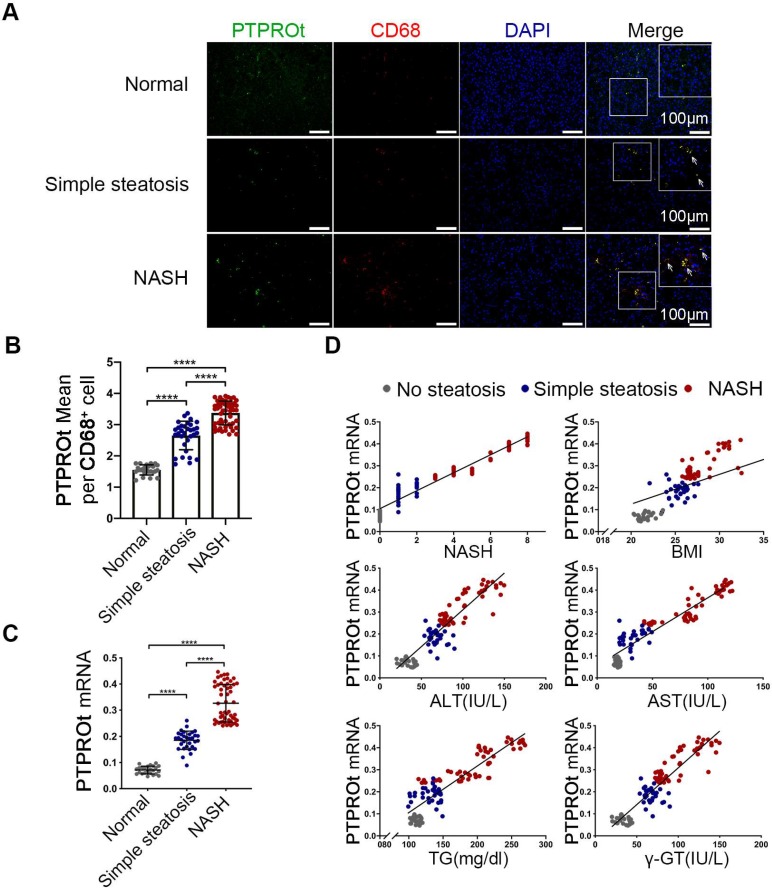
Rationale: Inflammation plays a crucial role in the progression of nonalcoholic steatohepatitis (NASH). Protein tyrosine phosphatase receptor type O truncated isoform (PTPROt) is an integral membrane protein that has been identified in osteoclasts, macrophages, and B lymphocytes. However, its relationship between inflammation and NASH is largely unknown. Herein, we aimed to study the function of PTPROt in NASH progression. Methods: We established a NASH mouse model in wild-type (WT), PTPRO knockout mice by western diet (WD) and methionine-choline-deficient diet (MCD). In addition, MCD-induced NASH model was established in BMT mice. Moreover, we determined the expression of PTPROt in liver macrophages in human subjects without steatosis, with simple steatosis, and with NASH to confirm the relationship between PTPROt and NASH. In vitro assays were also performed to study the molecular role of PTPROt in NASH progression. Results: Human samples and animal model results illustrated that PTPROt is increased in liver macrophages during NASH progression and is positively correlated with the degree of NASH. Our animal model also showed that PTPROt in liver macrophages can enhance the activation of the NF-κB signaling pathway, which induces the transcription of genes involved in the inflammatory response. Moreover, PTPROt promotes the transcription of pro-oxidant genes and inhibits antioxidant and protective genes via increased activation of the NF-κB signaling pathway, thereby causing an increased level of reactive oxygen species (ROS) and damaged mitochondria. This triggers the NLRP3-IL1β axis and causes a heightened inflammatory response. Notably, PTPROt partially limits inflammation and ROS production by promoting mitophagy, which participates in a negative feedback loop in this model. Conclusions: Our data strongly indicate that PTPROt plays a dual role in inflammation via the NF-κB signaling pathway in liver macrophages during NASH. Further studies are required to explore therapeutic strategies and prevention of this common liver disease through PTPROt.

Keywords: Inflammasome; Mitochondria; Mitophagy; NLR family pyrin domain containing 3; Reactive oxygen species.


Conflict of interest statement

Competing Interests: The authors have declared that no competing interest exists.

Figures

Figure 1
Figure 1
Protein tyrosine phosphatase receptor type O truncated isoform (PTPROt) deficiency in liver macrophages causes decreased inflammation during nonalcoholic steatohepatitis (NASH). A. The western diet-induced and methionine-choline-deficient (MCD)-induced NASH model in wild-type and PTPROt konckout mice. B.The liver from the mice described in Figure 1A (Bar = 1 cm). Liver sections were stained with Hematoxylin and Eosin (H&E) and Oil-Red O. Original magnification, ×20. Bar = 100 μm. Statistical analysis of liver weights and the number of H&E and Oil-Red O stained signal points in the above samples. C. The levels of IL-1β, TNFα, IL-6, IL-8, IL-17, and IL-18 in liver macrophages isolated from the liver samples in Figure 1B, as detected by ELISA. D. The MCD-induced NASH model in BMT mice. E. The liver from the mice described in Figure 1D. Liver sections were stained with Hematoxylin and Eosin (H&E), Oil-Red O and Masson. Original magnification, ×20. Bar = 100 μm. Abbreviations: BM: Bone marrow; BMT: Bone Marrow Transplantation; H&E: hematoxylin-eosin staining; MCD: Methionine-choline-deficient; PTPROtΔBM: Bone marrow mononuclear-specific knockout PTPROt mice; TBI: Total body irradiation; WD: Western diet.
Figure 2
Figure 2
PTPROt deficiency in liver macrophages causes decreased activation of the NF-κB signaling pathway. A. Immunoblotting of phospho-IKKα, IKKα, phospho-IKKβ, IKKβ, phospho-P65, P65, phospho-ikBα, ikBα, PTPROt, and β-actin (loading control) in primary WT and PTPROt-/- liver macrophages that were isolated from the mice described in Figure 1A. B. Fluorescence microscopy of phospho-p65 in primary WT and PTPROt-/- liver macrophages isolated from the mice described in Figure 1A. DAPI, DNA-binding dye. Bar = 20 μm. Quantification of phospho-P65 per cell was shown. C. Immunoblotting of phospho-IKKα, IKKα, phospho-IKKβ, IKKβ, phospho-P65, P65, phospho-ikBα, ikBα, PTPROt, and β-actin (loading control) in primary liver macrophages isolated from WT and PTPROt-/- mice treated with vehicle and free fatty acids (FFAs) for 24 hr. D. Immunoblotting of phospho-IKKα, IKKα, phospho-IKKβ, IKKβ, phospho-P65, P65, phospho-ikBα, ikBα, PTPROt, and β-actin (loading control) in RAW-ctrl and RAW-PTPROt+ cells treated with/without FFAs for 24 hr. E. The levels of IL-1β, TNFα, IL-6, IL-8, IL-17, and IL-18 in cell culture supernatants from RAW-ctrl and RAW-PTPROt+ cells treated with or without FFAs and/or PDTC for 24 hr were detected by ELISA. Abbreviations: DAPI: 4',6-diamidino-2-phenylindole; FFAs: Free Fatty Acids; KO: the primary liver macrophages isolated from PTPROt knockout mice; PDTC: Pyrrolidine dithiocarbamate; WT: the primary liver macrophages isolated from wild-type mice.
Figure 3
Figure 3
PTPROt deficiency in liver macrophages suppresses the production of reactive oxygen species (ROS) by inhibiting NF-κB, which reduces pro-oxidant gene expression and promotes antioxidant gene expression. A. Fluorescence microscopy of ROS (identified with MitoSOX) in primary liver macrophages isolated from the mice described in Figure 1A, B. DAPI, DNA-binding dye. Bar = 20 μm. B. Fluorescence microscopy of ROS (MitoSOX) in RAW-Ctrl or RAW-PTPROt+ cells treated with free fatty acids (FFAs), with or without pyrrolidine dithiocarbamate (PDTC) for 24 hr. DAPI, DNA-binding dye. Bar= 20 μm. C. Transmission electron microscopy of primary liver macrophages isolated from the mice described in Figure 1A, B. The arrows indicate mitochondria in liver marcophages. Bar (left) = 10 μm, Bar (right) = 5 μm. D. Transmission electron microscopy of RAW-Ctrl or RAW-PTPROt+ cells treated with FFAs, with or without PDTC for 24 hr. The arrows indicate mitochondria in liver marcophages. Bar (left) = 10 μm, Bar (right) = 5 μm. E. RT-qPCR results showing the relative mRNA levels of antioxidant and protective targets (MnSOD, FHC, Trx1, Trx2, NQO1, HO-1 and Gpx1) and pro-oxidant targets (XOR, iNOS, COX2, CYP2E1 and CYP2C11) in primary liver macrophages isolated from the mice described in Figure 1A, B. F. RT-qPCR results showing the relative mRNA levels of antioxidant & protective targets (MnSOD, FHC, Trx1, Trx2, NQO1, HO-1 and Gpx1) and pro-oxidant targets (XOR, iNOS, COX2, CYP2E1 and CYP2C11) in RAW-Ctrl and RAW-PTPROt+ cells treated with FFAs, with or without PDTC for 24 hr. Abbreviations: DAPI: 4',6-diamidino-2-phenylindole; FFAs: Free Fatty Acids; MCD: Methionine-choline-deficient; PDTC: Pyrrolidine dithiocarbamate; WD: Western diet; MitoSOX: Mitochondrial Superoxide Indicator.
Figure 4
Figure 4
PTPROt deficiency suppresses ROS production leading to decreased activation of the NLRP3-caspase-1 axis. A. NLRP3, NLRP1, NLRC4, and AIM2 in cell homogenates from primary liver macrophages isolated from the mice described in Figure 1A. B. NLRP3, NLRP1, NLRC4, and AIM2 in cell homogenates from primary liver macrophages isolated from the mice described in Figure 1B. C. Immunoblotting of NLRP3, pro-caspase-1, caspase-1-p22, caspase-1-p20, and β-actin (loading control) in primary liver macrophages isolated from the mice described in Figure 1A, B. D. NLRP3, NLRP1, NLRC4, and AIM2 in cell culture supernatants from RAW-ctrl and RAW-PTPROt+ cells treated with free fatty acids (FFAs), with or without pyrrolidine dithiocarbamate (PDTC) for 24 hr. E. Immunoblotting of NLRP3, pro-caspase-1, caspase-1-p22, caspase-1-p20, and β-actin (loading control) in RAW-PTPROt+ cell lines treated with FFAs, with or without PDTC for 24 hr. Abbreviations: AIM2: Absent In Melanoma 2; MCD: methionine-choline-deficient diet; FFAs: Free fatty acids; NLRC4: NLR family CARD domain-containing protein 4; NLRP1: NLR family pyrin domain containing 1; NLRP3: NLR family pyrin domain containing 3; KO: the primary liver macrophages isolated from PTPROt knockout mice; PDTC: Pyrrolidine dithiocarbamate; WD: Western diet; WT: the primary liver macrophages isolated from wild-type mice.
Figure 5
Figure 5
PTPROt deficiency in liver macrophages aggravates inflammation and ROS production by limiting the NF-κB signaling pathway, resulting in suppressed mitophagy. A. Immunoblotting of Tomm20, Tim23, Cyto C, Atp5β, Hsp60, P62, LC3-I, LC3-II, PTPROt, and β-actin (loading control) in primary liver macrophages isolated from the mice described in Figure 1A. B. Fluorescence microscopy showing co-localization of GFP-LC3 with mitochondria [identified with the mitochondrial stain MitoTracker Deep Red (Mito-Red)] in primary liver macrophages isolated from the mice described in Figure 1A treated with CCCP for 2 hr. Bar = 20 μm. Quantification of GFP-LC3 puncta co-localized with mitochondria per cell was shown. C. Fluorescence microscopy showing co-localization of anti-Tomm20 with mitochondria [identified with the mitochondrial stain MitoTracker Deep Red (Mito-Red)] in primary liver macrophages isolated from the mice described in Figure 1A treated with CCCP for 2 hr. The arrows indicate the cells staining with MitoRed+ and Anti-Tomm20-. Bar = 100 μm. Frequency of cells with few or no mitochondria was shown. D. Immunoblotting of Tomm20, Tim23, Cyto C, Atp5β, Hsp60, P62, LC3-I, LC3-II, PTPROt, and β-actin (loading control) in RAW-Ctrl and RAW-PTPROt+ cells treated with FFAs for 24 hr. E. ELISA results showing the levels of IL-1β, TNFα, IL-6, IL-8, IL-17, and IL-18 in cell culture supernatants of RAW-Ctrl and RAW-PTPROt+ cells treated with or without free fatty acids (FFAs) and/or liensinine for 24 hr. F. Immunoblotting of NLRP3, pro-caspase-1, caspase-1-p22/p20, and β-actin (loading control) in RAW-Ctrl and RAW-PTPROt+ cells treated with CCCP and/or liensinine for 2 hr. Abbreviations: CCCP: Carbonyl cyanide m-chlorophenylhydrazone; Cyto C: Cytochrome C; DAPI: 4',6-diamidino-2-phenylindole; FFAs: Free Fatty Acids: Lien: Liensinine; MitoRed: Mitotracker Red probe; WD:Western diet.
Figure 6
Figure 6
Increased PTPROt expression in human fatty liver macrophages is associated with the severity of nonalcoholic fatty liver disease (NAFLD). A. Fluorescence microscopy of PTPROt and CD68 in the section from the liver tissues of individuals without NAFLD (no steatosis; n = 24), with simple steatosis (n = 32), or with NASH (n = 54), described in Table S3. (Green: PTPROt; Red: CD68; Blue: DAPI; Bar = 100 μm). B. Statistical analysis of PTPROt signal points in Figure 6A. C. PTPROt mRNA levels in liver macrophages isolated from the livers of individuals without NAFLD (no steatosis; n = 24), with simple steatosis (n = 32), or with NASH (n = 54), described in Table S3. D. Pearson's comparison analyses of the correlation between PTPROt mRNA levels described in Fig 1.C and NASH (r = 0.9274), BMI (r = 0.6307), serum ALT concentrations (r = 0.8391), serum AST concentrations (r = 0.8739), serum TG concentrations (r = 0.7875) and serum γ-GT concentrations (r = 0.8391) (n = 110). P < 0.0001 for all of these correlations by Spearman's rank correlation coefficient analysis. Abbreviations: ALT: Alanine aminotransferase; AST: Alanine aminotransferase; BMI: body mass index; DAPI: 4',6-diamidino-2-phenylindole; HDL: High Density Lipoprotein; LDL: Low Density Lipoprotein; NASH: nonalcoholic steatohepatitis; PTPROt: Protein tyrosine phosphatase receptor type O truncated isoform; qRT-PCR: quantitative real-time PCR; TG: Triglyceride; γ-GT: γ-glutamyl transpeptidase.

Similar articles

Cited by

References

    1. Eslam M, Valenti L, Romeo S. Genetics and epigenetics of NAFLD and NASH: Clinical impact. J Hepatol. 2018;68:268–79. - PubMed
    1. Fabbrini E, Sullivan S, Klein S. Obesity and nonalcoholic fatty liver disease: biochemical, metabolic, and clinical implications. Hepatology. 2010;51:679–89. - PMC - PubMed
    1. Cohen JC, Horton JD, Hobbs HH. Human fatty liver disease: old questions and new insights. Science. 2011;332:1519–23. - PMC - PubMed
    1. Liu X-B, Lo C-M, Cheng Q, Ng KT-P, Shao Y, Li C-X. et al. Oval Cells Contribute to Fibrogenesis of Marginal Liver Grafts under Stepwise Regulation of Aldose Reductase and Notch Signaling. Theranostics. 2017;7:4879–93. - PMC - PubMed
    1. Byrne CD, Targher G. NAFLD: a multisystem disease. J Hepatol. 2015;62:S47–64. - PubMed

Publication types