. 2020 Apr 25;10(12):5581-5599.
doi: 10.7150/thno.44687. eCollection 2020.

miR-182-3p/Myadm contribute to pulmonary artery hypertension vascular remodeling via a KLF4/p21-dependent mechanism

Affiliations

miR-182-3p/Myadm contribute to pulmonary artery hypertension vascular remodeling via a KLF4/p21-dependent mechanism

Lan Sun et al. Theranostics. .

Abstract

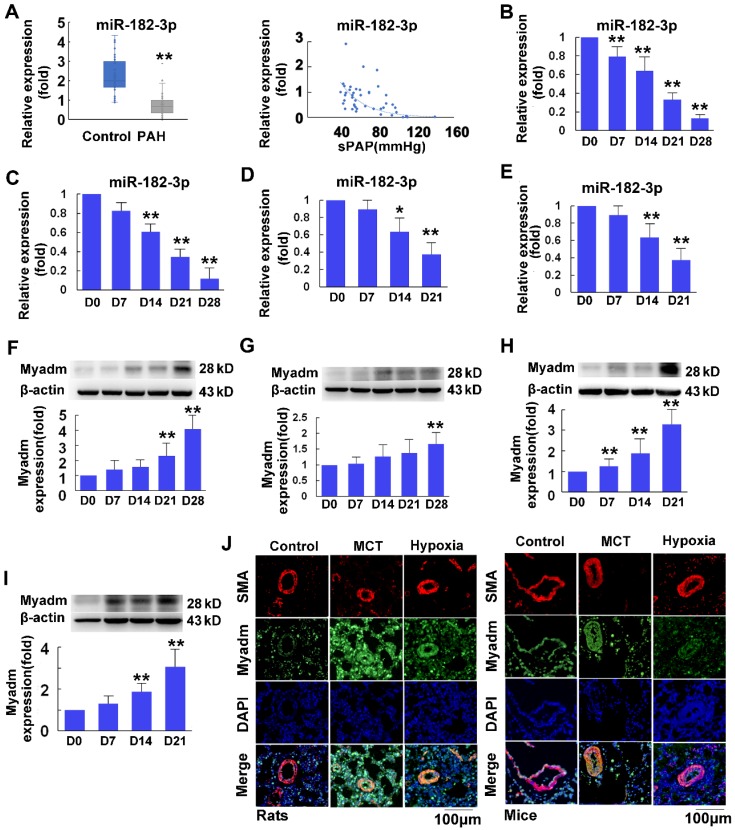
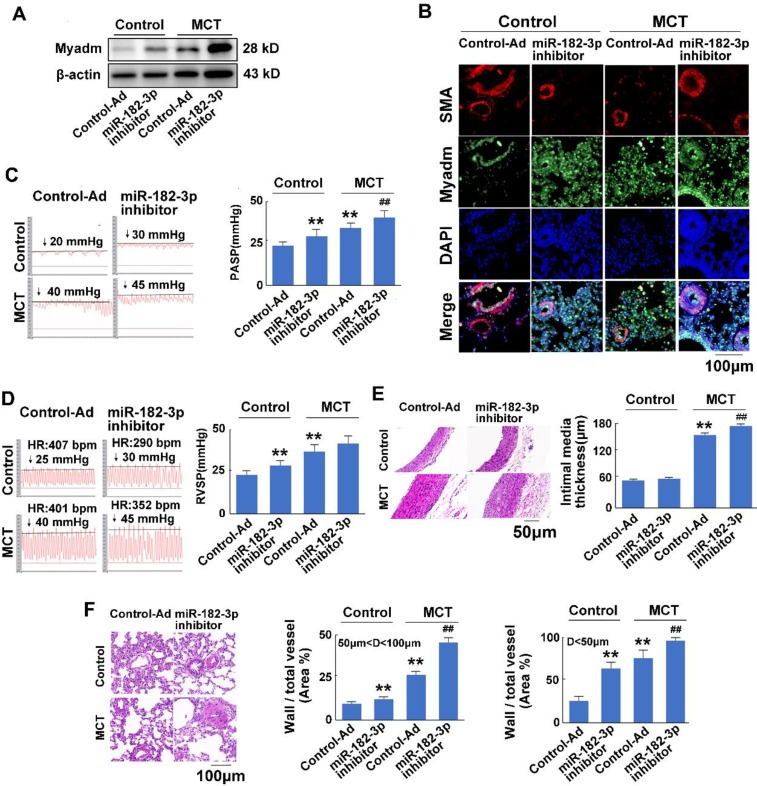
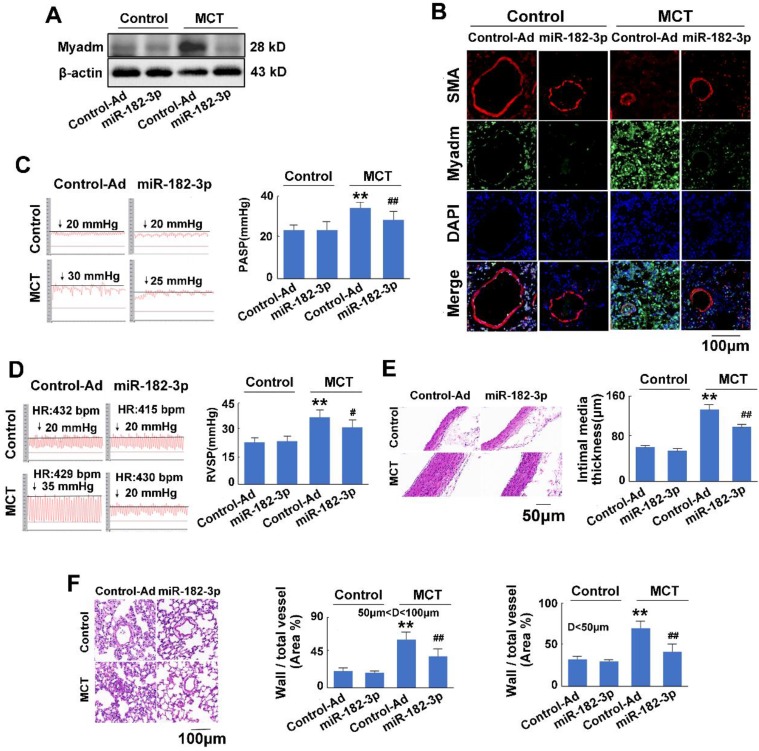
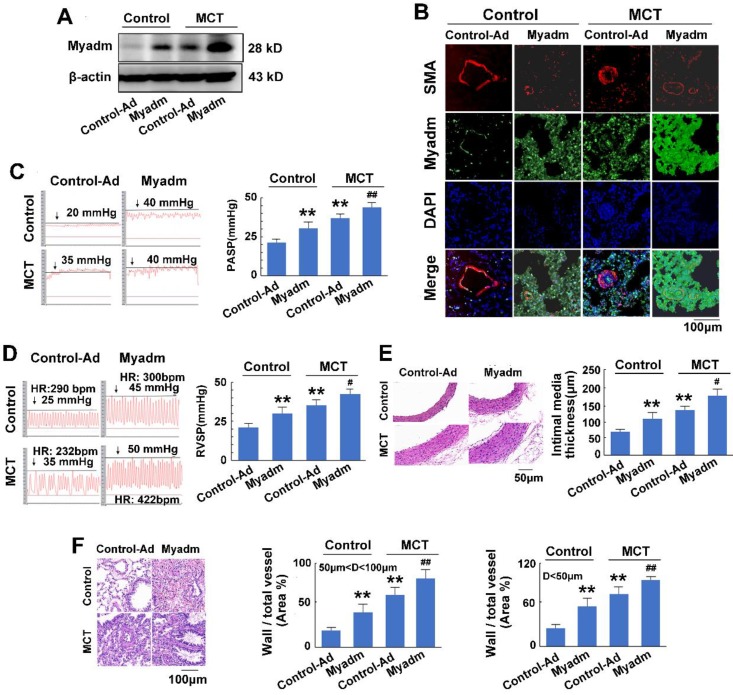
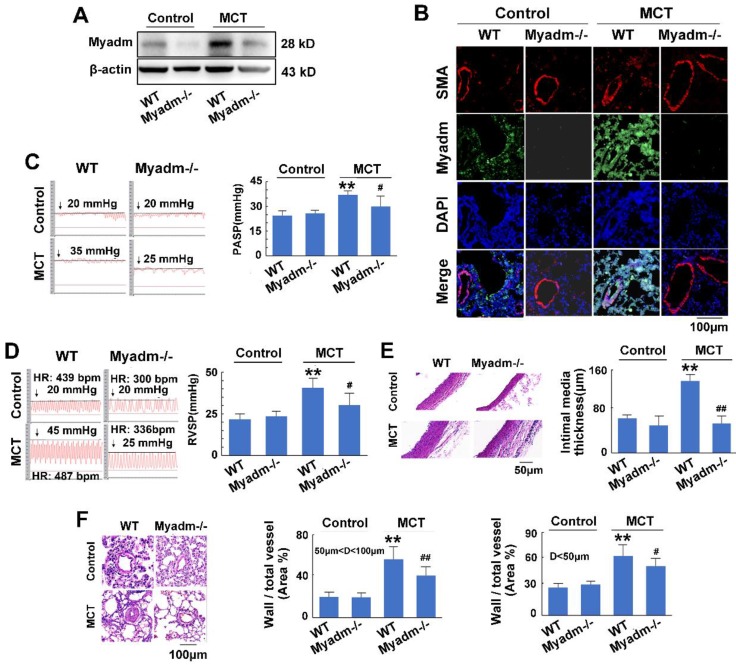
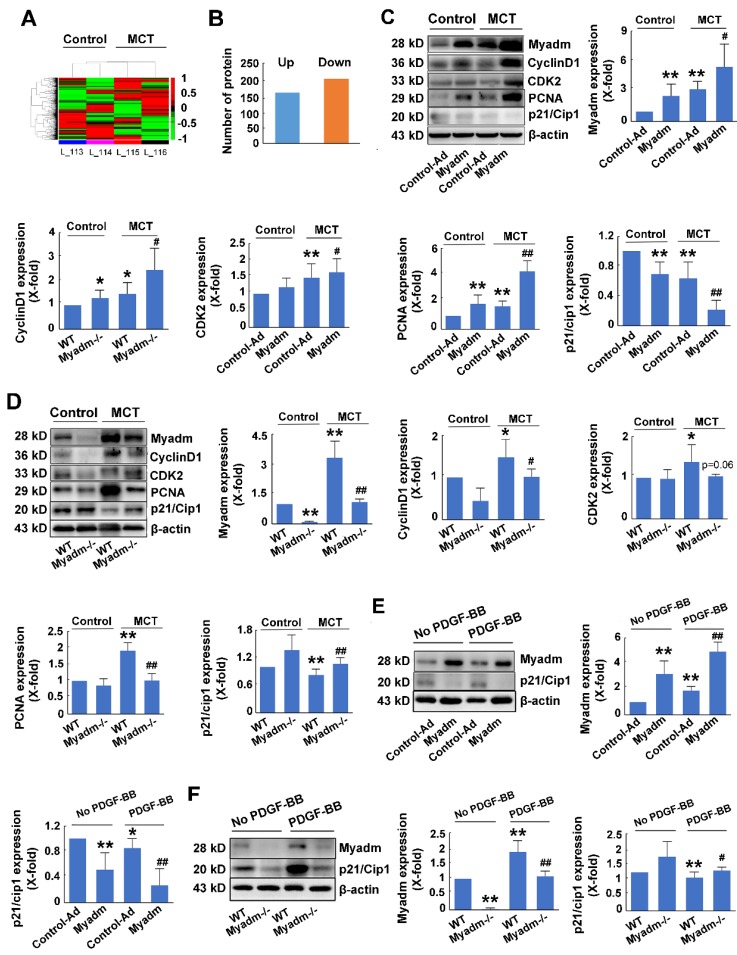
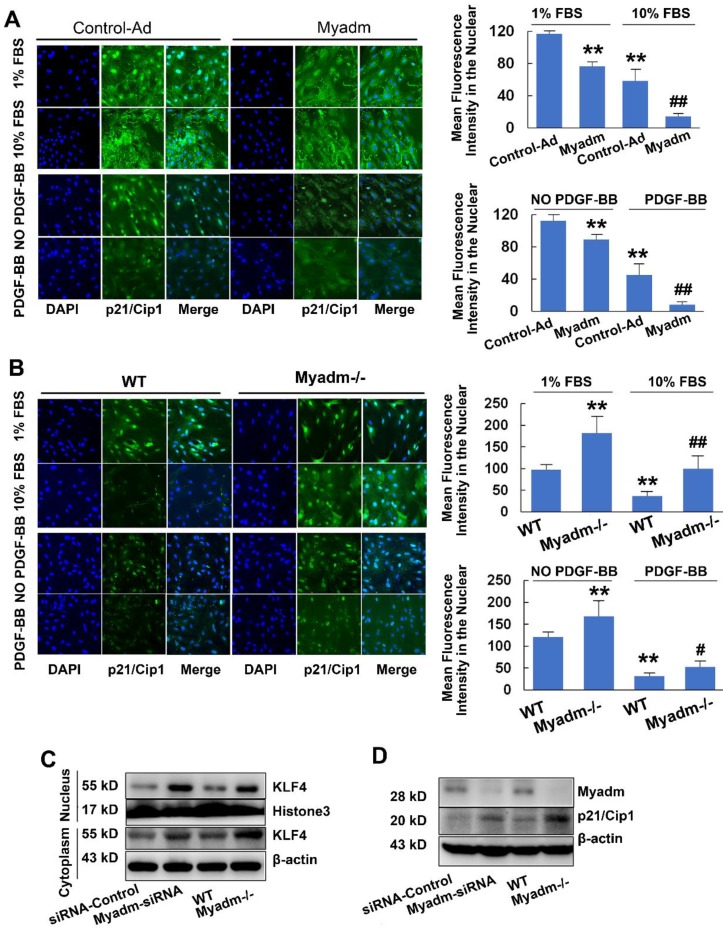
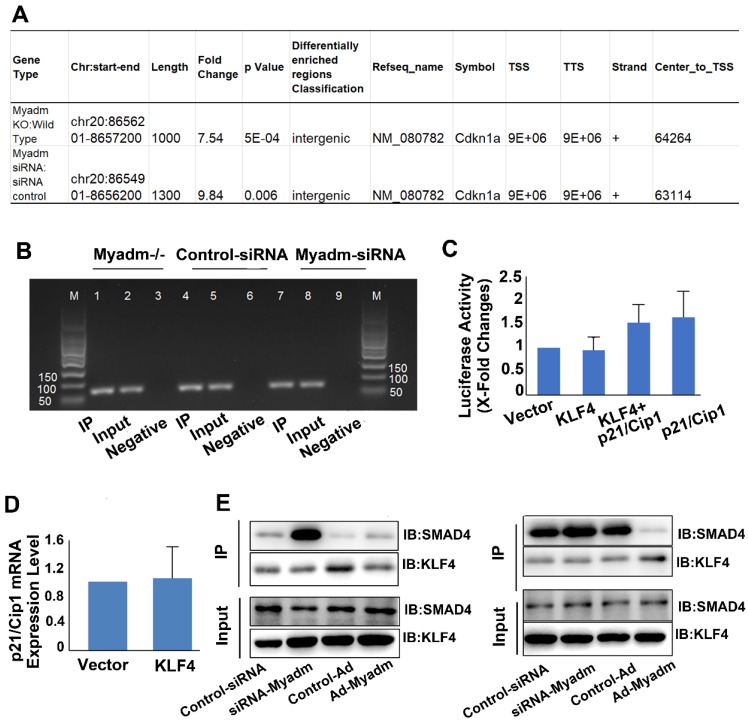
Rationale: There is a continued need for investigating the roles of microRNAs and their targets on the pathogenesis of pulmonary arterial hypertension (PAH) vascular remodeling. We recently identified the association of myeloid miR-182-3p and its new target, Myeloid-Associated Differentiation Marker (Myadm), with vascular remodeling. Here, we aimed to determine the role of miR-182-3p/Myadm on PAH vascular remodeling and the underlying molecular mechanism. Methods: The miR-182-3p/Myadm expression profiles were detected in PAH patients and experimental rodent models. Loss-of-function and gain-of-function studies using gene knock-in or gene knock-out and the combinations of the proteomic technology and genome-wide ChIP-Seq were employed to determine the downstream targets of miR-182-3p/Myadm in response to monocrotaline (MCT)-induced PAH. Results: The miR-182-3p/Myadm expression was altered in PAH patients and experimental rodent models. Both miR-182-3p inhibitor and overexpression of Myadm augmented the pathological progression in rats in response to MCT-induced PAH. In contrast, miR-182-3p mimic and Myadm gene knockout attenuated the changes in the hemodynamics and structure of the cardio-pulmonary system in MCT-induced PAH in rats. Myadm mediated the proliferation of pulmonary artery smooth muscle cells (PASMCs) by altering the cell cycle kinase inhibitor (p21/Cip1) expression through the transcription factor Krüppel-like factor 4 (KLF4) translocation into the cytoplasm. Conclusion: Our findings indicate the prognostic and therapeutic significance of miR-182-3p in PAH and provide a new regulatory model of the myeloid-derived miR-182-3p/Myadm/KLF4/p21 axis in PAH vascular remodeling.

Keywords: microRNA; myeloid; p21/Cip1.; pulmonary artery hypertension; vascular remodeling.


Conflict of interest statement

Competing Interests: The authors have declared that no competing interest exists.

Figures

Figure 1
Figure 1
Plasma miR-182-3p levels in pulmonary hypertension patients and miR-182-3p and Myadm protein expression levels in the lungs from PAH rodent models. A, Left panel: A boxplot graph indicates that plasma miR-182-3p levels (in relation to U48) are lower in PAH patients (n=46) (grey sub-panel) compared with control subjects (blue sub-panel) without PAH (n=71). Each point represents a relative expression level of miR-182-3p from individual patients or control subjects. Right panel: Plasma miR-182-3p levels are negatively correlated with pulmonary artery systolic pressure in PAH patients. B-C: After a 4-week administration of MCT, miR-182-3p expression levels in the lungs from the rats (B) and mice (C) were detected using qRT-PCR. D-E: After a 3-week 10% hypoxia exposure, miR-182-3p expression levels in the lungs from the rats (D) and mice (E) were detected using qRT-PCR. F-I: Myadm protein expression levels normalized to β-actin in the lungs from rats (F, H) and mice (G, I) were measured using Western blotting after a 4-week administration of MCT or after a 3-week 10% hypoxia exposure. Results are expressed as mean ± SEM. J: Representative lung tissue sections with co-immunofluorescence staining of Myadm (Green) and the smooth muscle marker SM-α-Actin (SMA, red). Cell nuclei were stained with DAPI (blue). Images are at 40× magnification, bar indicates 100 μm. n=6-8. *p<0.05, **P<0.01vs the D0 group.
Figure 2
Figure 2
miR-182-3p inhibitor exacerbates the pathological changes in rats in response to MCT-induced PAH. Rats were transduced with recombinant adenovirus expressing inhibitor (shRNA) against the miR-182-3p (miR-182-3p inhibitor ,1010 pfu/mL) or the control adenovirus and then were then injected subcutaneously using one dose of monocrotaline (MCT, 60 mg/kg body weight, normal saline was used as normal control). A: The Myadm protein expression levels normalized to the β-actin in the lungs from the rats were detected using Western blotting. B: Representative lung tissue sections with the co-immunofluorescent staining of Myadm (Green) and the SMA (red). Cell nuclei were stained with DAPI (blue). Images are shown at 40× magnification. The bar indicates 100 μm. Pulmonary artery systolic pressure (PASP, C) and right ventricular systolic pressure (RVSP, D) were measured by right-sided heart catheterization with a Millar pressure transducer catheter. Black line and black arrow were used to mark the pressure values. HR: heart rates; bpm: beat per minute. Lungs and pulmonary artery samples were embedded in paraffin, sliced into 5-μm sections and stained with haematoxylin and eosin (H&E). The intimal-medial thickness (E) and the ratio of the wall area to the total vessel area of pulmonary arteries with diameters of <50 μm and 50 to 100 μm (F) were measured. Images are shown at 40× (E) and 20× (F) magnification, respectively. Bar indicates 50 μm and 100 μm. The results are expressed as the means±SEMs. *p<0.05, **p<0.01 vs rats injected with control virus. #p<0.05, ##<0.01 vs rats treated with control virus and MCT. n=6-8 per group.
Figure 3
Figure 3
miR-182-3p regulates the pathological changes in rats in response to MCT-induced PAH. Rats were transduced with either recombinant adenovirus expressing the mimic of miR-182-3p (miR-182-3p, 1010 pfu/mL) or the control virus (Control-Ad) and then were injected subcutaneously using one dose of MCT. A: The Myadm protein expression levels normalized to the β-actin in the lungs from the rats were detected using Western blotting. B: Representative lung tissue sections with the co-immunofluorescent staining of Myadm (Green) and the SMA (red). Cell nuclei were stained with DAPI (blue). Images are shown at 40× magnification. The bar indicates 100 μm. PASP (C) and RVSP (D) were measured. Black line and black arrow were used to mark the pressure values. HR: heart rates; bpm: beat per minute. Lungs and pulmonary artery samples were embedded in paraffin, sliced into 5-μm sections and stained with haematoxylin and eosin (H&E). The intimal-medial thickness (E) and the ratio of the wall area to the total vessel area of pulmonary arteries with diameters of <50 μm and 50 to 100 μm (F) were measured. Images are shown at 40× (E) and 20× (F) magnification, respectively. Bar indicates 50 μm and 100 μm. The results are expressed as the means±SEMs. *p<0.05, **p<0.01 vs rats injected with control virus. #p<0.05, ##<0.01 vs rats treated with control virus and MCT. n=6-8 per group.
Figure 4
Figure 4
Myadm aggregates MCT-induced PAH vascular remodeling in rats. Rats were transduced with either recombinant adenovirus overexpressing the Myadm (miR-182-3p, 1010 pfu/mL) or the control virus (Control-Ad) and then were injected subcutaneously using one dose of MCT. A: The Myadm protein expression levels were detected using Western blotting. B: The in situ expression levels of the Myadm protein were detected using the co-immunofluorescent staining of Myadm (Green) and the SMA (red). Cell nuclei were stained with DAPI (blue). Images are shown at 40× magnification. The bar indicates 100 μm. PASP (C) and RVSP (D) were measured. Black line and black arrow were used to mark the pressure values. HR: heart rates; bpm: beat per minute. The intimal-medial thickness (E) and the ratio of the wall area to the total vessel area of pulmonary arteries with diameters of <50 μm and 50 to 100 μm (F) were measured after the sections were stained with H&E. Images are shown at 40× (E) and 20× (F) magnification, respectively. Bar indicates 50 μm and 100 μm. The results are expressed as the means±SEMs. *p<0.05, **p<0.01 vs rats injected with control virus. #p<0.05, ##<0.01 vs rats treated with control virus and MCT. n=6-8 per group.
Figure 5
Figure 5
Knockout of Myadm inhibits the vascular remodelling in MCT-induced rats. Myadm gene knock out rats (Myadm-/-) or the wild type rats (WT) were injected subcutaneously using one dose of MCT (normal saline was used as normal control). A: The Myadm protein expression levels were detected using Western blotting. B: The in situ expression levels of the Myadm protein were detected using the co-immunofluorescent staining of Myadm (Green) and the SMA (red). Cell nuclei were stained with DAPI (blue). Images are shown at 40× magnification. The bar indicates 100 μm. PASP (C) and RVSP (D) were measured. Black line and black arrow were used to mark the pressure values. HR: heart rates; bpm: beat per minute. The intimal-medial thickness (E) and the ratio of the wall area to the total vessel area of pulmonary arteries with diameters of <50 μm and 50 to 100 μm (F) were measured after the sections were stained with H&E. Images are shown at 40× (E) and 20× (F) magnification, respectively. Bar indicates 50 μm and 100 μm. Results are expressed as the means±SEMs. *p<0.05, **p<0.01 vs wild type rats. #p<0.05, ##<0.01 vs wild type rats that treated with MCT. n=6-8 per group.
Figure 6
Figure 6
Changes in Myadm-mediated p21/Cip1 expression contribute to MCT- induced PAH in rats. Myadm-mediated proteome expression profile changes in MCT-induced PAH. A. Heatmap displaying a subset of proteins differentially expressed upon MCT-treatment in wild-types and Myadm-/- rats (FC > 1.6, p <0.05), as measured by iTRAQ; B. Differentially expressed proteins in the lungs of Myadm-/- rats compared to the controls, as identified by iTRAQ. n=3. C-D. Rats infected with the recombinant adenovirus overexpressing the Myadm gene (Ad-Myadm) or Myadm-/- rats were injected subcutaneously using one dose of MCT, the protein expression levels of Myadm, CyclinD1, CDK2, PCNA, and p21/Cip1 normalized to β-actin in the lungs of the rats were detected using Western blotting. n=6-8. *p<0.05, **p<0.01 vs rats injected with control virus or wild-type siblings of Myadm knockout rats. #p<0.05, ##<0.01 vs rats treated with control virus/wild-type and MCT. n=6-8 per group. E-F: Quiescent rat PASMCs that overexpressed the Myadm gene (Ad-Myadm, E) or were isolated from Myadm-/- rats (F) were then treated with PDGF-BB (20 ng/mL) for the next 48 hours, and the p21/Cip1 expression level was measured using Western blotting. n=6 *p<0.05, **p<0.01 vs PASMCs infected with control virus or PASMCs isolated from wild-type siblings of Myadm knockout rats. #p<0.05, ##<0.01 vs PASMCs infected with control virus or PASMCs isolated from wild-type rats in response to 10% FBS or PDGF-BB at a concentration of 20 ng/mL. n=6-8 per group.
Figure 7
Figure 7
Myadm promotes PASMC proliferation by inhibiting p21/Cip1. A-B. Quiescent rat PASMCs that overexpressed the Myadm gene (Ad-Myadm) or isolated from Myadm-/- rats were treated with PDGF-BB (20 ng/mL) or 10% FBS for 48 h, p21/Cip1 expression level in the nuclei was determined by immunocytofluorescence analysis. The expression level was measured by the average intensity of green fluorescence. Anti-p21/Cip1 antibodies were used as primary antibodies, followed by FITC (green)-conjugated secondary antibody and visualized by Cellomics array scan. Nuclei were visualized by DAPI staining. Images are shown at 20× magnification. Data are expressed as the fold induction compared to control. *p<0.05, **p<0.01 vs PASMCs infected with control virus or PASMC isolated from wild-type siblings of Myadm knockout rats. #p<0.05, ##<0.01 vs PASMCs infected with control virus or PASMCs isolated from wild-type rats and in response to 10% FBS or PDGF-BB at a concentration of 20 ng/mL. n=6-8 per group. C-D. Both PASMCs isolated from Myadm-/- rats and PASMCs transfected with recombinant adenovirus that overexpressed small interference RNA (siRNA) against the Myadm gene were collected. Expression levels of KLF4 (both in the cytoplasm and nuclei) and p21/Cip1 were analyzed.
Figure 8
Figure 8
Myadm knockdown/knockout increases the binding of KLF4 to the intergenic region of the p21/Cip1 promoter and the protein expression level without changing p21/Cip1 promoter activity. PASMCs isolated from Myadm-/- rats or PASMCs transfected with siRNA against the Myadm gene were used for ChIP analysis together with ChIP-seq to map the genome-wide location of KLF4 binding region followed by Myadm knockdown or knockout, focusing on the p21/Cip2 promotor. A. Myadm knockdown/knockout increased KLF4 binding to the intergenic region of p21/Cip1 promoter. B, DNA-protein complexes were immunoprecipitated with anti-KLF4 Abs and were subjected to analysis using qRT-PCR followed by agarose gel electrophoresis showing PCR product. C, Growth-arrested PASMCs were co-transfected with KLF4-overexpressing plasmid (or control) and the firefly luciferase reporter gene containing p21 promoters and the transcription activities of p21 were measured according to the luciferase activity. D, KLF4 overexpression in PASMCs did not increase the mRNA expression level of p21/Cip1. E, PASMCs transfected with Ad-Myadm or Myamd-siRNA were subjected to cross co-immunoprecipitation (IP) and Western blotting (IB) to detect KLF4-SMAD4 complex formation. In the left panel, cell lysates were immunoprecipitated with anti-KLF4 resin and then immunoblotted with KLF4 and SMAD4 antibodies. In the right panel, cell lysates were immunoprecipitated with anti-SMAD4 resin and then immunoblotted with SMAD4 and KLF4 antibodies. For C-D, n=6-8 in each group.

References

    1. Hadri L, Kratlian RG, Benard L, Maron BA, Dorfmüller P, Ladage D. et al. Therapeutic efficacy of AAV1.SERCA2a in monocrotaline-induced pulmonary arterial hypertension. Circulation. 2013;128:512–23. - PMC - PubMed
    1. Condon DF, Nickel NP, Anderson R, Mirza S, de Jesus Perez VA. The 6th world symposium on pulmonary hypertension: what's old is new. F1000Res. 2019;8(F1000 Faculty Rev):888. - PMC - PubMed
    1. Xu H, Ling M, Xue J, Dai X, Sun Q, Chen C. et al. Exosomal microRNA-21 derived from bronchial epithelial cells is involved in aberrant epithelium-fibroblast cross-talk in COPD induced by cigarette smoking. Theranostics. 2018;8:5419–33. - PMC - PubMed
    1. Calvier L, Boucher P, Herz J, Hansmann G. LRP1 deficiency in vascular SMC leads to pulmonary arterial hypertension that is reversed by PPARγ activation. Circ Res. 2019;124:1778–85. - PMC - PubMed
    1. Caruso P, MacLean MR, Khanin R, McClure J, Soon E, Southgate M. et al. Dynamic changes in lung microRNA profiles during the development of pulmonary hypertension due to chronic hypoxia and monocrotaline. Arterioscler Thromb Vasc Biol. 2010;30:716–23. - PubMed

Publication types

MeSH terms