

CT quantification of pneumonia lesions in early days predicts progression to severe illness in a cohort of COVID-19 patients
- PMID: 32373235
- PMCID: PMC7196293
- DOI: 10.7150/thno.45985
CT quantification of pneumonia lesions in early days predicts progression to severe illness in a cohort of COVID-19 patients
Abstract
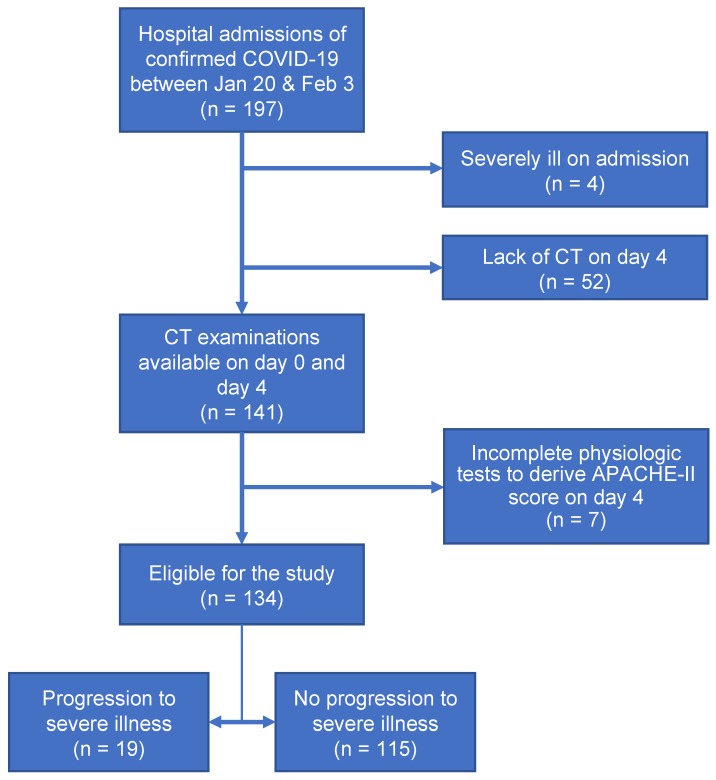
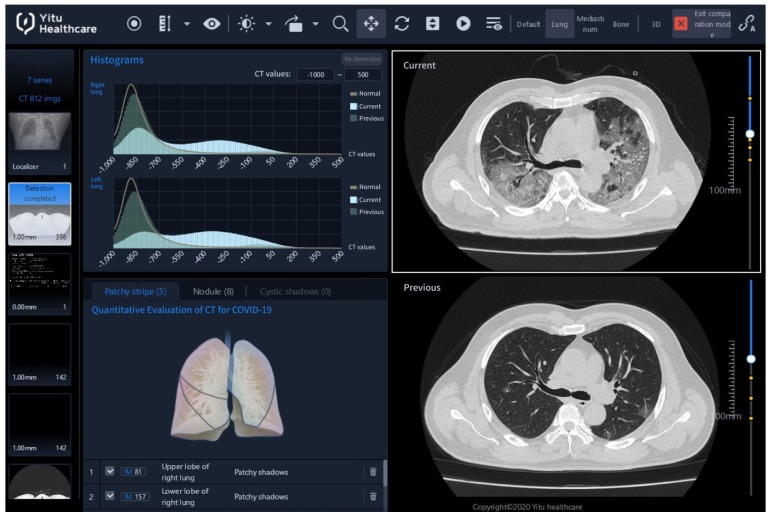
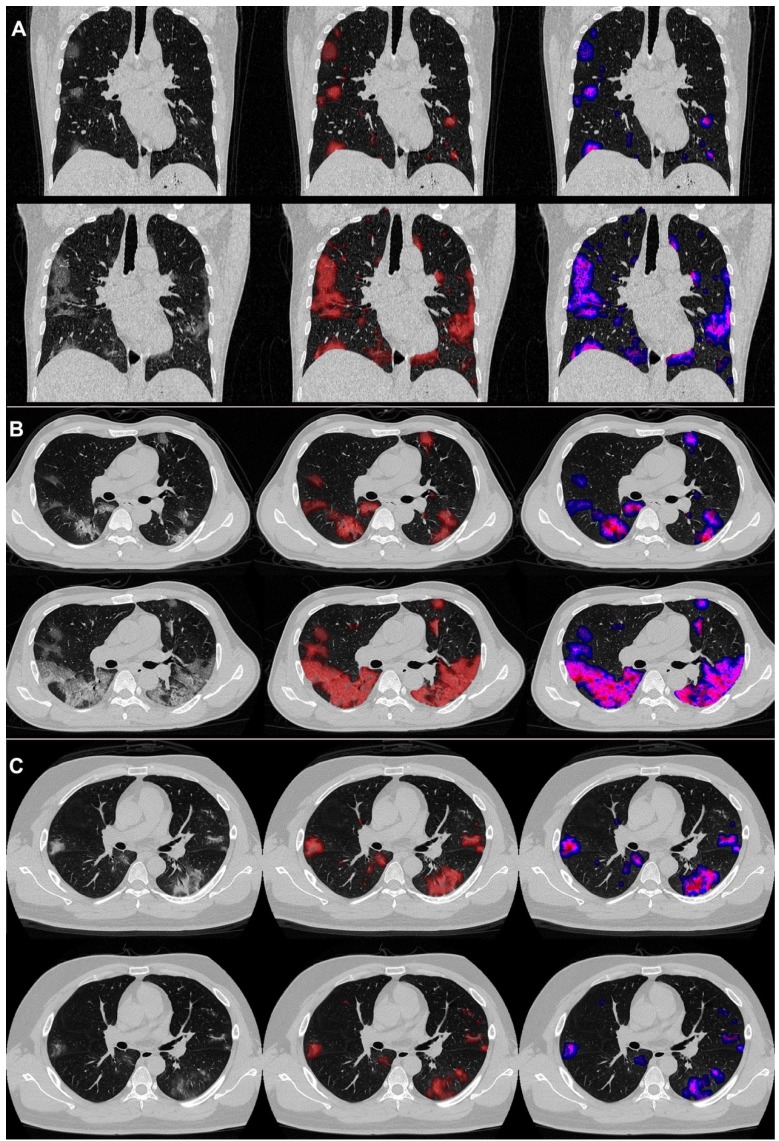
Rationale: Some patients with coronavirus disease 2019 (COVID-19) rapidly develop respiratory failure or even die, underscoring the need for early identification of patients at elevated risk of severe illness. This study aims to quantify pneumonia lesions by computed tomography (CT) in the early days to predict progression to severe illness in a cohort of COVID-19 patients. Methods: This retrospective cohort study included confirmed COVID-19 patients. Three quantitative CT features of pneumonia lesions were automatically calculated using artificial intelligence algorithms, representing the percentages of ground-glass opacity volume (PGV), semi-consolidation volume (PSV), and consolidation volume (PCV) in both lungs. CT features, acute physiology and chronic health evaluation II (APACHE-II) score, neutrophil-to-lymphocyte ratio (NLR), and d-dimer, on day 0 (hospital admission) and day 4, were collected to predict the occurrence of severe illness within a 28-day follow-up using both logistic regression and Cox proportional hazard models. Results: We included 134 patients, of whom 19 (14.2%) developed any severe illness. CT features on day 0 and day 4, as well as their changes from day 0 to day 4, showed predictive capability. Changes in CT features from day 0 to day 4 performed the best in the prediction (area under the receiver operating characteristic curve = 0.93, 95% confidence interval [CI] 0.87~0.99; C-index=0.88, 95% CI 0.81~0.95). The hazard ratios of PGV and PCV were 1.39 (95% CI 1.05~1.84, P=0.023) and 1.67 (95% CI 1.17~2.38, P=0.005), respectively. CT features, adjusted for age and gender, on day 4 and in terms of changes from day 0 to day 4 outperformed APACHE-II, NLR, and d-dimer. Conclusions: CT quantification of pneumonia lesions can early and non-invasively predict the progression to severe illness, providing a promising prognostic indicator for clinical management of COVID-19.
Keywords: Artificial intelligence; COVID-19; Chest CT; Retrospective cohort; Severe illness.
© The author(s).
Conflict of interest statement
Competing Interests: The authors have declared that no competing interest exists.
Figures
References
-
- Novel CPERE. The epidemiological characteristics of an outbreak of 2019 novel coronavirus diseases (COVID-19) in China. Zhonghua liu xing bing xue za zhi= Zhonghua liuxingbingxue zazhi. 2020;41:145. - PubMed
-
- WHO. Coronavirus disease 2019 (COVID-19): situation report-79. 2020.
-
- Lipsitch M, Swerdlow DL, Finelli L. Defining the Epidemiology of Covid-19 - Studies Needed. N Engl J Med. 2020. - PubMed
-
- Wu WH, Niu YY, Zhang CR, Xiao LB, Ye HS, Pan DM. et al. Combined APACH II score and arterial blood lactate clearance rate to predict the prognosis of ARDS patients. Asian Pac J Trop Med. 2012;5:656–60. - PubMed
MeSH terms
LinkOut - more resources
Full Text Sources
Other Literature Sources
Medical
