

Are people in the bush really physically active? A systematic review and meta-analysis of physical activity and sedentary behaviour in rural Australians populations
- PMID: 32373329
- PMCID: PMC7182355
- DOI: 10.7189/jogh.10.010410
Are people in the bush really physically active? A systematic review and meta-analysis of physical activity and sedentary behaviour in rural Australians populations
Abstract
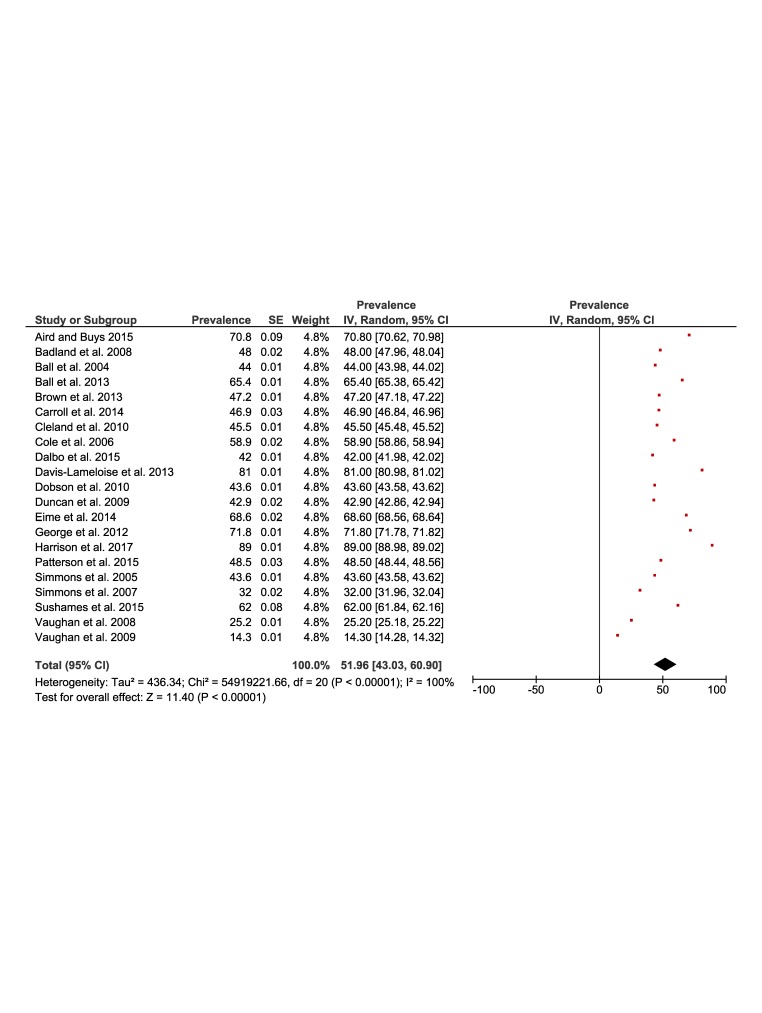
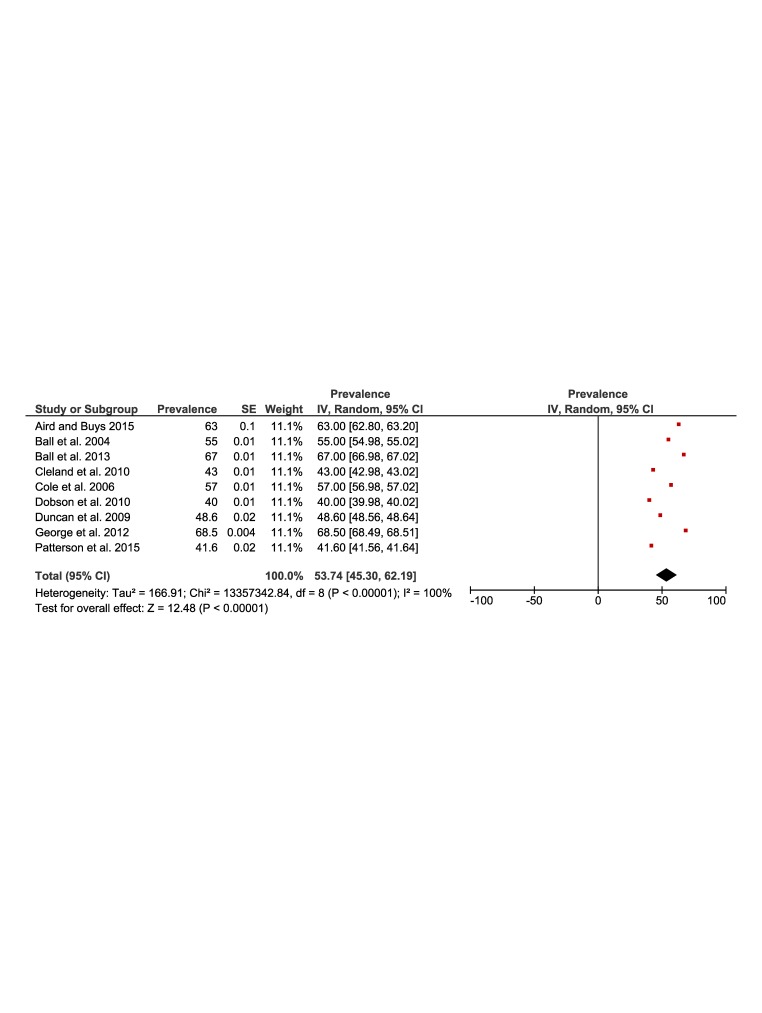
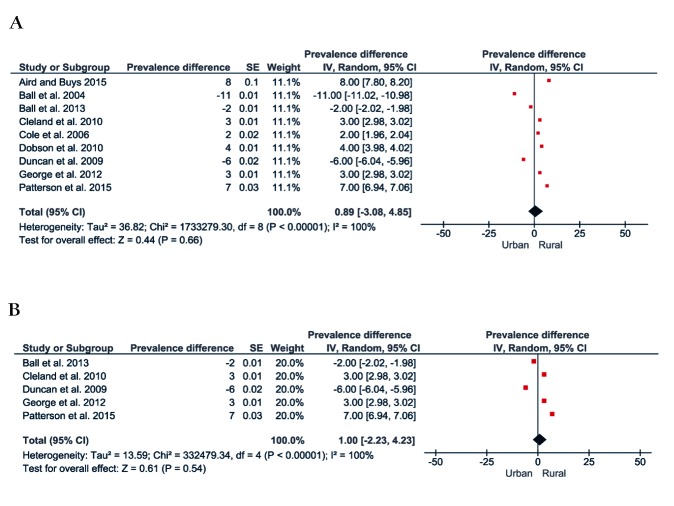
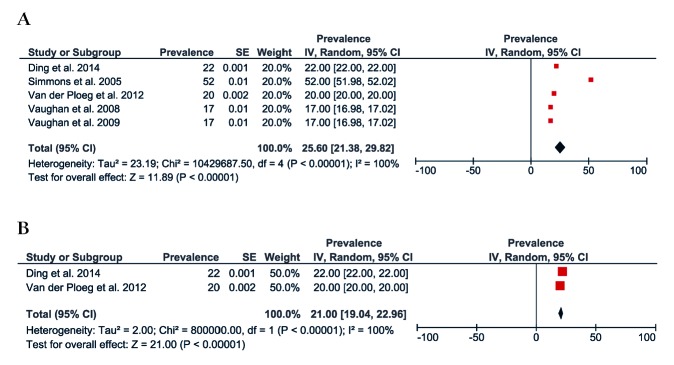
Background: Physical inactivity is a major risk factor for non-communicable disease and premature mortality. People who live in rural settings are usually regarded as more physically active than those living in urban areas, however, direct comparisons between these populations are scarce. We aimed to summarise the prevalence of physical inactivity and sedentary behaviour in rural settings in Australia, compared to urban counterparts.
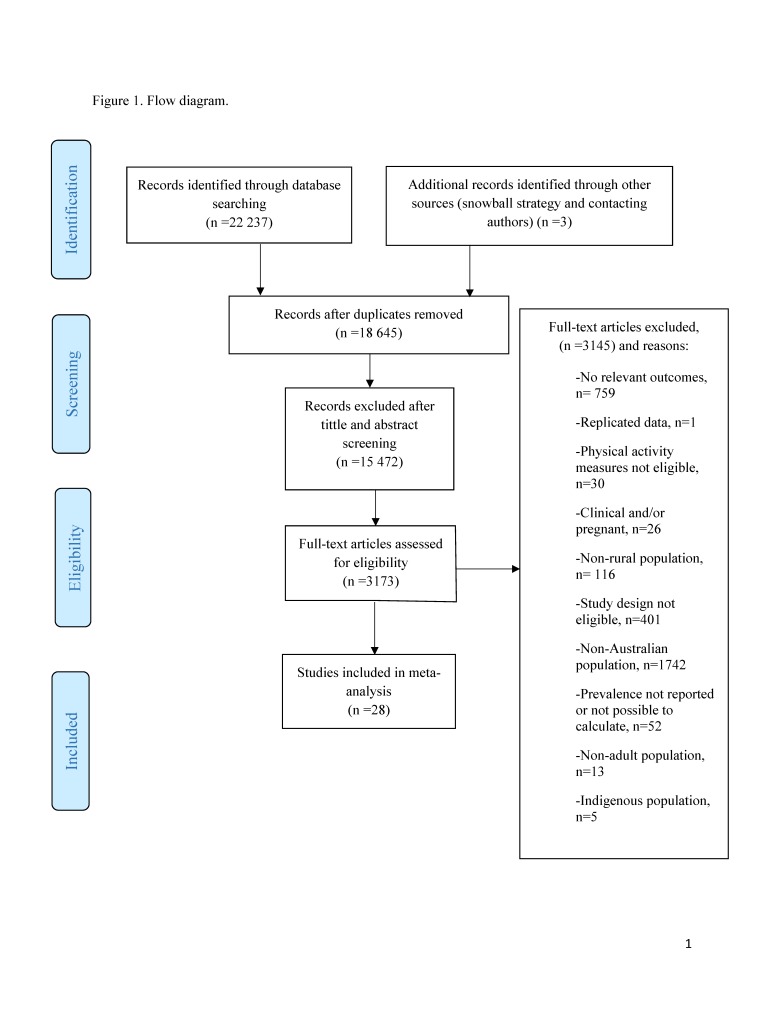
Methods: We searched six databases (AMED, Embase, Medline; CINAHL, SPORTDiscus; and RURAL) and identified 28 observational studies that investigated the levels of physical inactivity and/or sedentary behaviour in adults aged 18 years and over in rural Australia. Random effects meta-analysis was used to generate pooled prevalence estimates.
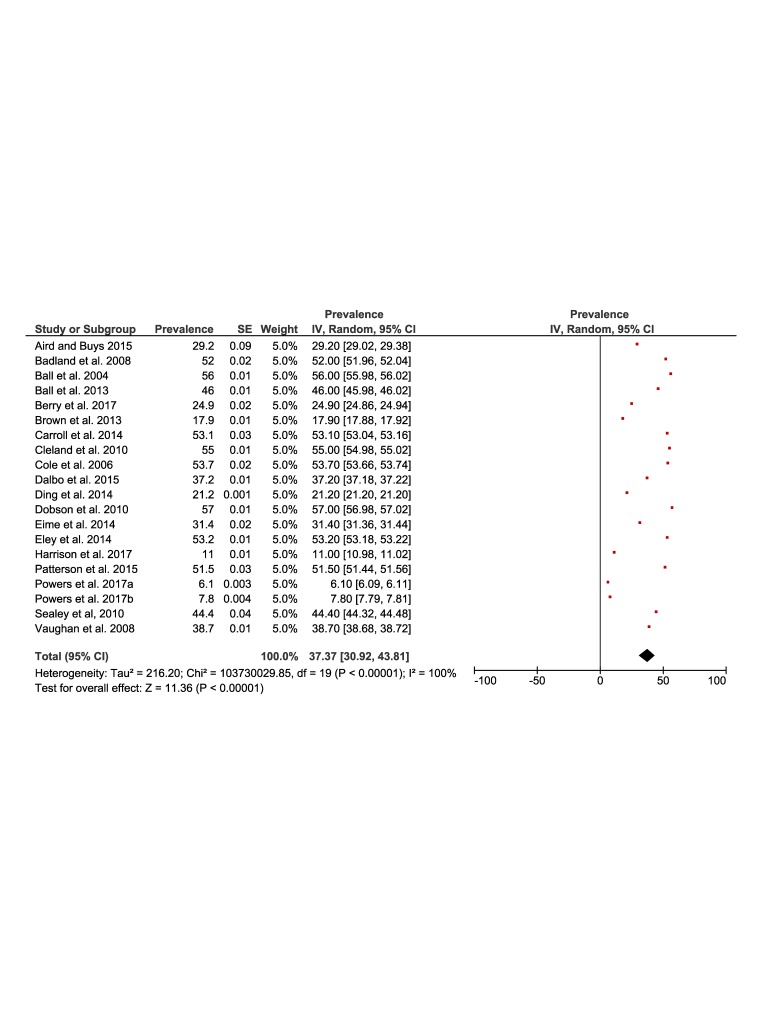
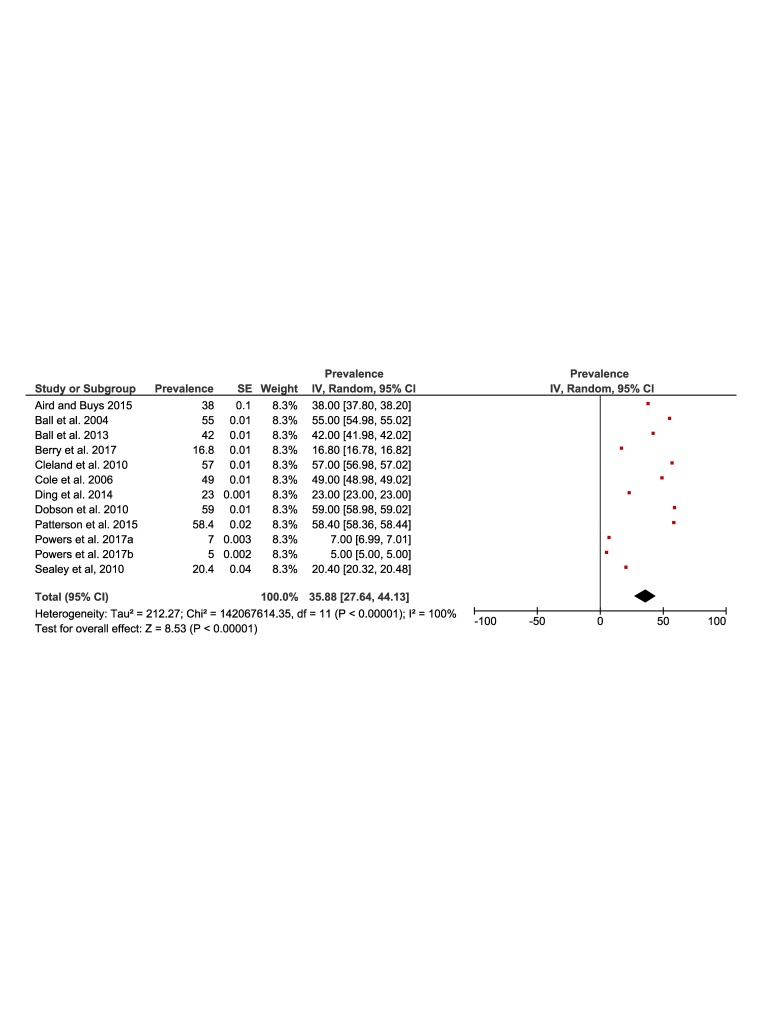
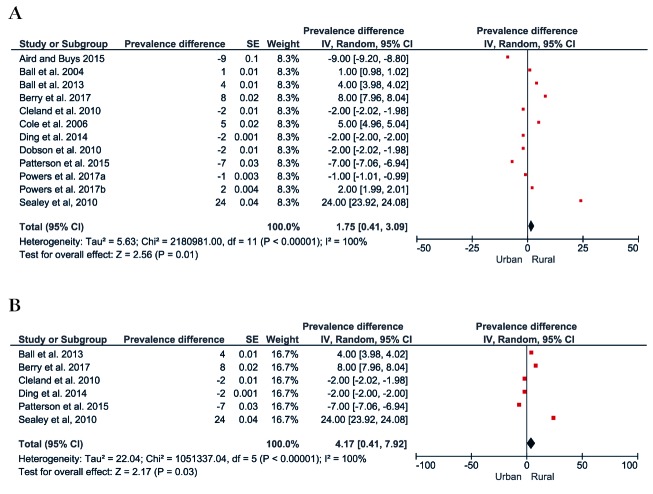
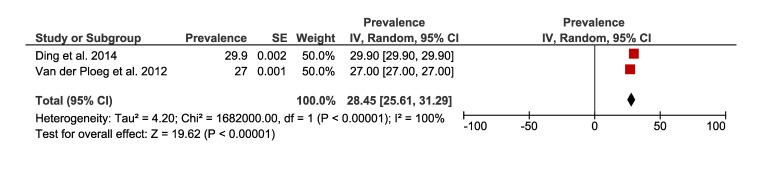
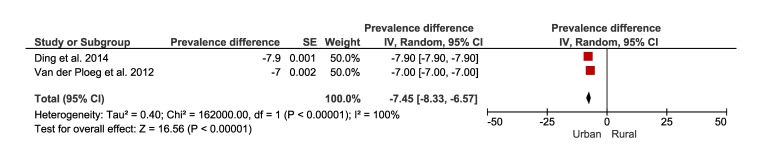
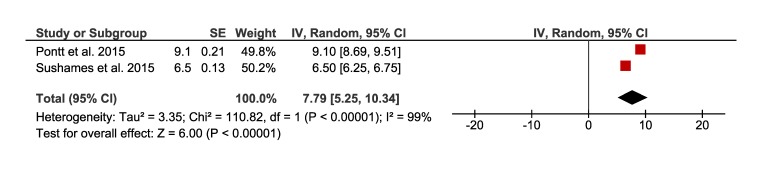
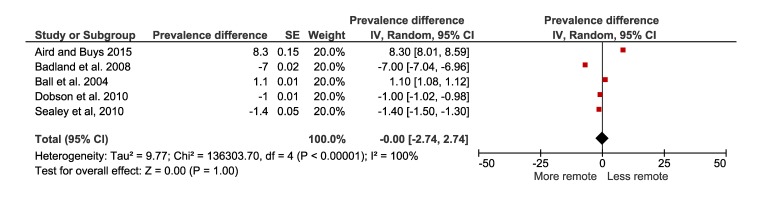
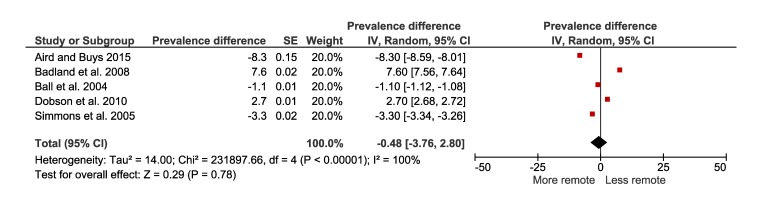
Results: Physical inactivity was four percentage points (95% confidence interval (CI) = 0.4 to 8) higher in rural populations compared to urban populations. There was a one percentage point (95% CI = -3 to 5) prevalence difference of physical activity in the rural populations. Rural populations reported on average 7.8 hours of sedentary time per day (95% CI = 5 to 10) and the prevalence of high levels of sedentary behaviour (≥to 8 hours per day) was 7% (95% CI = -8 to -7) greater in urban areas compared to rural areas.
Conclusions: People living in rural areas are just as physically inactive as people who live in urban areas. Our findings challenge the popular views that rural lifestyles result in people engaging more frequently in physical activity. Public health campaigns promoting physical activity in rural settings are just as necessary as in urban settings.
Copyright © 2020 by the Journal of Global Health. All rights reserved.
Conflict of interest statement
Conflict of interest: The authors completed the ICMJE Unified Competing Interest form (available upon request from the corresponding author), and declare no conflicts of interest.
Figures
References
-
- World Health Organization. Global recommendations on physical activity for health. Geneva: World Health Organization; 2010. - PubMed
-
- Committe. PAGA. 2018 Physical Activity Guidelines Advisory Committee Scientific Report. Washington, DC: U.S. Department of Health and Human Services, 2018. 2018.
-
- United Nations DoEaSA, Population Division. World Urbanization Prospects: The 2014 Revision2015.
-
- AIoHaW. Australia’s health 2018. Australia’s health series no 16 2018:AUS 221.
