. 2020 May 3;9(5):e01135.
doi: 10.1002/cti2.1135. eCollection 2020 May.

EGFR-targeted CAR-T cells are potent and specific in suppressing triple-negative breast cancer both in vitro and in vivo

Affiliations

EGFR-targeted CAR-T cells are potent and specific in suppressing triple-negative breast cancer both in vitro and in vivo

Lin Xia et al. Clin Transl Immunology. .

Abstract

Objectives: Triple-negative breast cancer (TNBC) is well known for its strong invasiveness, rapid recurrence and poor prognosis. Immunotherapy, including chimeric antigen receptor-modified T (CAR-T) cells, has emerged as a promising tool to treat TNBC. The identification of a specific target tumor antigen and the design of an effective CAR are among the many challenges of CAR-T therapy.

Methods: We reported that epidermal growth factor receptor (EGFR) is highly expressed in TNBC and consequently designed an optimal third generation of CAR targeting EGFR. The efficacy of primary T lymphocytes infected with EGFR CAR lentivirus (EGFR CAR-T) against TNBC was evaluated both in vitro and in vivo. The signalling pathways activated in tumor and EGFR CAR-T cells were revealed by RNA sequencing analysis.

Results: Third-generation EGFR CAR-T cells exerted potent and specific suppression of TNBC cell growth in vitro, whereas limited cytotoxicity was observed towards normal breast epithelial cells or oestrogen receptor-positive breast cancer cells. This capability was further demonstrated in vivo in a xenograft mouse model, with minimal off-tumor cytotoxicity. Mechanistically, in vitro stimulation with TNBC cells induced the expansion of naïve-associated EGFR CAR-T cells and enhanced their persistence. Furthermore, EGFR CAR-T cells activated the interferon γ, granzyme-perforin-PARP and Fas-FADD-caspase signalling pathways in TNBC cells.

Conclusion: We demonstrate that EGFR is a relevant immunotherapeutic target in TNBC, and EGFR CAR-T exhibits potent and specific antitumor activity against TNBC, suggesting the potential of this third-generation EGFR CAR-T as an immunotherapy tool to treat TNBC in the clinic.

Keywords: chimeric antigen receptor‐modified T‐cell; epidermal growth factor receptor; immunotherapy; triple‐negative breast cancer.


Conflict of interest statement

The authors declare no conflict of interest.

Figures

Figure 1
Figure 1
EGFR is overexpressed in TNBC. (a) Cell lysates from different breast cancer cells as well as normal breast epithelial cells as indicated were subjected to IB analysis with an anti‐EGFR‐specific antibody. Actin served as a loading control. Molecular weight is indicated on the right. Experiments were repeated three times, and representative blots are shown. (b) MDA‐MB‐231, MDA‐MB‐468, MCF7 and T47D cells were subjected to flow cytometry analysis by using a PE‐conjugated anti‐EGFR antibody to examine the expression of this receptor. Light grey, blank; dark grey, EGFR. Experiments were repeated three times, and representative histograms are shown. (c) The expression of EGFR (FPKM, log2) in a cohort of clinical breast cancer samples from The Cancer Genome Atlas database is shown in the box plot. LumA, n = 480; LumB, n = 197; TNBC, n = 157; HER2, n = 73; N/A, n = 287; Normal‐like, n = 27. P‐values are shown at the top of the Figure 1c. EGFR, epidermal growth factor receptor; ER+, oestrogen receptor‐positive; FPKM, fragments per kilobase per million; HER2+, human epidermal growth factor receptor 2‐positive; IB, immunoblotting; LumA, luminal A; LumB, luminal B; N/A, not available; PR+, progesterone receptor‐positive; TNBC, triple‐negative breast cancer.
Figure 2
Figure 2
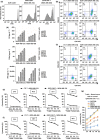
The design and expression of EGFR‐targeted CAR (EGFR CAR). (a) Schematic illustration of the two third‐generation EGFR CAR constructs. The CAR is constituted by a signal peptide of the interleukin (IL)‐2 receptor (Sp1), an anti‐EGFR scFv from cetuximab, a spacer (IgG1 Fc or IgG1 hinge), a CD28 transmembrane domain (CD28 TM) and intracellular signalling domains (CD28, 4‐1BB and CD3ζ). The spacers IgG1 Fc and IgG1 hinge were used in Fc‐EGFR CAR and Hinge‐EGFR CAR constructs, respectively. (b, c) HEK293T cells transfected with a CTL vector or the two EGFR CAR expression vectors as described in a were stained with an APC‐conjugated anti‐human IgG‐Fc antibody or a FITC‐conjugated anti‐human IgG (Fab′)2 antibody followed by flow cytometry analysis (b) or lysed for IB (c) to examine the expression of CD3ζ. GAPDH served as a loading control. Molecular weight is indicated on the left. Light grey, blank; dark grey, CTL vector or EGFR CAR. Experiments were repeated three times, and representative histograms or blots are shown. (d) Primary T lymphocytes from a healthy donor were expanded and stained with an anti‐CD3 antibody conjugated with FITC (CD3‐FITC) (left panel) or an anti‐CD8 antibody conjugated with APC (CD8‐APC) (right panel) followed by flow cytometry analysis. Light grey, blank; dark grey, CD3 or CD8 staining. Experiments were repeated three times, and representative histograms are shown. (e) Primary T lymphocytes were infected with a CTL vector or the two EGFR CAR lentiviruses as described in a and stained with an APC‐conjugated anti‐human IgG‐Fc antibody or a FITC‐conjugated anti‐human IgG (Fab′)2 antibody followed by flow cytometry analysis. Light grey, blank; dark grey, CTL vector or EGFR CAR. Experiments were repeated three times, and representative histograms are shown. (f) Primary T lymphocytes infected with the two EGFR CAR lentiviruses as described in a were maintained in culture medium for the indicated durations, and the number of viable cells was counted at the indicated time points. Initial number, 2.5 × 105. Data were obtained from three replicates and are presented as mean ± s.e.m.. CAR, chimeric antigen receptor; CTL, control; EGFR scFv, single‐chain variable fragment against EGFR; EGFR, epidermal growth factor receptor; Fc, fragment crystallisable; GAPDH, glyceraldehyde‐3‐phosphate dehydrogenase; IB, immunoblotting; IgG1, immunoglobulin G1; LTR, long terminal repeat; Sp1, signal peptide of the IL‐2 receptor; TM, transmembrane domain.
Figure 3
Figure 3
Proliferation, activation and cytotoxicity of EGFR CAR‐T cells. (a) Primary T lymphocytes infected with EGFR CAR lentivirus (EGFR CAR‐T) labelled with CFSE were incubated with or without MDA‐MB‐231 or MDA‐MB‐468 cells in culture medium without adding proliferative cytokines for 3 days and diluted to examine their proliferation. Experiments were repeated three times, and representative histograms are shown. (b, c) CTL T or EGFR CAR‐T cells were incubated with MDA‐MB‐231 or MDA‐MB‐468 cells and stained with CD8‐APC and CD69‐PE (b) or CD25‐FITC (c) followed by flow cytometry analysis. Experiments were repeated three times, and representative histograms are shown. (d) EGFR CAR‐T cells were incubated with MDA‐MB‐231 or MDA‐MB‐468 cells at the indicated ratios for 3 days before measuring the secretion of cytokines, including IL‐2, TNFα and IFNγ. CTL T cells were used as a negative control. Data were obtained from three replicates and are presented as mean ± s.e.m.. (e, f) CTL T or EGFR CAR‐T cells were incubated with MDA‐MB‐231 (e) or MDA‐MB‐468 (f) cells at different ratios for the indicated durations followed by the cytotoxicity assay. Data were obtained from three replicates and are presented as mean ± s.e.m.. (g) EGFR CAR‐T cells were incubated with MCF10A, MCF7, BT474, MDA‐MB‐468 or MDA‐MB‐231 cells at a ratio of 1:1 for the indicated durations followed by the cytotoxicity assay. Data were obtained from three replicates and are presented as mean ± s.e.m.. CAR‐T, chimeric antigen receptor‐modified T cells; CFSE, carboxyfluorescein succinimidyl amino ester; CTL T, control T cells; EGFR, epidermal growth factor receptor; IFNγ, interferon γ; IL‐2, interleukin 2; TNFα, tumor necrosis factor α.
Figure 4
Figure 4
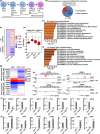
TNBC‐stimulated EGFR CAR‐T cells exhibit an induced naïve‐associated gene signature. (a) Schematic representation of CD8+ T‐cell differentiation. (b) EGFR CAR‐T cells were incubated with or without MDA‐MB‐231 cells (at a ratio of 1:2) for 3 days, and CAR‐T cells in suspension were separated from adherent tumor cells and collected, followed by RNA extraction and RNA sequencing (RNA‐seq) analysis. Up‐ and down‐regulated genes of CAR‐T cells upon incubation with MDA‐MB‐231 cells (FPKM > 0.5, FC > 4) are shown in the pie chart. RNA from three biological replicates was pooled for RNA‐seq. (c, d) Heat map (c) and box plot (d) representation of the expression levels (FPKM, log2) of the up‐ and down‐regulated genes described in b. P‐values are shown at the top (d). (e, f) GO analysis of the up‐ (e) and down‐regulated (f) genes described in b. (g) The expression (FPKM, log2) of representative genes associated with effector and naïve T‐cell function in EGFR CAR‐T cells in response to MDA‐MB‐231 cell co‐incubation as detected by RNA‐seq is shown in the heat map. (h, i) UCSC Genome Browser views of representative genes associated with effector (h) and naïve (i) T‐cell function from RNA‐seq analysis. (j, k) Cells described in b were subjected to RNA extraction and quantitative reverse transcription polymerase chain reaction (RT‐qPCR) analysis to examine the expression of representative genes associated with effector (j) and naïve (k) T‐cell function in EGFR CAR‐T cells. Data were obtained from three replicates and are presented as mean ± s.e.m. (**P < 0.01, ***P < 0.001). 231, MDA‐MB‐231; APC, antigen‐presenting cells; CAR‐T, chimeric antigen receptor‐modified T cells; chr, chromosome; EGFR, epidermal growth factor receptor; FC, fold change; FPKM, fragments per kilobase per million; GO, gene ontology; TCM, central memory T cells; TEFF, effector T cells; TEM, effector memory T cells; TN, naïve T cells; TSCM, T stem central memory cells.
Figure 5
Figure 5
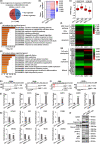
EGFR CAR‐T cells activate multiple signalling pathways in TNBC cells. (a) MDA‐MB‐231 cells were mixed with CTL T or EGFR CAR‐T cells at a ratio of 2:1 for 3 days. T cells in suspension were then removed, and the adherent tumor cells were collected, followed by RNA‐seq analysis. Up‐ and down‐regulated genes of CAR‐T cells upon incubation in MDA‐MB‐231 cells (FPKM > 0.5, FC > 1.5) are shown in the pie chart. RNA from three biological replicates was pooled for RNA‐seq. (b, c) Heat map (b) and box plot (c) representation of the expression levels (FPKM, log2) of the up‐ and down‐regulated genes described in a. P‐values are shown at the top (c). (d, e) GO analysis of up‐ (d) and down‐regulated (e) genes described in a. (f, g) The expression (FPKM, log2) of representative up‐ (f) and down‐regulated (g) genes of MDA‐MB‐231 cells in response to EGFR CAR‐T cell co‐incubation as detected by RNA‐seq is shown in the heat map. (h, i) UCSC Genome Browser views of representative up‐ (h) and down‐regulated (i) genes detected by RNA‐seq. (j, k) Cells described in a were subjected to RNA extraction and RT‐qPCR analysis to examine the expression of representative up‐ (j) and down‐regulated (k) genes of MDA‐MB‐231 cells. Data were obtained from three replicates and are presented as mean ± s.e.m. (**P < 0.01, ***P < 0.001). (l) MDA‐MB‐231 cells treated with CTL T or EGFR CAR‐T cells were subjected to IB analysis with the indicated antibodies. Molecular weight is indicated on the right. Experiments were repeated three times, and representative blots are shown. 231, MDA‐MB‐231; CAR‐T, chimeric antigen receptor‐modified T cells; chr, chromosome; CTL T, control T cells; E2F1, E2F transcription factor 1; EGFR, epidermal growth factor receptor; Fas, factor‐associated suicide; FC, fold change; FPKM, fragments per kilobase per million; GO, gene ontology; GZMB, granzyme B; IB, immunoblotting; IFNγ, interferon γ; IRF1, interferon regulatory factor 1; MHC, major histocompatibility complex; PARP, poly (ADP‐ribose) polymerase; pJAK1, Janus kinase‐1 phosphorylation; pRb, retinoblastoma protein phosphorylation; pSTAT1, signal transducer and activator of transcription 1 phosphorylation.
Figure 6
Figure 6
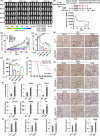
EGFR CAR‐T cells exhibit potent and specific antitumor activities in TNBC xenograft mouse model. (a) SCID mice were injected subcutaneously with MDA‐MB‐231 cells (1.0 × 106) stably expressing a luciferase reporter (MDA‐MB‐231‐fluc). Five days after tumor inoculation, mice were treated intravenously with CTL T or three different dosages of EGFR CAR‐T cells (CAR‐T (a), 2.5 × 106 cells per injection; CAR‐T (b), 5.0 × 106 cells per injection; CAR‐T (c), 1.0 × 107 cells per injection) every other day (n = 6). The day mice received CAR‐T treatment was considered as day 1. Tumor growth was monitored by using bioluminescence imaging for 20 days. Representative data of two independent experiments are shown. (b) Tumor growth curve based on bioluminescence as described in a. Data are presented as mean ± s.e.m.. Statistical significance across multiple comparisons was determined using two‐way ANOVA (***P < 0.001). (c, d) Average bioluminescence (c) and average tumor volume (d) after 20 days of observation as described in a. . Data are presented as mean ± s.e.m. (*P < 0.05, **P < 0.01, ***P < 0.001). (e) gDNA extracted from peripheral blood mononuclear cells (PBMCs) of recipient mice (n = 6) at different time points after injection of EGFR CAR‐T cells was subjected to RT‐qPCR analysis to measure CAR gene copy. The timeline of EGFR CAR‐T injection and blood collection is depicted at the top. Data are presented as mean ± s.e.m.. (f) Survival analysis of mice upon CTL T or EGFR CAR‐T treatment (5 × 106 cells per injection, n = 6). The experiment was terminated at day 140. Representative data of two independent experiments are shown. P‐value was determined using the log‐rank (Mantel–Cox) test. (g–i) Primary tumor, liver and lung sections from CTL T‐ or EGFR CAR‐T‐treated mice (5 × 106 cells per injection) described in a were subjected to IHC staining by anti‐Ki67 (g)‐, EGFR (h)‐ and CD8 (i)‐specific antibodies. Diaminobenzidine (DAB) staining was used for further chromogenic detection (brown). Blue arrows indicate CD8+ staining in i. Representative images are shown. Representative regions are enlarged from 200× (small‐sized black square) to 400× magnification (big‐sized black square) for clarity. Scale bars, 50 µm (black line) and 25 µm (red line). Representative data of three independent experiments are shown. (j, k) Primary tumor tissues from CTL T‐ or EGFR CAR‐T‐treated mice (5 × 106 cells per injection) described in a  were subjected to RNA extraction and RT‐qPCR analysis to examine the expression of the indicated IFNγ target genes (j) and T‐cell genes (k). Data were obtained from three replicates and are presented as mean ± s.e.m. (*P < 0.05, **P < 0.01, ***P < 0.001). CAR‐T, chimeric antigen receptor‐modified T cells; CTL T, control T cells; EGFR, epidermal growth factor receptor; gDNA, genomic DNA; IV, intravenous injection; ns, non‐significant; SC, subcutaneous injection; SCID, severe combined immunodeficient.

Similar articles

Cited by

References

    1. Bray F, Ferlay J, Soerjomataram I, Siegel RL, Torre LA, Jemal A. Global cancer statistics 2018: GLOBOCAN estimates of incidence and mortality worldwide for 36 cancers in 185 countries. CA Cancer J Clin 2018; 68: 394–424. - PubMed
    1. Perou CM, Sorlie T, Eisen MB et al Molecular portraits of human breast tumours. Nature 2000; 406: 747–752. - PubMed
    1. Sorlie T, Perou CM, Tibshirani R et al Gene expression patterns of breast carcinomas distinguish tumor subclasses with clinical implications. Proc Natl Acad Sci USA 2001; 98: 10869–10874. - PMC - PubMed
    1. Foulkes WD, Smith Ian E, Reisfilho Jorge S. Triple‐negative breast cancer. N Engl J Med 2010; 363: 1938–1948. - PubMed
    1. Bianchini G, Balko JM, Mayer IA, Sanders ME, Gianni L. Triple‐negative breast cancer: challenges and opportunities of a heterogeneous disease. Nat Rev Clin Oncol 2016; 13: 674–690. - PMC - PubMed