. 2020 Apr 16:10:149.
doi: 10.3389/fcimb.2020.00149. eCollection 2020.

GCN2-Like Kinase Modulates Stress Granule Formation During Nutritional Stress in Trypanosoma cruzi

Affiliations

GCN2-Like Kinase Modulates Stress Granule Formation During Nutritional Stress in Trypanosoma cruzi

Amaranta Muniz Malvezzi et al. Front Cell Infect Microbiol. .

Abstract

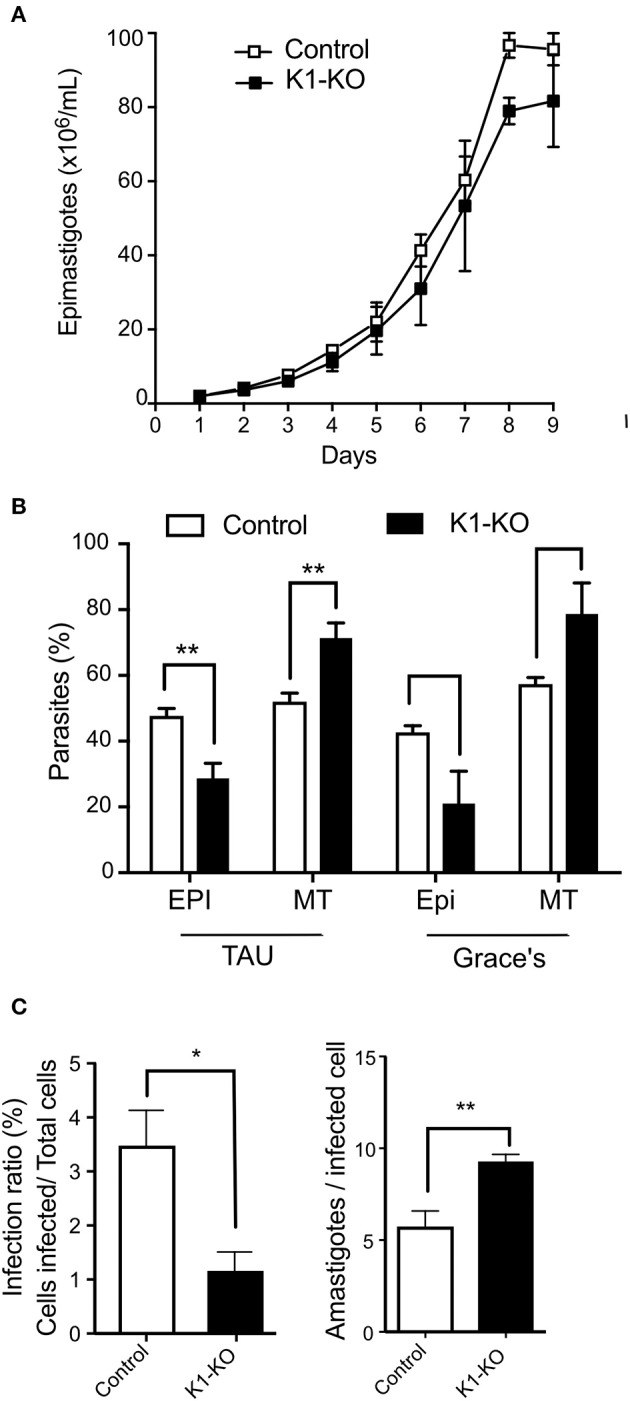
The integrated stress response in eukaryotic cells is an orchestrated pathway that leads to eukaryotic Initiation Factor 2 alpha subunit (eIF2α) phosphorylation at ser51 and ultimately activates pathways to mitigate cellular damages. Three putative kinases (Tck1, Tck2, and Tck3) are found in the Trypanosoma cruzi genome, the flagellated parasite that causes Chagas disease. These kinases present similarities to other eukaryotic eIF2α kinases, exhibiting a typical insertion loop in the kinase domain of the protein. We found that this insertion loop is conserved among kinase 1 of several T. cruzi strains but differs among various Kinetoplastidae species, suggesting unique roles. Kinase 1 is orthologous of GCN2 of several eukaryotes, which have been implicated in the eIF2α ser51 phosphorylation in situations that mainly affects the nutrients levels. Therefore, we further investigated the responses to nutritional stress of T. cruzi devoid of TcK1 generated by CRISPR/Cas9 gene replacement. In nutrient-rich conditions, replicative T. cruzi epimastigotes depleted of TcK1 proliferate as wild type cells but showed increased levels of polysomes relative to monosomes. Upon nutritional deprivation, the polysomes decreased more than in TcK1 depleted line. However, eIF2α is still phosphorylated in TcK1 depleted line, as in wild type parasites. eIF2α phosphorylation increased at longer incubations times, but KO parasites showed less accumulation of ribonucleoprotein granules containing ATP-dependent RNA helicase involved in mRNA turnover (DHH1) and Poly-A binding protein (PABP1). Additionally, the formation of metacyclic-trypomastigotes is increased in the absence of Tck1 compared to controls. These metacyclics, as well as tissue culture trypomastigotes derived from the TcK1 knockout line, were less infective to mammalian host cells, although replicated faster inside mammalian cells. These results indicate that GCN2-like kinase in T. cruzi affects stress granule formation, independently of eIF2α phosphorylation upon nutrient deprivation. It also modulates the fate of the parasites during differentiation, invasion, and intracellular proliferation.

Keywords: CRISPR/Cas9; GCN2; TcK1; Trypanosoma cruzi; eIF2α; phosphorylation; stress-granules.


Figures

Figure 1
Figure 1
(A) Schematic representation of Tck1 gene sequence with predicted domains in comparison with the Saccharomyces cerevisiae (ScGCN2) and Leishmania donovani (LdeK1). Pfam analysis predicted the RWD and kinase domain in Tck1 gene in the N-terminal portion and HHpred analysis identified the HisRS-like domain despite its low sequence conservation. The black boxes indicate the typical insertion in the kinase domain of eIF2α kinases. The panel also indicates CTD domain, and the pseudo-kinase (ΨKD). The numbers indicate the position of each domain. (B) Sequence alignment of the kinase domain of TcK1 in comparison with GCN2 of model organisms that have been already characterized. Identical residues are indicated in black shades and similar residues are in light gray. The bars on the top with roman numerals correspond to the eleven subdomains characteristic of the GCN2 kinases. Asterisks indicates the residues that undergo auto phosphorylation in eIF2α kinases in the VIII subdomain. Green squares indicate residues conserved in Ser/Thr protein kinases and arrows the residues maintained in eIF2α protein kinases. The positions of the P-loop, hinge, catalytic loop and activation loop are indicated by thin bars. The sequence for the TcK1 from the Y strain was obtained from Tritryp.org from the nucleotide sequence NMZO01000706.1:2,035.5,676. The other sequences were downloaded from GenBank with the following accession numbers: Toxoplasma gondii: AED01979.1; T. brucei: XP_828792.1; Saccharomyces cerevisiae: DAA12123.1; Plasmodium falciparum: XP_001348597.1; Leishmania donovani: AKG62099.1; Homo sapiens: Q9P2K8.3; Drosophila melanogaster: AGB96521.1 (C) Phylogenetic tree of the amino acid sequences corresponding to the kinase domain of the homologous of GCN2 of the indicated Kinetoplastidae species. The tree was generated with PHYML using the LG substitution model and 100 bootstraps (Guindon et al., 2010). The access numbers for these sequences are shown in Table S2.
Figure 2
Figure 2
(A) Illustrative diagram of the approach used to generate TcK1 knockout. A PAM site (inverted triangle) was chosen in the begin of the Tck1 ORF (blue) (Top). The donor DNA sequence was prepared comprising the BSD resistance gene and homologous sequences to the Tck1 5′UTR (yellow) and to the ORF immediately after the PAM site (light blue) to favor the repair by homologous recombination (Middle). The bottom diagram denotes the correct integration of the donor DNA to generate the TcK1 interrupted ORF. P1 and P2 represent the pair of primers used to amplify the TcK1 gene corresponding to the N-terminal sequence of the protein and P3 and P4 primers used to amplify the BSD sequence. P5 indicates the position of the primer that aligns with the removed region of TcK1 gene. (B) T. cruzi genomic DNA was isolated and genotyped by PCR using a combination of primers to amplify the endogenous genes of TcK1 (P1 and P2), the BSD integration (P3 and P4) and to detect the original ORF of TcK1 (P5 and P2). The numbers on the left of each gel stained with ethidium bromide represent the migration of DNA size markers.
Figure 3
Figure 3
Polysome profile analysis of control and TcK1 depleted parasites (TcK1-KO). Epimastigotes were cultivated in LIT medium and incubated in LIT or in TAU medium for 1 h. The parasites extracts were prepared as described in Methods and fractionated by ultracentrifugation through a 15–55% sucrose gradient. The fractions were collected from the top to bottom and the amount of RNA estimated by the absorbance at 254 nm. In each panel it is indicated the migrating position of the 40S, 60S, 80S and the polysomal fractions. The amount of polysomes relative to the 80S (P/M) was estimated by measuring the area under each peak in triplicate samples.
Figure 4
Figure 4
Western blot analysis reveals that TcK1-KO parasites are still able to phosphorylate eIF2α. (A) Extracts of control epimastigotes and eIF2 mutants (T169A), were obtained from cultures at 1 × 10⁷ in LIT medium, lysed as described in Methods and the equivalent of 3 × 10⁶ parasites loaded per lane. The Western blot was revealed after incubation with the affinity-purified rabbit α-phospho-eIF2α and revealed with α-rabbit IgG-IRDye-680. After imaging, the membranes were probed with mouse α-total T. cruzi eIF2α. (B) Exponentially growing epimastigotes were incubated at LIT or TAU medium for the indicated periods of time, and processed as in (A). The figure shows one of three experiment. (C) Relative ratios of phosphorylated eIF2α and total eIF2α labeling (means ± S.D, n = 3). Asterix indicate significant differences (p < 0.05) using two-way Anova.
Figure 5
Figure 5
TcK1 depleted parasites show less DHH1-ribonucleoprotein granules upon nutritional stress than control parasites. (A) Representative images of DHH1 immunofluorescence (red) and Hoechst dye staining (blue) of control and TcK1-KO parasites maintained in LIT medium or after incubation in TAU medium for 6 h. The zoomed images correspond to the region indicated by white doted lines. Bars = 2 μm. (B) Enlarged z-sections of the same parasites incubated for 1, 2, and 6 h in TAU medium. Bars = 2 μm. (C) Quantification of the average number of large granules per cell in epimastigotes incubated in TAU medium for 6 h. The numbers were the mean ± SD (n = 100). The Asterisks indicate a significant difference (p < 0.05), using two-way Anova test.
Figure 6
Figure 6
TcK1 depleted parasites show reduced enrichment of PABP1 in the insoluble fraction upon nutritional stress than control parasites. (A) Western blot of the soluble and insoluble fractions of extracts corresponding to 1 × 10⁷ epimastigotes prepared as described in methods from parasites incubated for 6 h in LIT or TAU medium. The gels were probed with rabbit α-PABP1 and α-aldolase, and mouse anti-α-tubulin. (B) Relative enrichment of PABP1 compared to aldolase or α-tubulin to the soluble and insoluble fractions of control (blue) and TcK1-KO parasites (red) in three different experiments.
Figure 7
Figure 7
Fitness of TcK1 depleted parasites in the different life cycle stages. (A) Parasites of the indicated lines were cultivated in LIT medium, supplemented with 10% SFB. The parasite concentration was measured daily by counting on MUSE equipment and a Neubauer chamber (n = 3). (B) Epimastigotes of the indicated lines in late exponential growth phase (3 × 10⁷/mL) were collected by centrifugation and incubated in TAU medium at 1 × 10⁸/mL for 1 h. Afterwards, the parasites were then diluted to 5 × 10⁶/mL in TAU 3AAG and maintained for 5 days to allow differentiation into metacyclic forms. Alternatively, the LIT cultures were centrifuged and resuspended to 5 × 10⁶/mL in Grace's medium and incubated for 5 days. At the end of incubation, the cells were stained by Giemsa and the number of metacyclic and epimastigotes forms counted in each case. The graphic shows the mean ± SD of three independent experiments. (C) Trypomastigotes of control and TcK1-KO lines (7.5 × 10⁵) in a volume of 0.1 mL obtained from the supernatant of infected cells were used to infect U2-OS cells (3 × 10⁴) seed a day before in 96 wells plates. After 6 h, the parasites were removed, the wells were washed, and one-half of the wells fixed with 4% p-formaldehyde in PBS and the other half incubated with fresh medium for 72 h, before washing and fixation. The number of intracellular parasites was then quantified by imaging the fluorescent parasites per cell both labeled with Draq5. The values are means ± SD of three independent experiments, each one corresponding to values of 5 wells. Asterisks indicate p < 0.01 (*) or 0.05 (**) calculated using the Student t-test.

Similar articles

Cited by

References

    1. Anderson P., Kedersha N. (2006). RNA granules. J. Cell Biol. 172:803–808. 10.1083/jcb.200512082 - DOI - PMC - PubMed
    1. Aslett M., Aurrecoechea C., Berriman M., Brestelli J., Brunk B. P., Carrington M., et al. . (2010). TriTrypDB: a functional genomic resource for the Trypanosomatidae. Nucleic Acids Res. 38, D457–D462. 10.1093/nar/gkp851 - DOI - PMC - PubMed
    1. Augusto L., Amin P. H., Wek R. C., Sullivan W. J. (2019). Regulation of arginine transport by GCN2 eIF2 kinase is important for replication of the intracellular parasite Toxoplasma gondii. PLoS Pathog. 15:e1007746. 10.1371/journal.ppat.1007746 - DOI - PMC - PubMed
    1. Aulas A., Fay M. M., Lyons S. M., Achorn C. A., Kedersha N., Anderson P., et al. . (2017). Stress-specific differences in assembly and composition of stress granules and related foci. J. Cell Sci. 130, 927–937. 10.1242/jcs.199240 - DOI - PMC - PubMed
    1. Babbitt S. E., Altenhofen L., Cobbold S. A., Istvan E. S., Fennell C., Doerig C., et al. . (2012). Plasmodium falciparum responds to amino acid starvation by entering into a hibernatory state. Proc. Natl. Acad. Sci. U.S.A. 109, E3278–3287. 10.1073/pnas.1209823109 - DOI - PMC - PubMed

Publication types

Substances