. 2020 Apr 21:10:160.
doi: 10.3389/fcimb.2020.00160. eCollection 2020.

Gut Microbiome Reveals Specific Dysbiosis in Primary Osteoporosis

Affiliations

Gut Microbiome Reveals Specific Dysbiosis in Primary Osteoporosis

Zhiming Xu et al. Front Cell Infect Microbiol. .

Abstract

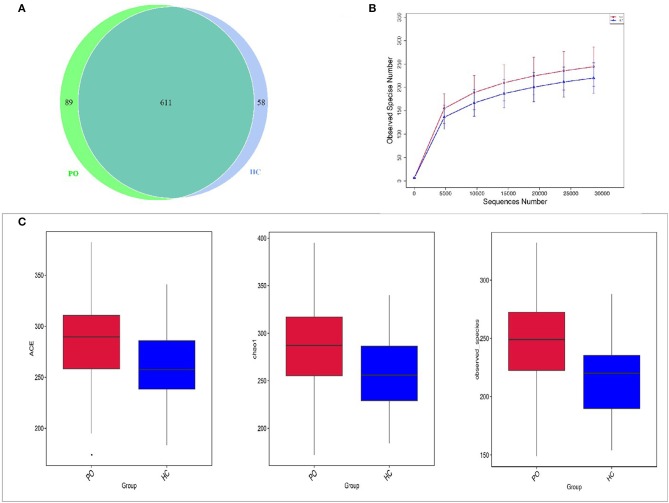
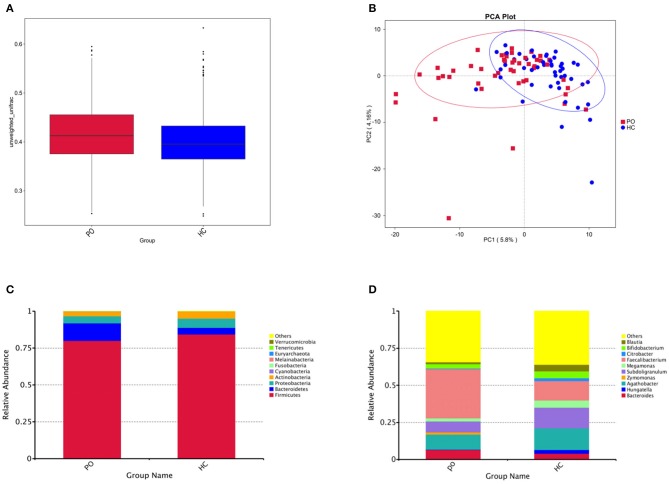
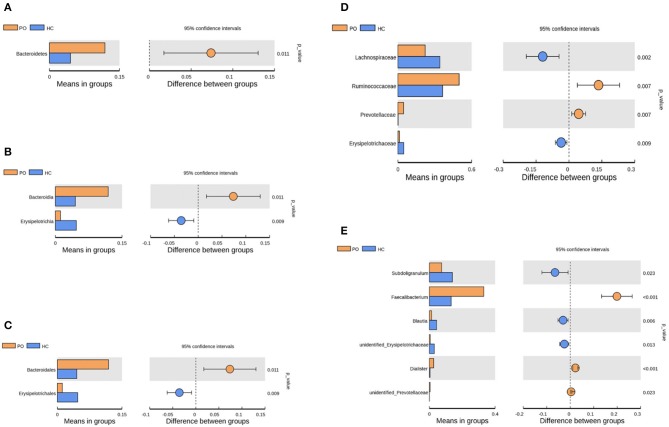
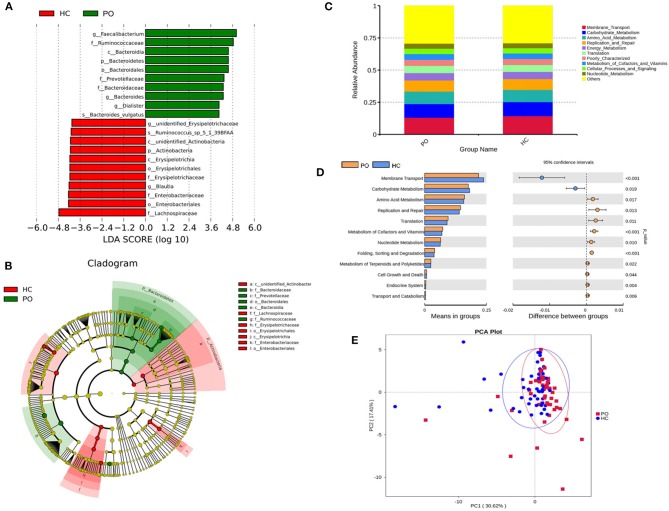
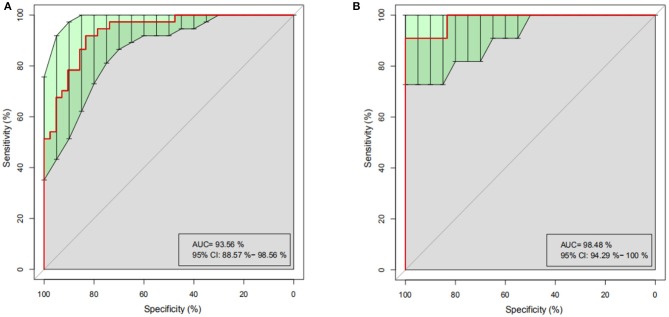
Object: Primary osteoporosis (PO) is the most common bone disease, which is characterized by decreased bone mass, damage of bone tissue microstructure, increased bone fragility, and is prone to fracture. Gut microbiome may be involved in bone metabolism of PO through gut-brain axis regulation of immune system and endocrine system, however, the specific mechanism is still unclear. The purpose of this study was to characterize the gut microbiome of patients with PO and its possible role in the occurrence and development of the disease. Methods: Fecal samples were collected from 48 PO patients and 48 healthy controls (HC). The composition of gut microbiome community was analyzed by 16s rDNA amplification sequencing, and the difference of gut microbiome composition between PO patients and HC individuals was compared. PICRUSt was also used to predict the biological function of gut microbiome in patients with PO, and to explore its possible role in the occurrence and development of this disease. The classification model is constructed by random forest algorithm so as to screen the key biomarkers. Result: The diversity of gut microorganisms in PO patients was significantly higher than that in HC group (p < 0.05) and there was significant difference in microbial composition in PO group. The abundance of Dialister (0.036 vs. 0.004, p < 0.001) and Faecalibacterium (0.331 vs. 0.132, p < 0.001) were significantly enriched which were the key flora related to PO. Although no significant correlation between bone mineral density and the richness of microbial communities are found, PICRUST results show that there are a wide range of potential pathways between gut microbiome and PO patients, including genetic information processing, metabolism, environmental information processing, cellular processes, human diseases, and organic systems. Notably, the discriminant model based on dominant microflora can effectively distinguish PO from HC (AUC = 93.56). Conclusions: The findings show that PO is related to the change of gut microbiome, especially the enriched Dialister and Faecalibacterium genera, which give new clues to understand the disease and provide markers for the diagnosis and new strategies for intervention treatment of the disease.

Keywords: 16s rDNA; biomarker; gut microbiome; metagenomic analysis; primary osteoporosis.


Figures

Figure 1
Figure 1
Comparison of gut microbiome structure between PO and HC group. (A) Venn diagram: each circle in the figure represents a group, the number of overlapping parts represents the number of OTUs shared between the groups, and the number without overlapping parts represents the number of OTUs unique to the group. (B) Rarefaction Curve, Abscissa is the number of sequencing strips randomly selected from a sample, and ordinate is the number of OTU that can be constructed based on the number of sequencing strips, which is used to reflect the sequencing depth (Blue, HC; Red, PO). (C) The alpha diversity of the two groups of gut microbial communities was described according to the ACE, Chao1 and observed_species indices. Box plot reflects median, degree of dispersion, maximum, minimum, and outliers. P-values were determined using T-test and wilcox Rank Sum Test. HC, healthy control; PO, primary osteoporosis; OTU, operational taxonomic unit.
Figure 2
Figure 2
(A) Box chart based on Beta diversity showed significant difference between the two groups. Abscissa represents Weighted Unifrac, Box plot response median, degree of dispersion, maximum, minimum, outliers. (B) Principal Component Analysis (PCA), the abscissa represents the first principal component, the percentage represents the contribution of the first principal component to the sample difference; the ordinate represents the second principal component, and the percentage represents the contribution of the second principal component to the sample difference; each point in the graph represents A sample (PC1 = 5.8%; PC2 = 4.16%) (Blue, HC; Red, PO). Cylindrical accumulation Map of relative abundance of species at Phylum level (C) and Genus level (D). The abscissa is grouping information; the ordinate represents Relative Abundance; others represents the sum of the relative abundances of all the phylums except the 10 phylums in the figure.
Figure 3
Figure 3
Species analysis of differences between groups by T-test between groups. Differential species between the two groups at the phylum (A), class (B), order (C), family (D), and Genus (E) classification levels. In each of the figures, the left panel shows the abundance of species differences between groups, and each bar in the graph represents the mean of each species in each group with significant differences in abundance between the groups. The graph on the right shows the difference between the confidence levels of the groups. The leftmost endpoint of each circle in the figure represents the 95% confidence interval lower limit of the mean difference, and the rightmost endpoint of the circle represents the 95% confidence interval upper limit of the mean difference. The center of the circle represents the difference in the mean. The group represented by the circle color is a group with a high mean. At the far right of the displayed results is the inter-group significance test p-value for the corresponding species (Orange, PO; Blue, HC).
Figure 4
Figure 4
(A) The LDA value distribution histogram shows the species with an LDA score greater than the set value (the default setting is 4), that is, the Biomarker with statistical differences between groups. The length of the histogram represents the impact of the different species (LDA score). (B) Evolutionary bifurcation graph, the circle of radiation from the inside to the outside represents the classification level from the gate to the genus (or species). Each small circle at different classification levels represents a classification at that level, and the diameter of the small circle is proportional to the relative abundance. The coloring principle: the species with no significant difference were uniformly colored yellow, the differential species Biomarker followed the group, and the red nodes represent the microbial group which played an important role in the red group. Green nodes represent microbial groups that play an important role in the green group. Where one of the groups is missing, it shows that there are no significant differences in species in this group, so the group is missing. The name of the species represented by the English letters in the picture is shown in the illustration on the right. (C) Level 2 relative abundance column chart, abscissa is grouping information; ordinates represent the relative abundance of functions; others represents the sum of the relative abundance of all functions other than these 10 functions in the diagram. (D) Inter-group functional difference analysis graph (for the illustration, please refer to the inter-group species difference analysis chart). (E) Display of PCA results of PICRUSt functional comments (PC1 = 30.62%; PC2 = 17.41%).
Figure 5
Figure 5
Random Forest analysis. Based on the representative discriminant model of 20 dominant genera, PO and HC are effectively distinguished. (A) ROC Curve of training set, abscissa: specificity scale, ordinate: sensitivity scale. (B) ROC curve of test set, abscissa: specificity scale, ordinate: sensitivity scale. ROC, receiver operating characteristic; AUC, area under the ROC curve; CI, confidence interval.

References

    1. Baker J. M., Al-Nakkash L., Herbst-Kralovetz M. M. (2017). Estrogen-gut microbiome axis: physiological and clinical implications. Maturitas 103, 45–53. 10.1016/j.maturitas.2017.06.025 - DOI - PubMed
    1. Belzer C., Chia L. W., Aalvink S., Chamlagain B., Piironen V., Knol J., et al. . (2017). Microbial metabolic networks at the mucus layer lead to diet-independent butyrate and Vitamin B12 production by intestinal symbionts. MBio 8:e00770–17. 10.1128/mBio.00770-17 - DOI - PMC - PubMed
    1. Biver E., Berenbaum F., Valdes A. M., Araujo De Carvalho I., Bindels L. B., Brandi M. L., et al. . (2019). Gut microbiota and osteoarthritis management: an expert consensus of the European society for clinical and economic aspects of osteoporosis, osteoarthritis and musculoskeletal diseases (ESCEO). Ageing Res. Rev. 55:100946. 10.1016/j.arr.2019.100946 - DOI - PubMed
    1. Black D. M., Rosen C. J. (2016). Clinical practice. Postmenopausal osteoporosis. N. Engl. J. Med. 374, 254–262. 10.1056/NEJMcp1513724 - DOI - PubMed
    1. Brown C. (2017). Osteoporosis: staying strong. Nature 550, S15–S17. 10.1038/550S15a - DOI - PubMed

Publication types