. 2020 Apr 21:10:162.
doi: 10.3389/fcimb.2020.00162. eCollection 2020.

A New Hope for CD56negCD16pos NK Cells as Unconventional Cytotoxic Mediators: An Adaptation to Chronic Diseases

Affiliations

A New Hope for CD56negCD16pos NK Cells as Unconventional Cytotoxic Mediators: An Adaptation to Chronic Diseases

Catherine S Forconi et al. Front Cell Infect Microbiol. .

Abstract

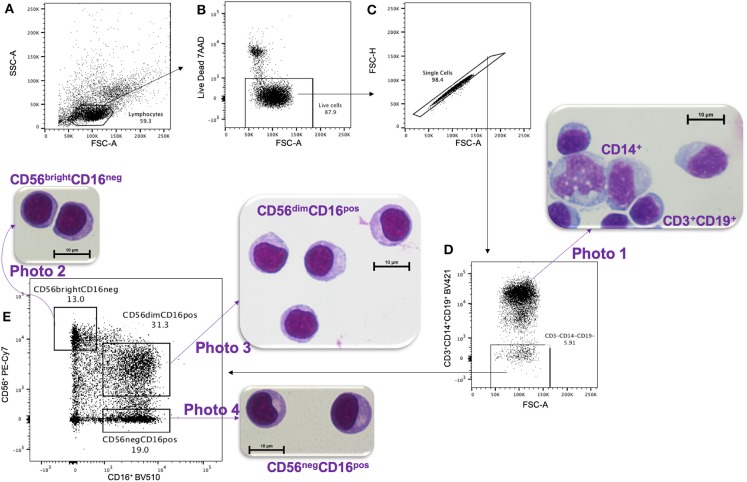
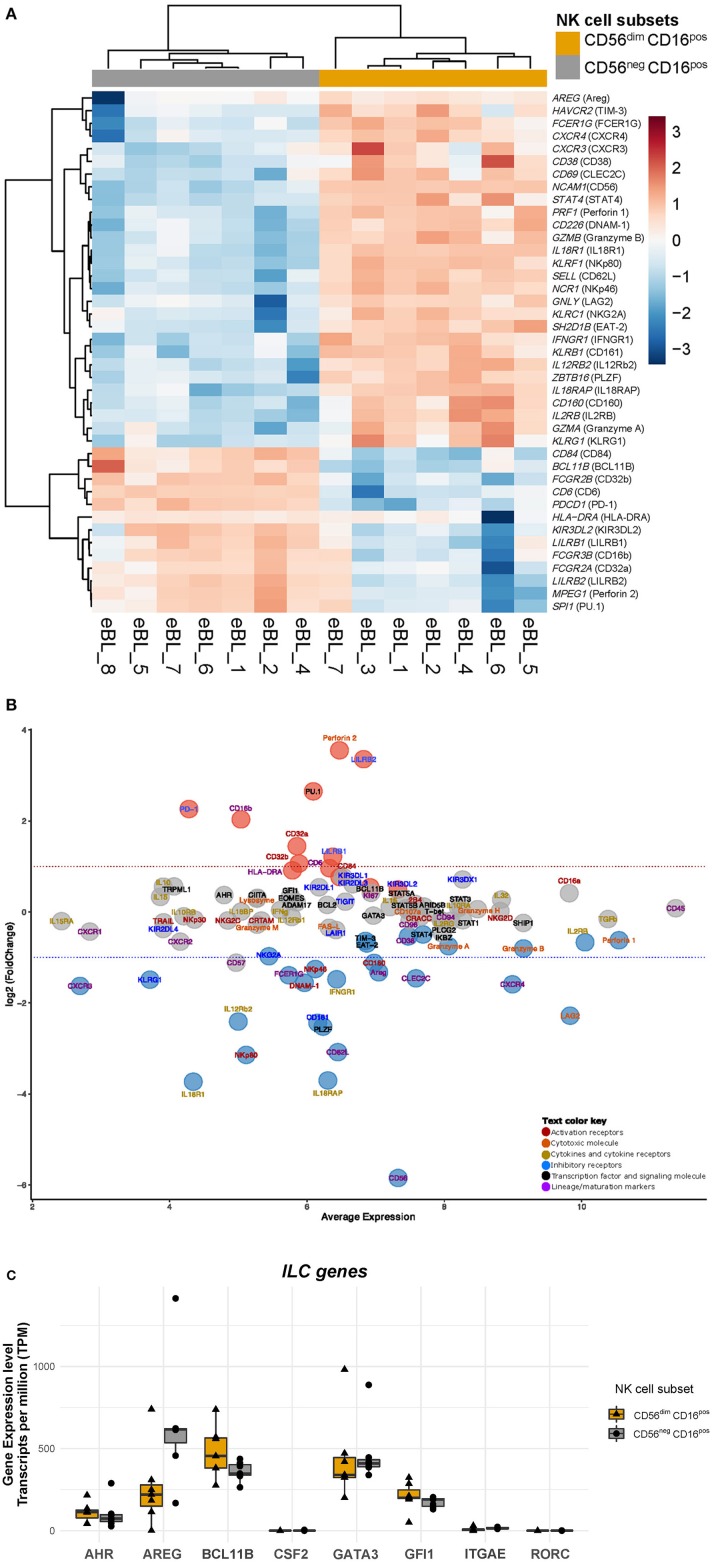
Natural Killer (NK) cells play an essential role in antiviral and anti-tumoral immune responses. In peripheral blood, NK cells are commonly classified into two major subsets: CD56brightCD16neg and CD56dimCD16pos despite the characterization of a CD56negCD16pos subset 25 years ago. Since then, several studies have described the prevalence of an CD56negCD16pos NK cell subset in viral non-controllers as the basis for their NK cell dysfunction. However, the mechanistic basis for their cytotoxic impairment is unclear. Recently, using a strict flow cytometry gating strategy to exclude monocytes, we reported an accumulation of CD56negCD16pos NK cells in Plasmodium falciparum malaria-exposed children and pediatric cancer patients diagnosed with endemic Burkitt lymphoma (eBL). Here, we use live-sorted cells, histological staining, bulk RNA-sequencing and flow cytometry to confirm that this CD56negCD16pos NK cell subset has the same morphological features as the other NK cell subsets and a similar transcriptional profile compared to CD56dimCD16pos NK cells with only 120 genes differentially expressed (fold change of 1.5, p < 0.01 and FDR<0.05) out of 9235 transcripts. CD56negCD16pos NK cells have a distinct profile with significantly higher expression of MPEG1 (perforin 2), FCGR3B (CD16b), FCGR2A, and FCGR2B (CD32A and B) as well as CD6, CD84, HLA-DR, LILRB1/2, and PDCD1 (PD-1), whereas Interleukin 18 (IL18) receptor genes (IL18RAP and IL18R1), cytotoxic genes such as KLRF1 (NKp80) and NCR1 (NKp46), and inhibitory HAVCR2 (TIM-3) are significantly down-regulated compared to CD56dimCD16pos NK cells. Together, these data confirm that CD56negCD16pos cells are legitimate NK cells, yet their transcriptional and protein expression profiles suggest their cytotoxic potential is mediated by pathways reliant on antibodies such as antibody-dependent cell cytotoxicity (ADCC), antibody-dependent respiratory burst (ADRB), and enhanced by complement receptor 3 (CR3) and FAS/FASL interaction. Our findings support the premise that chronic diseases induce NK cell modifications that circumvent proinflammatory mediators involved in direct cytotoxicity. Therefore, individuals with such altered NK cell profiles may respond differently to NK-mediated immunotherapies, infections or vaccines depending on which cytotoxic mechanisms are being engaged.

Keywords: CD56negCD16pos subset; endemic Burkitt lymphoma; epstein-barr virus; malaria; natural killer cells; transcription profile.


Figures

Figure 1
Figure 1
Gating strategy for FACS and HandE staining. PMBCs were gated on (A) lymphocytes size determined by SSC-A vs. FSC-A cytoplots, then (B) live, and (C) single cells were selected. (D) A Dump channel was used to eliminate CD3+, CD14+, and CD19+ cells. These cells were stained purple using hematoxylin and eosin (HandE), as shown in photo 1. Then (D) CD3CD14CD19 cells were (E) sorted based on CD56 vs. CD16 expression and the three isolated NK cell subsets were stained with HandE: photo 2 CD56brightCD16neg, photo 3 CD56dimCD16pos, and photo 4 CD56negCD16pos.
Figure 2
Figure 2
Heatmap and MA plot of selected differentially expressed genes associated with NK cell function. (A) Heatmap of selected NK cell genes comparing CD56negCD16pos and CD56dimCD16pos NK cells. The id between the brackets are the protein name for that particulate gene, i.e., gene symbol (protein name), NCAM1 (CD56). (B) MA plot of differential expression analysis between CD56negCD16pos and CD56dimCD16pos NK cell subsets. The MA plot illustrates a log2 fold change of NK specific gene expression in CD56negCD16pos relative to CD56dimCD16pos cells and the average normalized expression counts of genes expressed by CD56negCD16pos cells. Protein names are used in the MA plot for ease of comparison to flow data even though these results are for gene expression. The Red dots indicate genes that have significantly higher expression in CD56negCD16pos relative to CD56dimCD16pos NK cells (with BH-adjusted p-value < 0.01 and FDR < 0.05), whereas blue dots indicate genes that have significantly lower expression (with BH-adjusted p-value < 0.01 and FDR < 0.05), and gray dots are genes that are similarly expressed. (C) Boxplot of gene expression profiles that define Innate Lymphoid Cells (ILCs): AHR, AREG, BCL11B, CSF2, GATA3, GFI1, IRGAE, RORC comparing CD56negCD16pos relative to CD56dimCD16pos NK cells.
Figure 3
Figure 3
Validation of RNA-sequencing data by flow cytometry. (A) Heatmap of markers expressed on both CD56dimCD16pos (in green) and CD56negCD16pos (in purple) NK cells from eBL (in turquoise) and healthy (in pink) children. (B) Violin plots showing the protein expression of IL18Ra, CD62L, DNAM1, TIM3, CD32, granzyme B and PD-1 from both CD56dimCD16pos (in green) and CD56negCD16pos (in purple) NK cells. *Represents a p-value < 0.05.
Figure 4
Figure 4
Manhattan plot of functional profiling of the list of upregulated genes from CD56negCD16pos relative to CD56dimCD16pos cells. Using the online tool gProfiler and the ordered g:GOSt query, we assessed which biological process (BP) will be linked to the list of 536 significantly differentially expressed genes from CD56negCD16pos relative to CD56dimCD16pos cells. The x-axis represents functional terms that are grouped and color-coded by data sources [molecular function (MF), biological process (BP), cell component (CC)]. The y-axis shows the adjusted enrichment p-values in negative log10 scale. Adjusted p-values g:GOSt used Bonferroni correction and a threshold of 0.01. On the table, adjusted p-values were color coded as yellow for insignificant findings to dark blue with highest significance.
Figure 5
Figure 5
Hypothetical model of CD56dimCD16pos and CD56negCD16pos NK cells cytotoxic pathways against both Plasmodium falciparum-infected red blood cells (Pf-iRBC) and endemic Burkitt lymphoma (eBL) tumor cells. (A) Proposed killing pathways used by CD56dimCD16pos NK cells against iRBCs and eBL tumors primarily mediated by natural direct cytotoxicity (direct killing) through the activation of cytotoxic receptors (NKp46, NKp30, NKp80, NKG2D…) but also antibody dependent cell cytotoxicity (ADCC) through CD16a activation. (B) Proposed killing pathways used by CD56negCD16pos NK cells against iRBC and eBL tumors. Due to the low expression of cytotoxic receptors, direct killing appears to be incapacitated however other killing pathways based on recognition of opsonized targets might be enhanced.

Similar articles

Cited by

References

    1. Andrews S. (2014). FastQC. A Quality Control Tool for High Throughput Sequence Data. Babraham Bioinformatics. Available online at: http://www.bioinformatics.babraham.ac.uk/projects/fastqc
    1. Arora G., Hart G. T., Manzella-Lapeira J., Doritchamou J. Y., Narum D. L., Thomas L. M., et al. . (2018). NK cells inhibit Plasmodium falciparum growth in red blood cells via antibody-dependent cellular cytotoxicity. Elife 7:e36806. 10.7554/eLife.36806 - DOI - PMC - PubMed
    1. Azzi T., Lünemann A., Murer A., Ueda S., Béziat V., Malmberg K.-J., et al. . (2014). Role for early-differentiated natural killer cells in infectious mononucleosis. Blood 124, 2533–2543. 10.1182/blood-2014-01-553024 - DOI - PMC - PubMed
    1. Blank C. U., Haining W. N., Held W., Hogan P. G., Kallies A., Lugli E., et al. (2019). Defining “T cell exhaustion.” Nat. Rev. Immunol. 19, 665–674. 10.1038/s41577-019-0221-9 - DOI - PMC - PubMed
    1. Bradley T., Peppa D., Pedroza-Pacheco I., Li D., Cain D. W., Henao R., et al. . (2018). RAB11FIP5 expression and altered natural killer cell function are associated with induction of HIV broadly neutralizing antibody responses. Cell 175, 387–399.e17. 10.1016/j.cell.2018.08.064 - DOI - PMC - PubMed

Publication types