. 2020 Apr 21:7:176.
doi: 10.3389/fvets.2020.00176. eCollection 2020.

Animal Disease Surveillance in the 21st Century: Applications and Robustness of Phylodynamic Methods in Recent U.S. Human-Like H3 Swine Influenza Outbreaks

Affiliations

Animal Disease Surveillance in the 21st Century: Applications and Robustness of Phylodynamic Methods in Recent U.S. Human-Like H3 Swine Influenza Outbreaks

Moh A Alkhamis et al. Front Vet Sci. .

Abstract

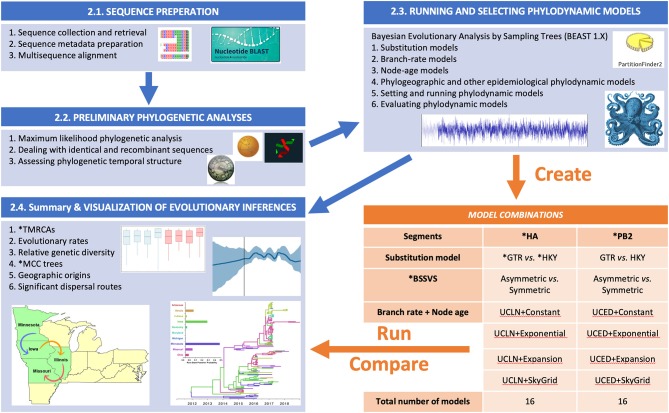
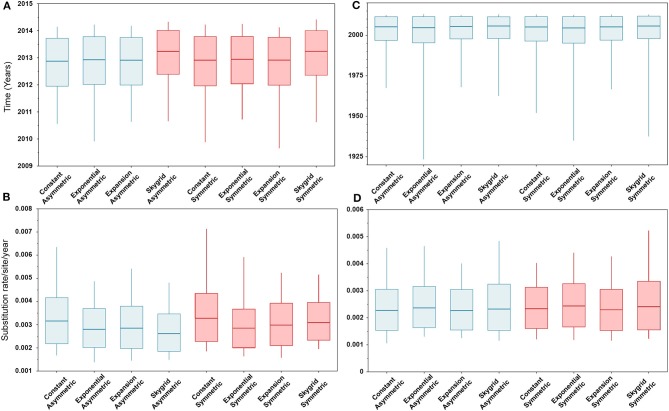
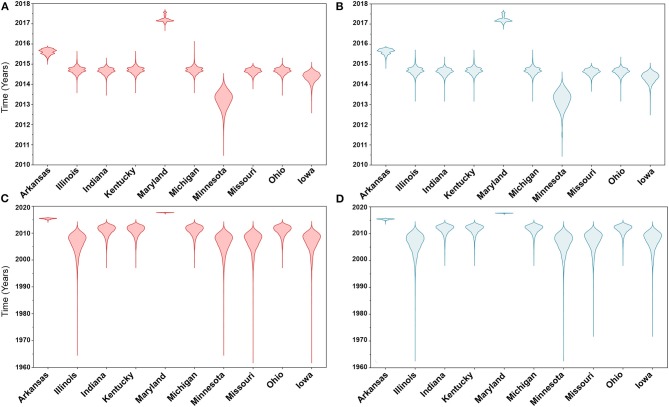
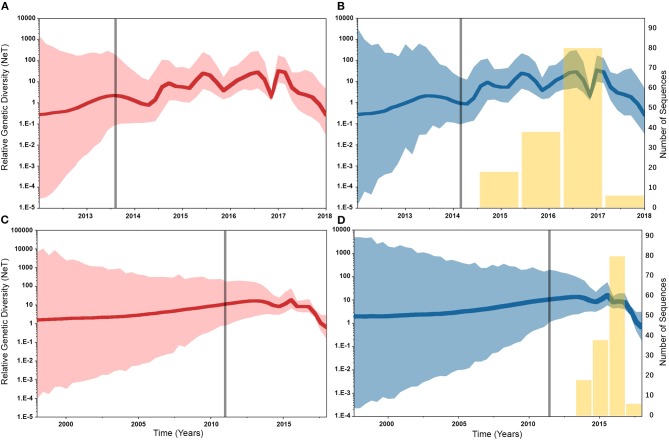
Emerging and endemic animal viral diseases continue to impose substantial impacts on animal and human health. Most current and past molecular surveillance studies of animal diseases investigated spatio-temporal and evolutionary dynamics of the viruses in a disjointed analytical framework, ignoring many uncertainties and made joint conclusions from both analytical approaches. Phylodynamic methods offer a uniquely integrated platform capable of inferring complex epidemiological and evolutionary processes from the phylogeny of viruses in populations using a single Bayesian statistical framework. In this study, we reviewed and outlined basic concepts and aspects of phylodynamic methods and attempted to summarize essential components of the methodology in one analytical pipeline to facilitate the proper use of the methods by animal health researchers. Also, we challenged the robustness of the posterior evolutionary parameters, inferred by the commonly used phylodynamic models, using hemagglutinin (HA) and polymerase basic 2 (PB2) segments of the currently circulating human-like H3 swine influenza (SI) viruses isolated in the United States and multiple priors. Subsequently, we compared similarities and differences between the posterior parameters inferred from sequence data using multiple phylodynamic models. Our suggested phylodynamic approach attempts to reduce the impact of its inherent limitations to offer less biased and biologically plausible inferences about the pathogen evolutionary characteristics to properly guide intervention activities. We also pinpointed requirements and challenges for integrating phylodynamic methods in routine animal disease surveillance activities.

Keywords: disease surveillance; evolutionary epidemiology; human-like H3; phylodynamics; phylogeography; swine influenza.


Figures

Figure 1
Figure 1
Flow chart showing the steps for our Bayesian phylodynamic statistical framework. Blue boxes summarize the methodological steps for the statistical framework described in the BAYESIAN PHYLODYNAMIC STATISTICAL FRAMEWORK section of the main text (Sequence Preparation section to Summary and Visualization of Evolutionary Inferences section). The orange table indicates the generated models for swine influenza example data described in Section Worked Example: Evolutionary Dynamics of Swine Influenza in the United States Between 2015 and 2018. ML, maximum likelihood; RDP, Recombination Detection Program; ESS, effect sample size; BF, Bayes factor; PS, path sampling; SS, stepping stone; HA, hemagglutinin; PB2, polymerase basic 2; GTR, general time-reversable; HKY, Hasegawa, Kishino, and Yano; BSSVS, Bayesian Stochastic Search Variable Selection; TMRCAs, Time to the Most Recent Common Ancestor; MCC, Maximum Clade Credibility.
Figure 2
Figure 2
Box plots of divergence times and evolutionary rates (substitution rate/site/year) of hemagglutinin (HA) and polymerase basic 2 (PB2) gene segments of human-like H3 swine influenza virus collected between January 2015 and June 2018 in the United States. The boxplots summarize the posterior estimates of eight phylodynamic model combinations (node-age and BSSVS priors) for each gene segment. Boxes represent 95% high posterior density (HPD), and midlines indicate the posterior median for each estimate. Blue and red boxes indicate symmetric and asymmetric models, respectively. (A) Divergence times of HA gene. (B) Substitution rates/site/year of HA gene. (C) Divergence times of PB2 gene. (D) Substitution rates/site/year of PB2 gene.
Figure 3
Figure 3
Violin plots of state level time to the most recent common ancestors (TMRCA) of hemagglutinin (HA) and polymerase basic 2 (PB2) gene segments of human-like H3 swine influenza virus collected between January 2015 and June 2018 in the United States. The plots were generated from the Skygrid coalescent tree model. Red and blue colors indicate the asymmetric and symmetric BSSVS priors, respectively. (A) TMRCAs of HA gene estimated from the asymmetric BSSVS model; (B) TMRCAs of HA gene estimated from the symmetric BSSVS model; (C) TMRCAs of PB2 gene estimated from the asymmetric BSSVS model; (D) TMRCAs of PB2 gene estimated from the symmetric BSSVS model.
Figure 4
Figure 4
Bayesian Skygrid (SG) plots of the relative genetic diversity through time of hemagglutinin (HA) and polymerase basic 2 (PB2) segments of human-like H3 swine influenza virus collected between January 2015 and June 2018 in the United States. The dark line indicates the posterior median estimate, and the 95% high posterior density (HPD) is indicated by the light shaded areas (red and blue for the asymmetric and symmetric BSSVS priors, respectively). The vertical gray line indicates the estimated time at which the relative genetic diversity transitioned from a slow to a fast growth rate. Yellow bars indicate the temporal distribution of the sequence data. (A) SG plot of HA gene inferred from the asymmetric BSSVS prior. (B) SG plot of HA gene inferred from the symmetric BSSVS prior. (C) SG plot of PB2 gene inferred from the asymmetric BSSVS prior; (D) SG plot of PB2 gene inferred from the symmetric BSSVS prior.
Figure 5
Figure 5
Maximum clade credibility (MCC) phylogeny of the HA segment of human-like H3 swine influenza virus collected between January 2015 and June 2018 in the United States. The trees are inferred from eight phylodynamic model combinations (node-age and BSSVS priors). The color of the branches represents the most probable location state of their descendant nodes, and their color-coding corresponds to the upper left bar chart, which represents the root location state posterior probabilities (RSPP) for each state. (A–D) Trees inferred from four node-age + asymmetric BSSVS priors. (E–H) Trees inferred from four node-age + symmetric BSSVS priors.
Figure 6
Figure 6
Maximum clade credibility (MCC) phylogeny of the PB2 segment of human-like H3 swine influenza virus collected between January 2015 and June 2018 in the United States. The trees are inferred from eight phylodynamic model combinations (node-age and BSSVS priors). The color of the branches represents the most probable location state of their descendant nodes, and their color-coding corresponds to the upper left bar chart, which represents the root location state posterior probabilities (RSPP) for each state. (A–D) Trees inferred from four node-age + asymmetric BSSVS priors. (E–H) Trees inferred from four node-age + symmetric BSSVS priors.
Figure 7
Figure 7
Dispersal routes of human-like H3 swine influenza virus between states inferred from the HA gene segment. Dispersal routes with non-zero rates were inferred using the Bayesian stochastic search variable selection (BSSVS) approach, and statistically significant routes were selected using Bayes factors (BF). The top three dispersal routes with the strongest statistical support (by the BFs) are plotted. Arrows' colors correspond to the color legend of their BF values on the upper right of each map. (A–D) Dispersal routes inferred from four node-age + asymmetric BSSVS priors. (E–H) Dispersal routes inferred from four node-age + symmetric BSSVS priors.
Figure 8
Figure 8
Dispersal routes of human-like H3 swine influenza virus between states inferred from the PB2 gene segment. Dispersal routes with non-zero rates were inferred using the Bayesian stochastic search variable selection (BSSVS) approach, and statistically significant routes were selected using Bayes factors (BF). The top three dispersal routes with the strongest statistical support (by the BFs) are plotted. Arrows' colors correspond to the color legend of their BF values on the upper right of each map. (A–D) Dispersal routes inferred from four node-age + asymmetric BSSVS priors. (E–H) Dispersal routes inferred from four node-age + symmetric BSSVS priors.

Similar articles

Cited by

References

    1. Perez A, AlKhamis M, Brito B, Carrasco-Medanic R, Whedbee Z, Willeberg P, et al. Carlsson: global animal disease surveillance. Spat Spatiotemporal Epidemiol. (2011) 2:135–45. 10.1016/j.sste.2011.07.006 - DOI - PMC - PubMed
    1. Alvarez J, Valdes-Donoso P, Tousignant S, Alkhamis M, Morrison R, Perez A. Novel analytic tools for the study of porcine reproductive and respiratory syndrome virus (PRRSv) in endemic settings: lessons learned in the U.S. Porcine Health Manag. (2016) 2:1–9. 10.1186/s40813-016-0019-0 - DOI - PMC - PubMed
    1. Vilalta C, Arruda AG, Tousignant SJP, Valdes-Donoso P, Muellner P, Muellner U, et al. . A Review of quantitative tools used to assess the epidemiology of porcine reproductive and respiratory syndrome in U.S. swine farms using dr. morrison's swine health monitoring program data. Front Vet Sci. (2017) 4:94. 10.3389/fvets.2017.00094 - DOI - PMC - PubMed
    1. Gardy JL, Loman NJ. Towards a genomics-informed, real-time, global pathogen surveillance system. Nat Rev Genet. (2018) 19:9–20. 10.1038/nrg.2017.88 - DOI - PMC - PubMed
    1. Cattoli G, Monne I, Fusaro A, Joannis TM, Lombin LH, Aly MM, et al. . Highly pathogenic avian influenza virus subtype H5N1 in Africa: a comprehensive phylogenetic analysis and molecular characterization of isolates. PLoS ONE. (2009) 4:e4842. 10.1371/journal.pone.0004842 - DOI - PMC - PubMed