. 2019 Jul;1(7):717-730.
doi: 10.1038/s42255-019-0084-1. Epub 2019 Jul 12.

Entry of glucose- and glutamine-derived carbons into the citric acid cycle supports early steps of HIV-1 infection in CD4 T cells

Affiliations

Entry of glucose- and glutamine-derived carbons into the citric acid cycle supports early steps of HIV-1 infection in CD4 T cells

Isabelle Clerc et al. Nat Metab. 2019 Jul.

Abstract

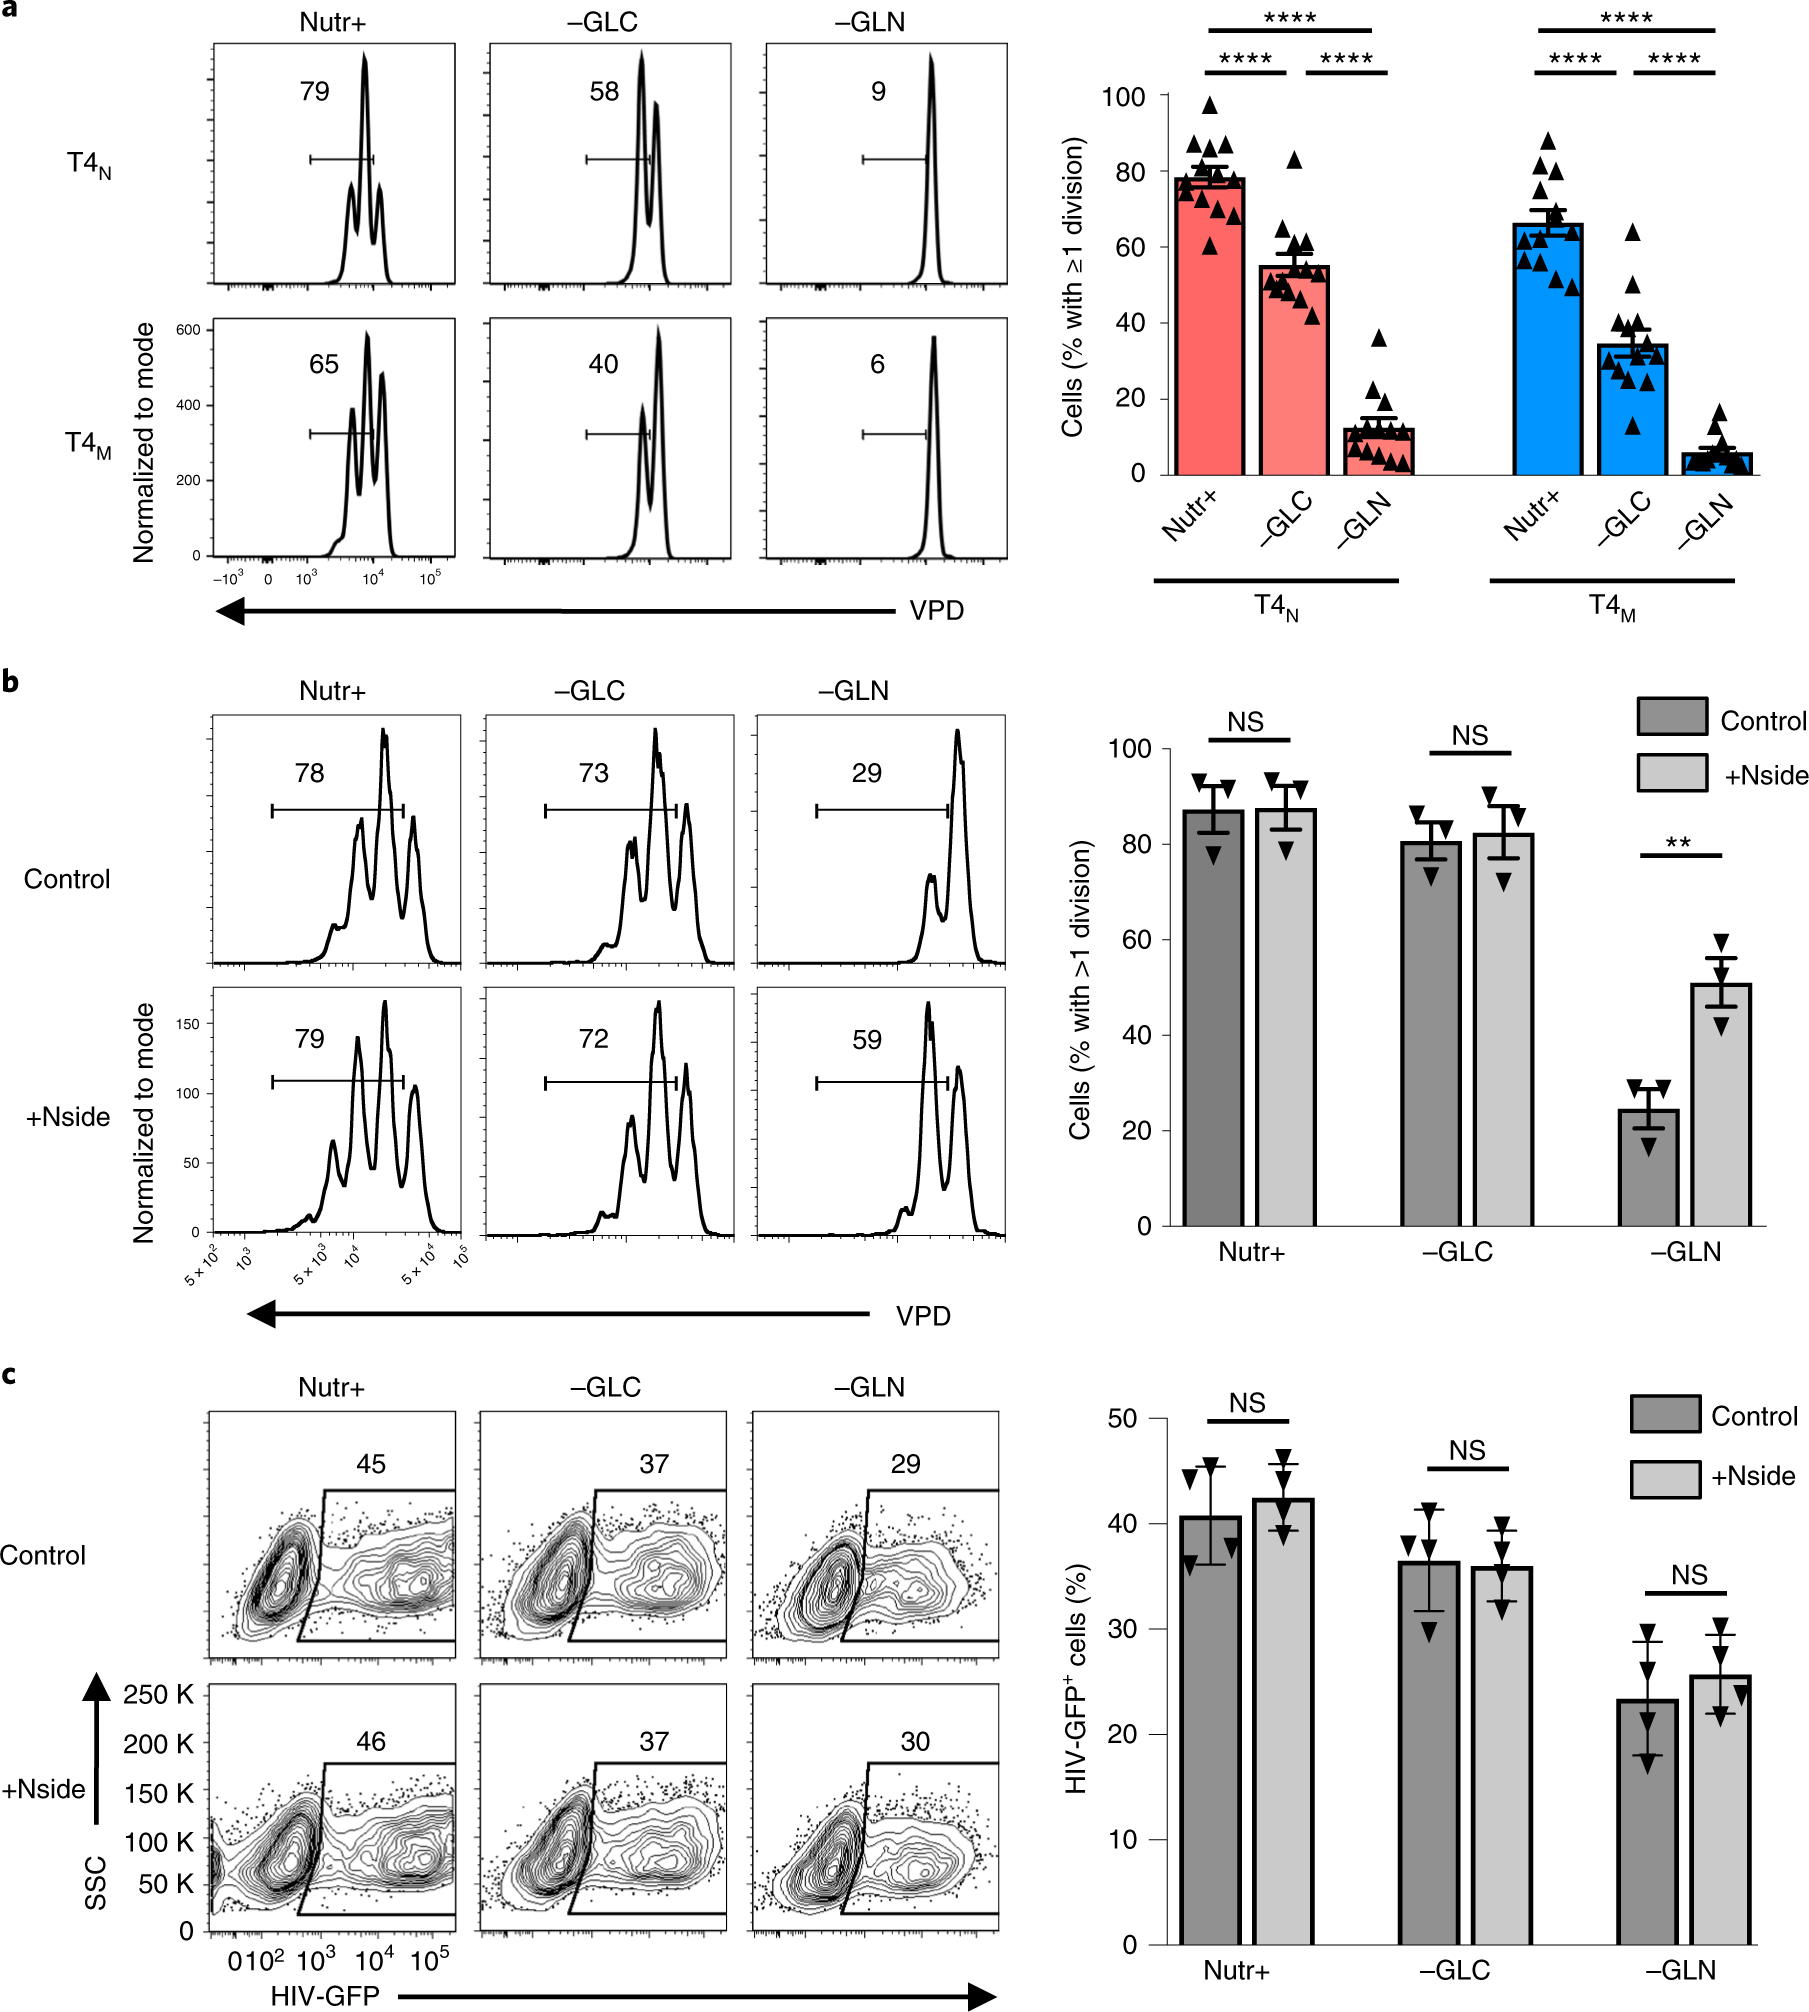
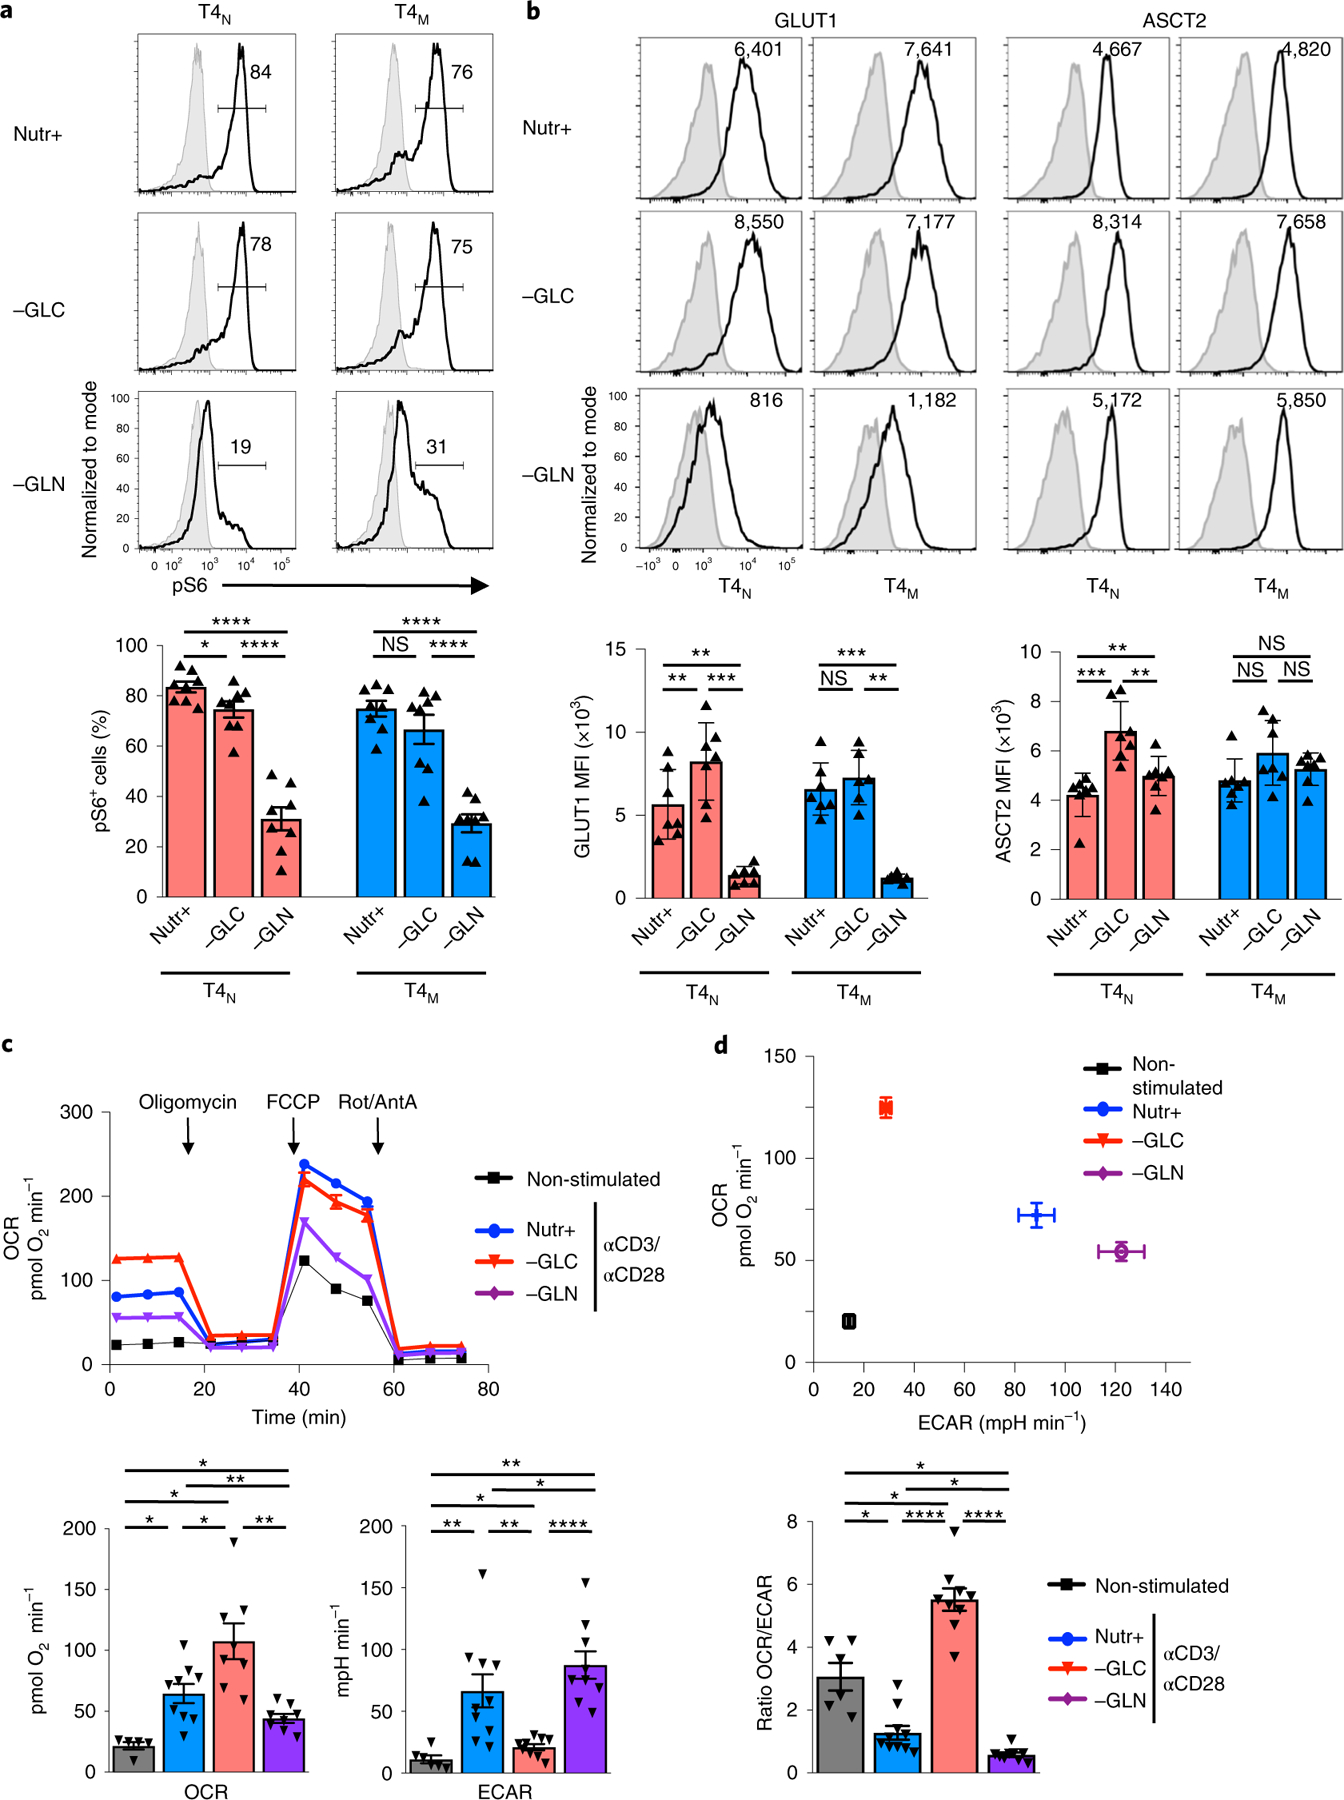
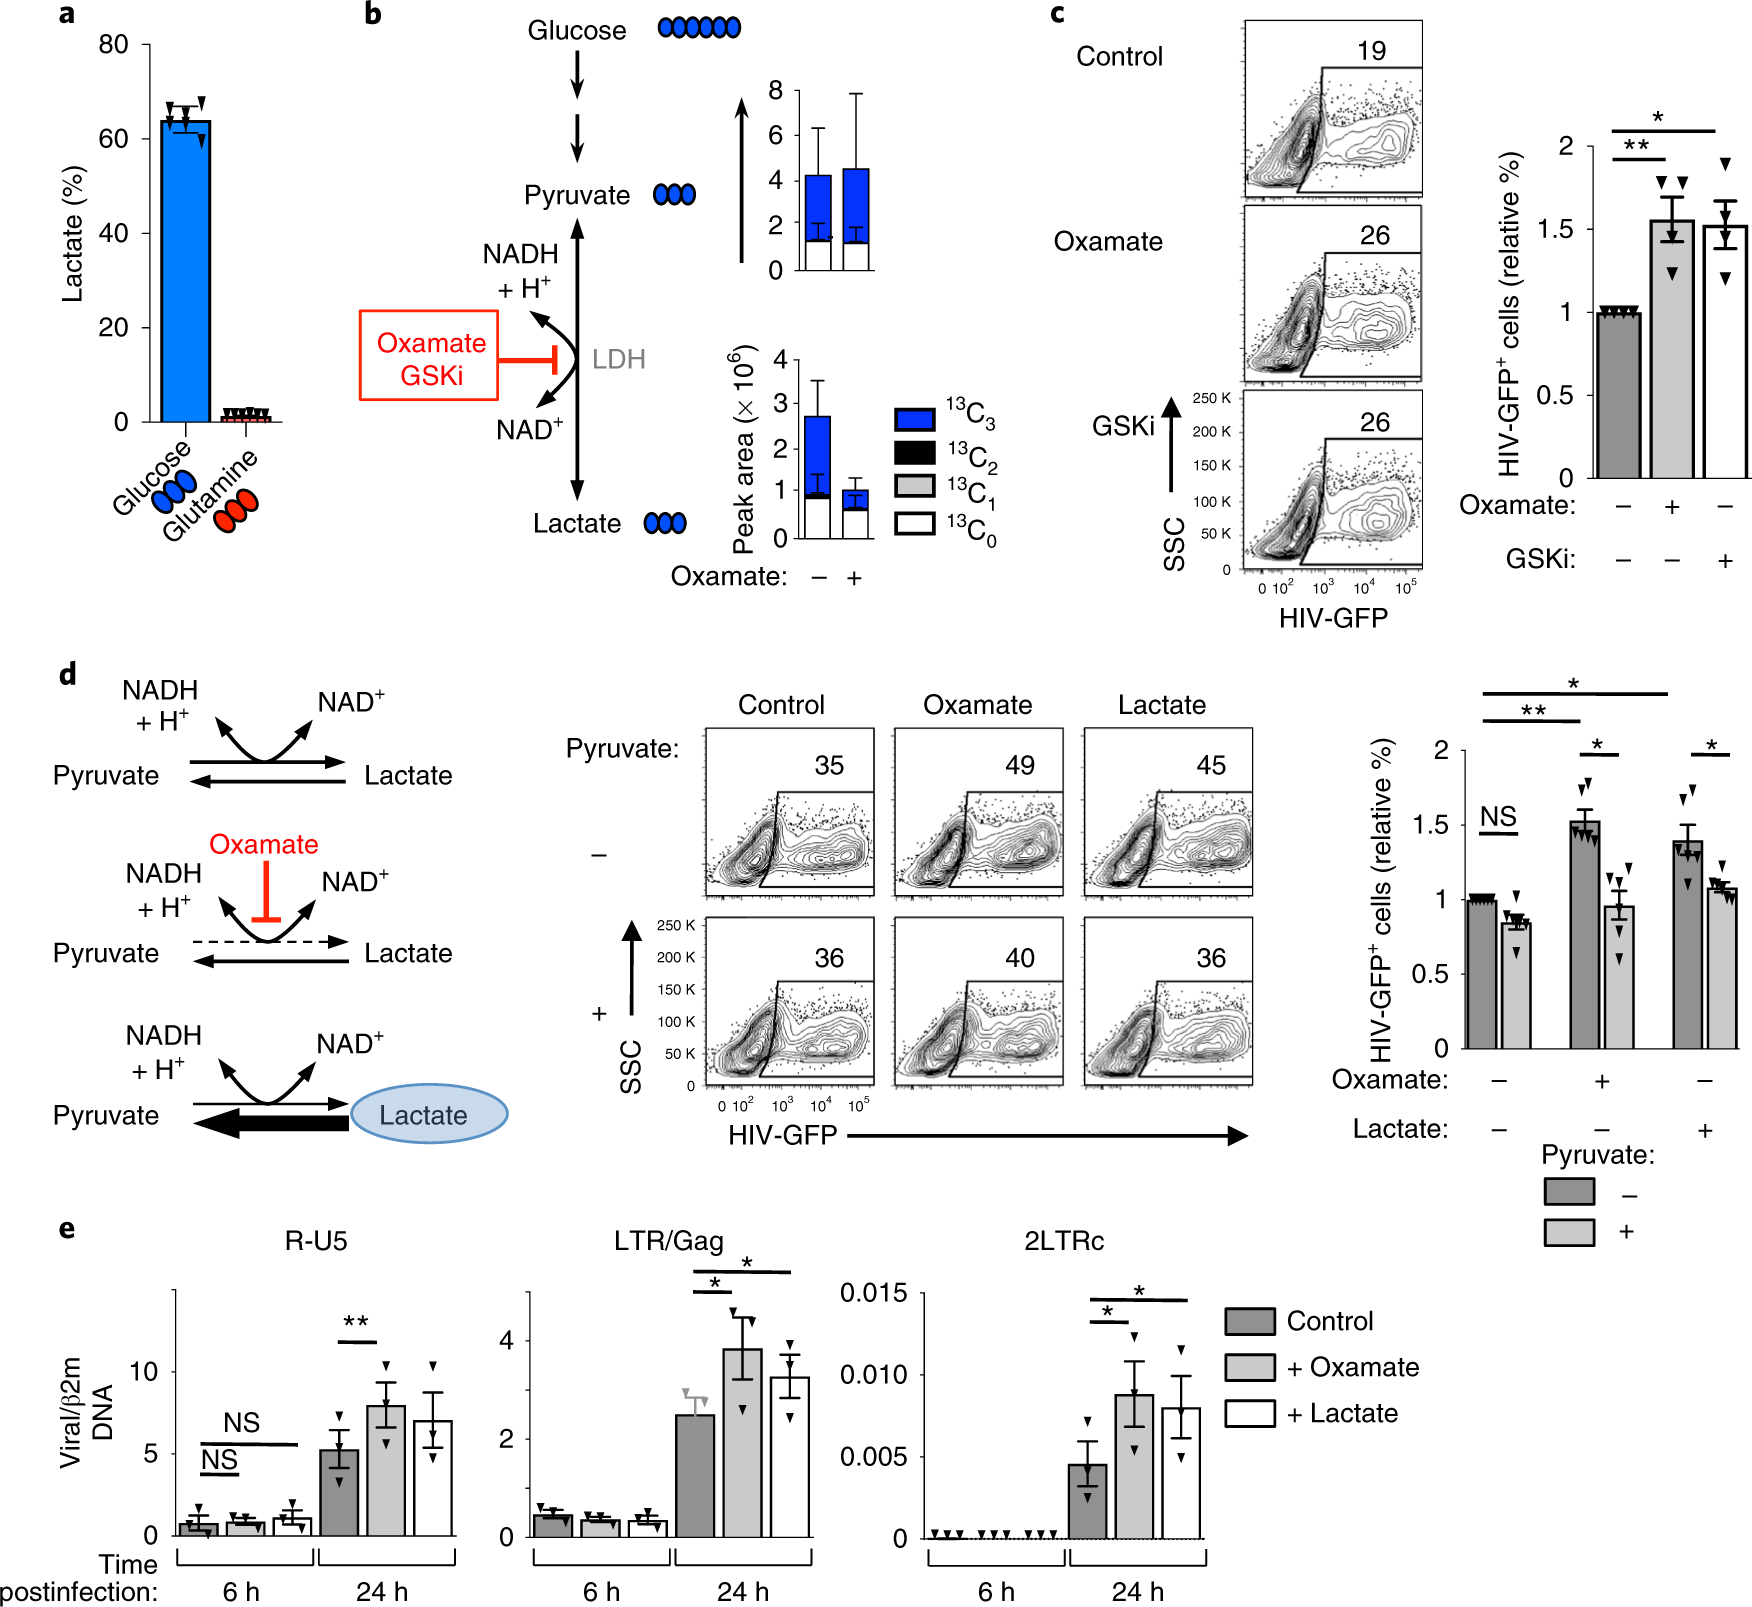
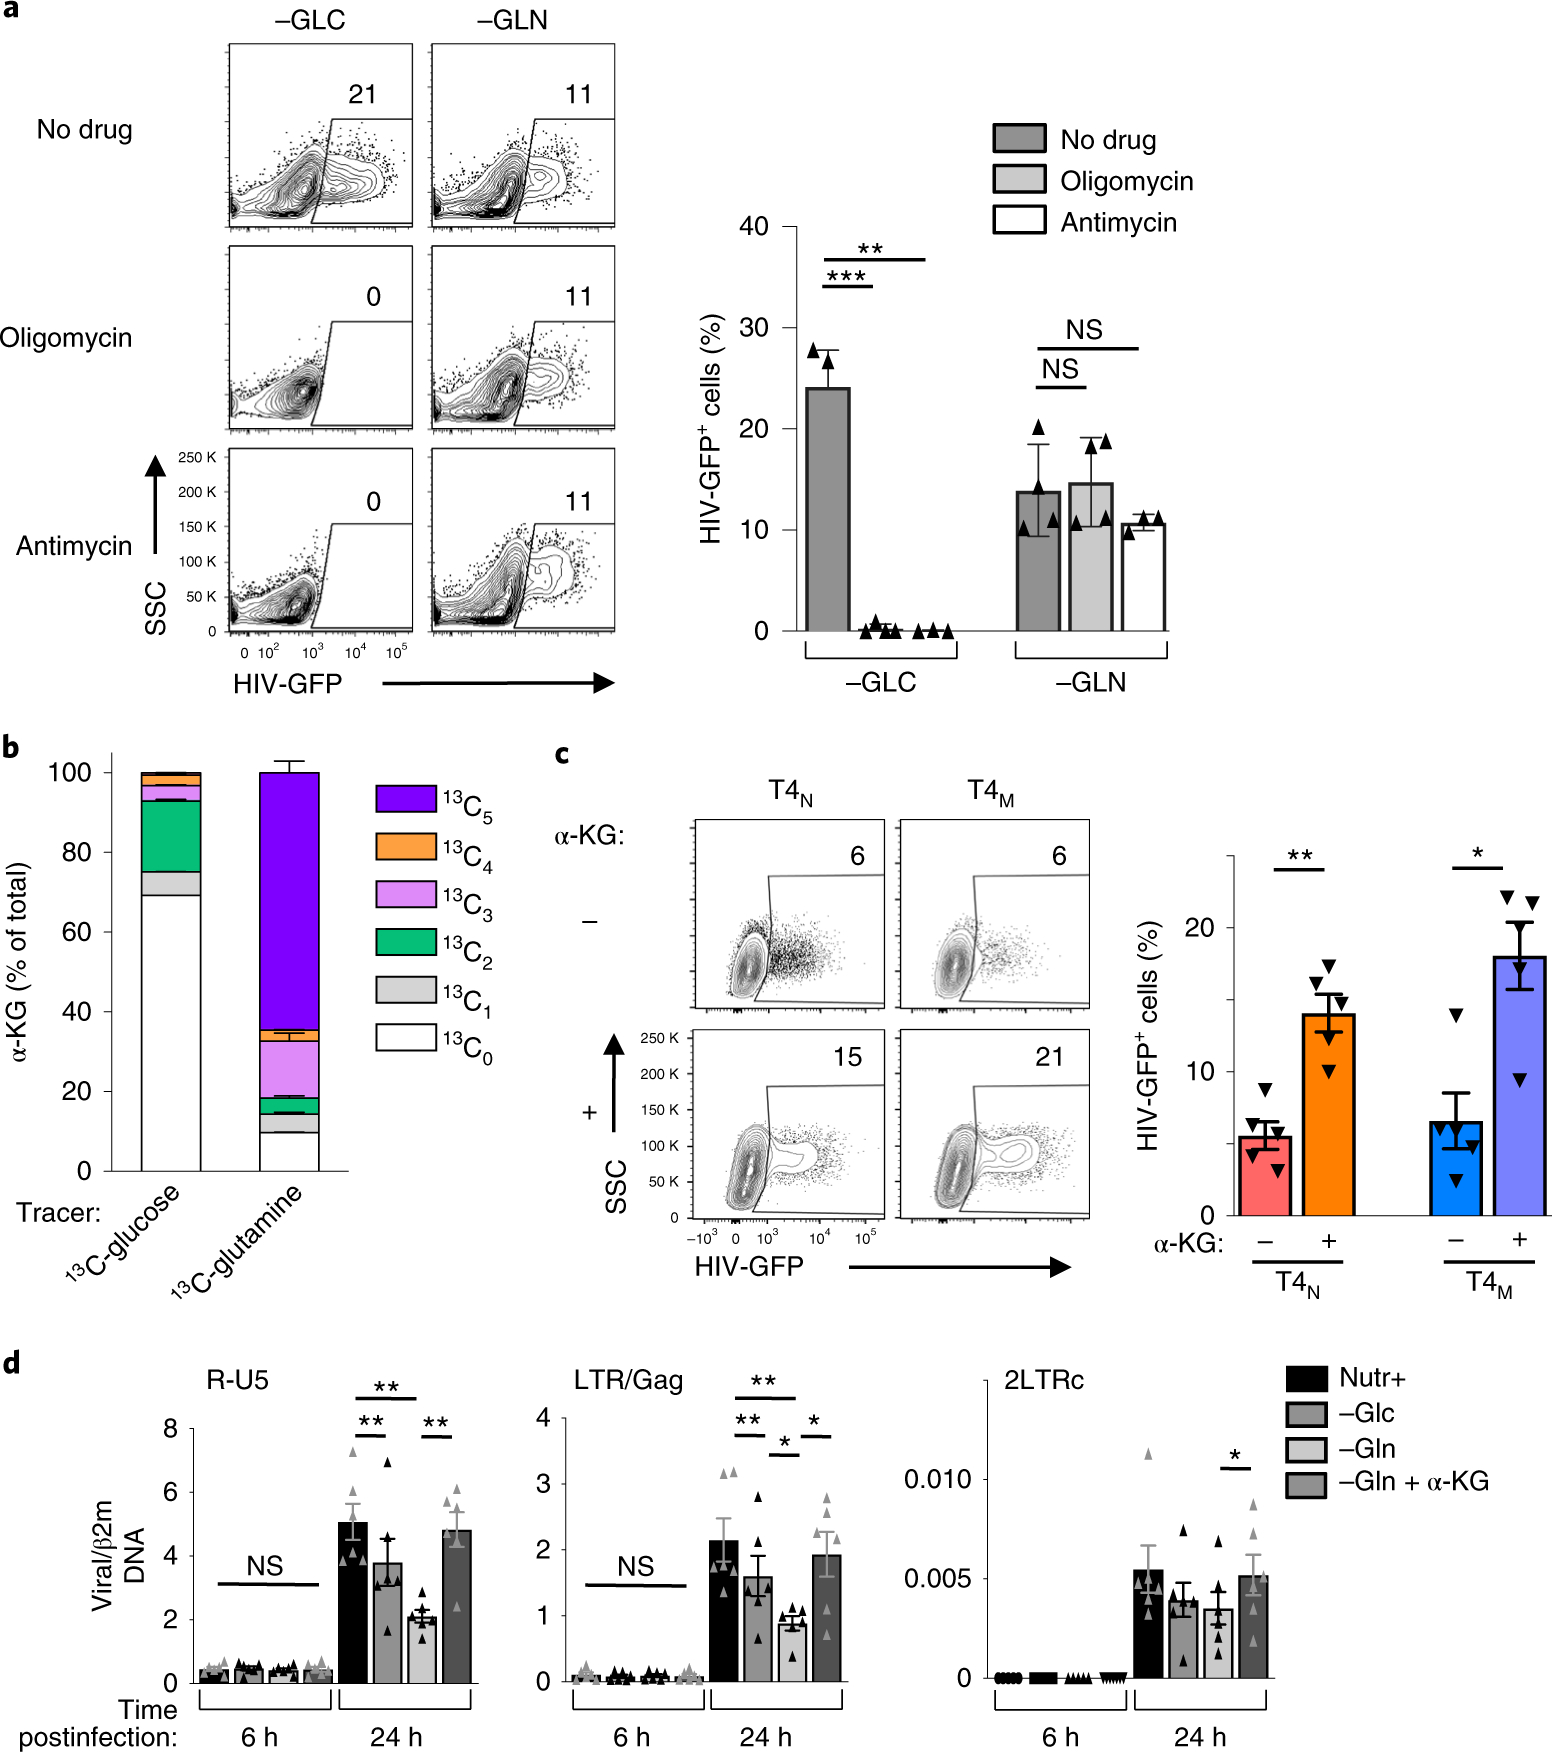
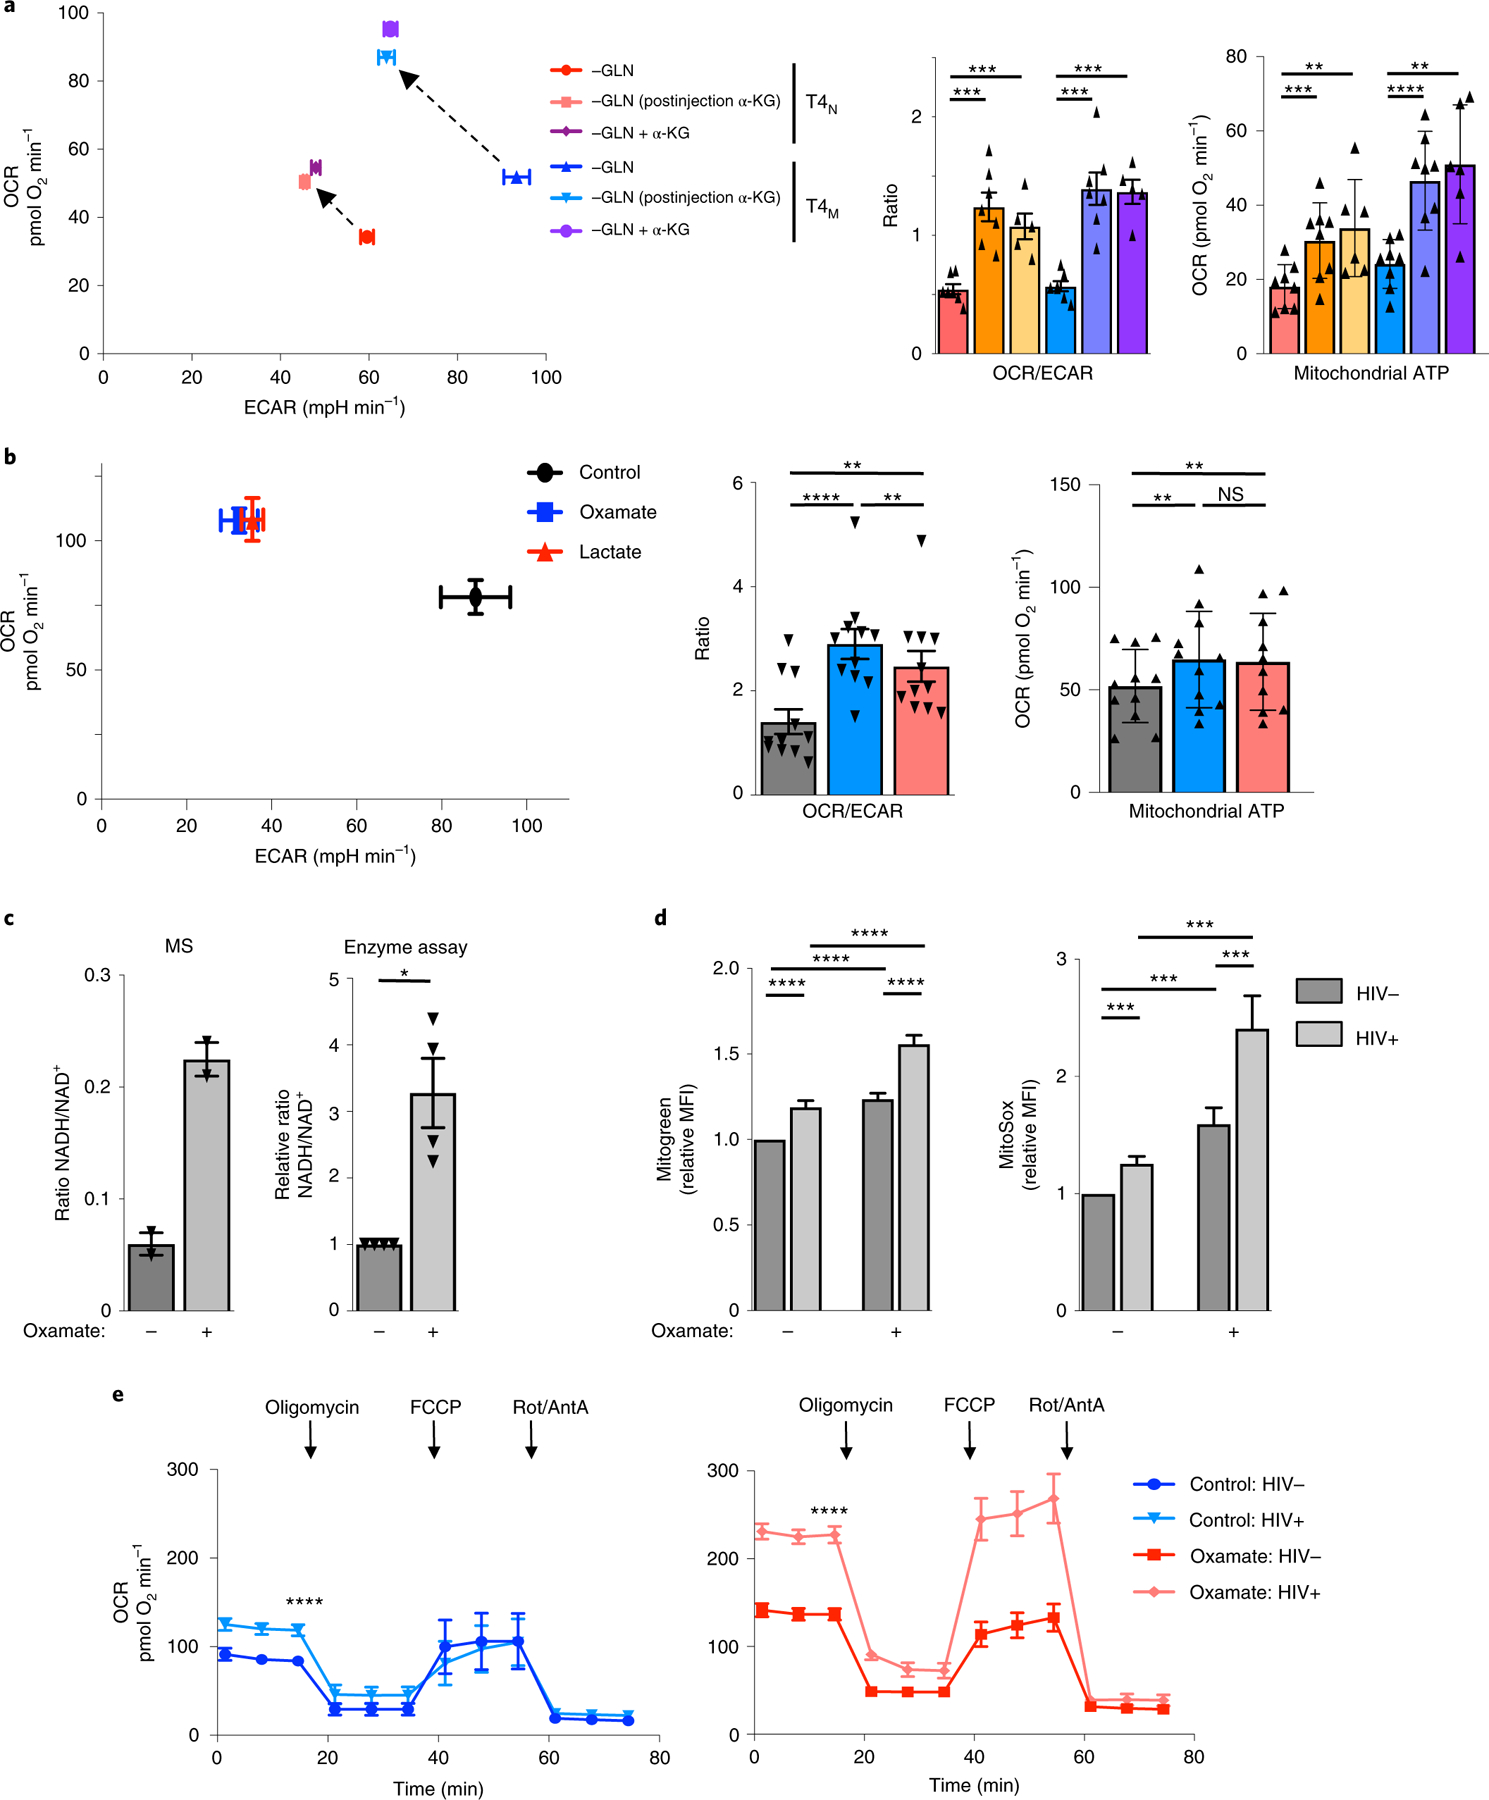
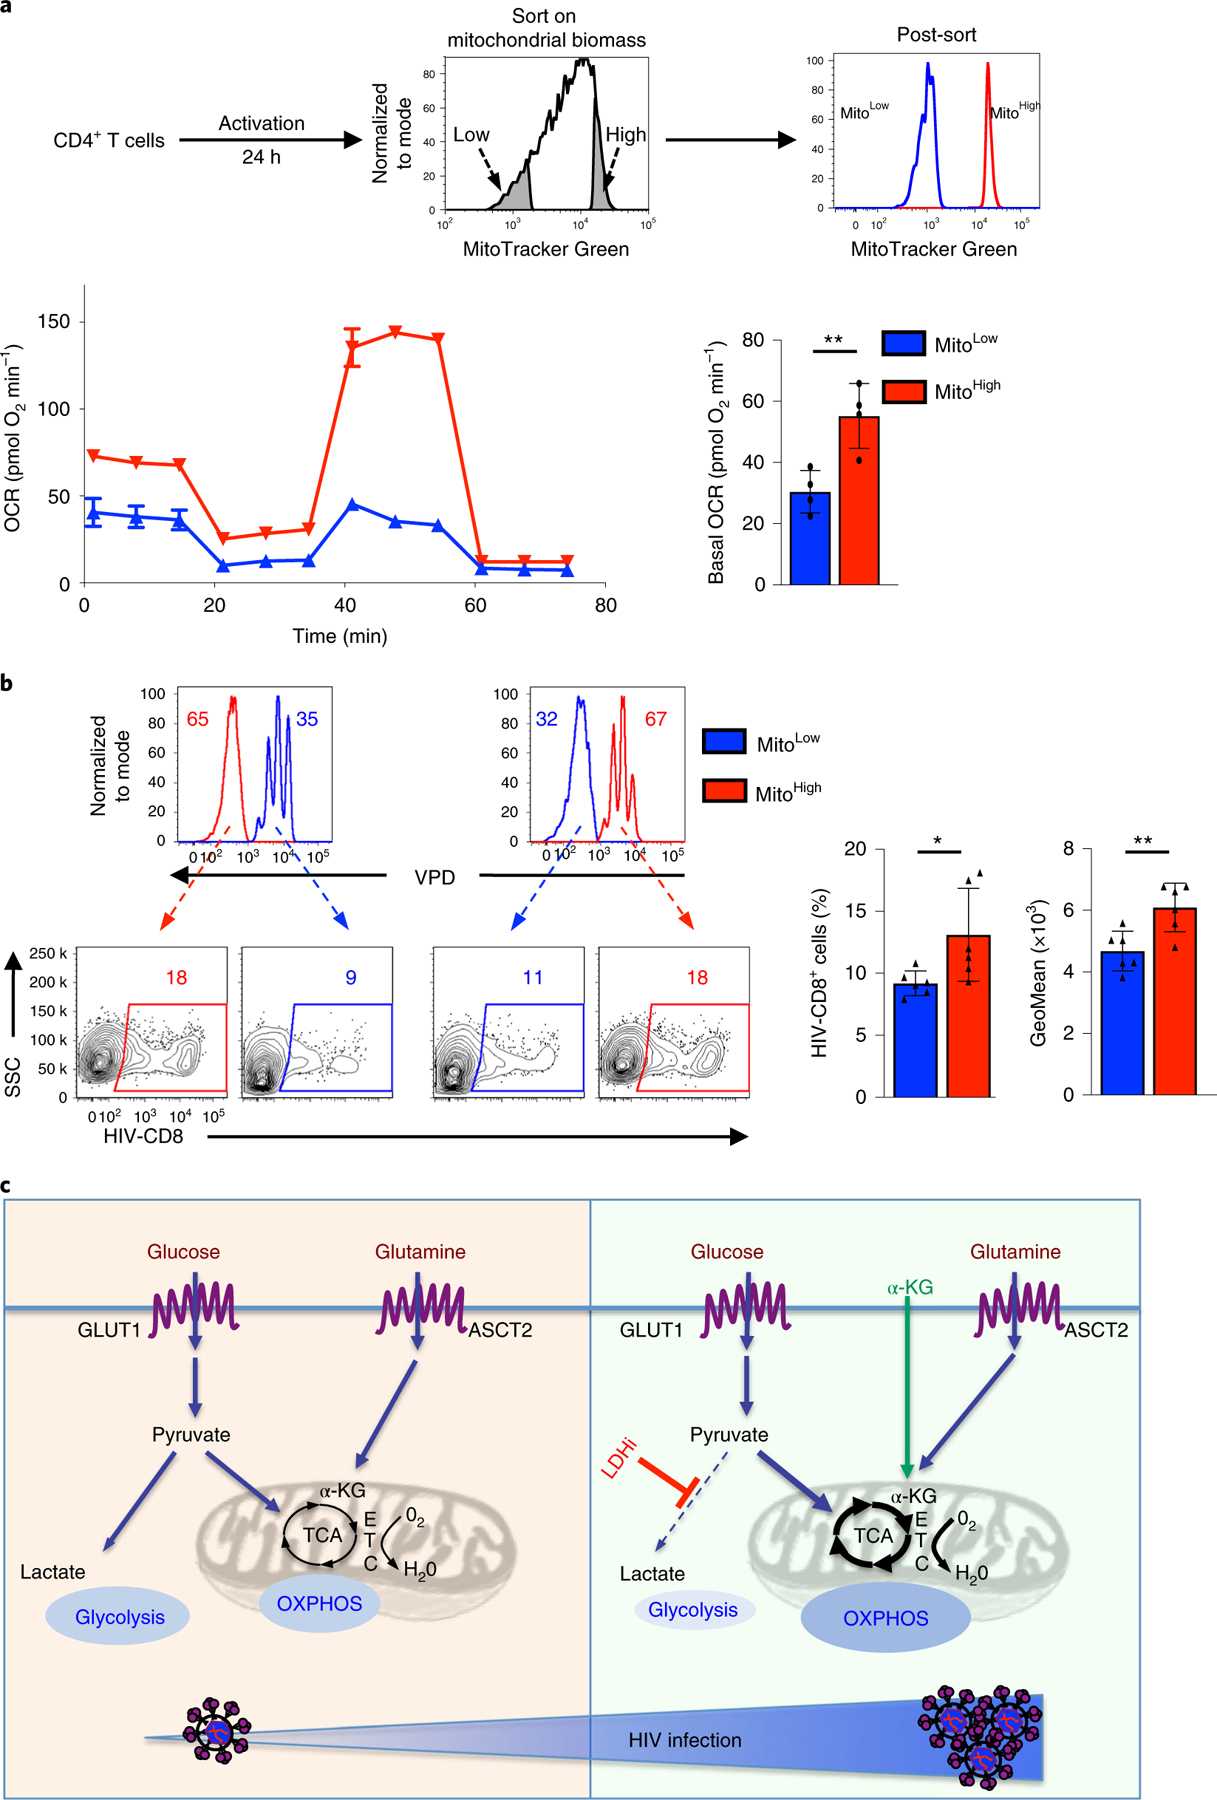
The susceptibility of CD4 T cells to human immunodeficiency virus 1 (HIV-1) infection is regulated by glucose and glutamine metabolism, but the relative contributions of these nutrients to infection are not known. Here we show that glutaminolysis is the major pathway fuelling the tricarboxylic acid (TCA) cycle and oxidative phosphorylation (OXPHOS) in T-cell receptor-stimulated naïve, as well as memory CD4, subsets and is required for optimal HIV-1 infection. Under conditions of attenuated glutaminolysis, the α-ketoglutarate (α-KG) TCA rescues early steps in infection; exogenous α-KG promotes HIV-1 reverse transcription, rendering both naïve and memory cells more sensitive to infection. Blocking the glycolytic flux of pyruvate to lactate results in altered glucose carbon allocation to TCA and pentose phosphate pathway intermediates, an increase in OXPHOS and augmented HIV-1 reverse transcription. Moreover, HIV-1 infection is significantly higher in CD4 T cells selected on the basis of high mitochondrial biomass and OXPHOS activity. Therefore, the OXPHOS/aerobic glycolysis balance is a major regulator of HIV-1 infection in CD4 T lymphocytes.


Conflict of interest statement

Competing interests M.S. and N.T. are inventors on patent WO2010079208. M.S., C.M. and N.T. are inventors on patent WO/2004/096841 and M.S. is an inventor on patent WO/2012/035369. All patents are owned by the CNRS and cover the use of RBD ligands for metabolite transporter detection. N.T. no longer owns any patent rights. M.S. is a co-founder of METAFORA Biosystems.

Figures

Fig. 1 |
Fig. 1 |. TCr stimulation of naïve and memory CD4 T cells results in a rapid induction of glucose and glutamine metabolism that is required for optimal T-cell proliferation and HIV-1 infection.
a, Non-stimulated and αCD3/αCD28-stimulated human CD4 T cells (48 h) were assessed for cell-surface expression of the GLUT1 glucose and ASCT2 glutamine transporters. Control immunofluorescence is shown in grey histograms and specific staining in black line histograms (top). Glucose and glutamine uptakes were assessed by incubation with 2-deoxy-d[1-3H]glucose (2 μCi) or l-[3,4-3H(N)]glutamine (0.5 μCi), respectively, and uptake is expressed as mean counts per minute (cpm) for triplicate samples, error bars indicate s.e.m. (n = 6 replicates from two biologically independent samples). b, OCR and ECAR, measures of OXPHOS and glycolysis, respectively, were monitored following stimulation of naïve and memory CD4 T lymphocytes for 0, 2, 6, 18, 24 and 48 h. Mean levels ± s.e.m. are presented (n = 5 replicates per time point, representative experiment of two biologically independent samples). c, Schematic representation of the replication-incompetent HIV-1 vector harbouring the GFP transgene downstream of the SFFV (spleen focus-forming virus) promoter. LTR, long terminal repeat; SD, splice donor; SA, splice acceptor; ψ, packaging signal; GA-RRE, truncated gag sequence with the rev responsive element; cPPT, central polypurine tract; and LTR-SIN, self-inactivating 3′ LTR (deleted of 400 bp in the U3 region). d, Naïve (T4N) and memory CD4 T cells (T4M) were activated as above and, at 24 h, cells were infected with these HIV-1 virions expressing GFP. Infection was monitored 48 h later as a function of GFP expression. Representative dot plots showing the percentages of infected cells are presented (left) as well as a quantification of the means ± s.e.m. of HIV-GFP+ cells (right; n = 5 biologically independent samples and experiments; two-tailed Student’s t-test; P = 0.001). e, Schematic of the protocol used to evaluate HIV-1 infection following TCR stimulation under nutrient deprivation conditions. f, Following 19 h of TCR stimulation, T4N and T4M were transferred to complete (Nutr+), glucose-deprived (−GLC) or glutamine-deprived (−GLN) media and infection monitored as above. Representative plots (top) and quantification of the mean ± s.e.m. of HIV-GFP+ cells (bottom) are presented (n = 5 biologically independent samples, two-tailed Student’s t-test). *P < 0.05; ***P < 0.001; ****P < 0.0001. All precise P values are presented in Supplementary Table 3.
Fig. 2 |
Fig. 2 |. Exogenous nucleosides promote the proliferation of glutamine-deprived CD4 T cells without enhancing HIV-1 infection.
a, Proliferation of naïve (T4N) and memory CD4 T cells (T4M), activated for 19 h and then transferred into either complete (Nutr+), glucose-deprived (−GLC) or glutamine-deprived (−GLN) media, was monitored as a function of VPD450 dilution. Representative data are presented at day 3 post-TCR stimulation. The percentages of cells having undergone ≥1 division are indicated in each histogram and quantifications of the mean ± s.e.m. (right) are presented (n = 13 biologically independent samples, two-tailed Student’s t-test). b, CD4 T cells were activated with CD3/CD28 monoclonal antibodies and, at 19 h postactivation, they were transferred to the indicated nutrient conditions in the absence (Control) or presence of exogenous nucleosides (+Nside). The percentages of cells that underwent ≥1 division are indicated in each histogram and quantifications are shown on the right (mean ± s.e.m., n = 3 biologically independent samples, two-tailed Student’s t-test, P = 0.3802, P = 0.5681 and P = 0.0062, respectively). c, CD4 T cells, activated as in b, in the presence or absence of nucleosides, were infected with single-round HIV-GFP virions and infection was monitored 48 h later. Representative FACS data are shown (left) and quantification of cells harbouring HIV-GFP ± s.e.m. is presented relative to control conditions (mean ± s.e.m., n = 4 biologically independent samples, two-tailed Student’s t-test). NS, not significant; P > 0.05; **P < 0.01, ****P < 0.0001. Horizontal lines represent means and all precise P values are presented in Supplementary Table 3.
Fig. 3 |
Fig. 3 |. The metabolic state of activated human CD4 T cells is regulated by the relative utilization of extracellular glucose and glutamine.
a, Phosphorylation of the S6 ribosomal protein, an mTOR downstream effector, was monitored in TCR-stimulated T4N and T4M cells by intracellular staining at 48 h poststimulation in control, glucose-deprived (−GLC) or glutamine-deprived (−GLN) conditions. Representative histograms are presented with isotype staining presented in grey and control staining in black (top). The mean percentages of pS6+ cells ± s.e.m. are presented (bottom; n = 8 biologically independent samples; two-tailed Student’s t-test). b, Surface GLUT1 and ASCT2 levels were monitored at 48 h as a function of nutrient conditions and representative histograms of seven individual donors, including mean fluorescence intensity (MFI) are presented (top). The mean MFIs ± s.e.m. are presented (bottom). c, OCR and ECAR were monitored in non-stimulated CD4 T lymphocytes or following TCR stimulation (αCD3/αCD28) in the indicated conditions (n = 5 replicates per condition) (top) on a Seahorse XFe96 analyzer following sequential injection of oligomycin, FCCP and antimycin A (AntA)/rotenone (Rot) (arrows). Mean basal OCR and ECAR levels ± s.e.m. are presented (bottom; n = 5 biologically independent samples for non-stimulated, n = 9 biologically independent samples for Nutr+, n = 8 biologically independent samples for −GLC and −GLN conditions; two-tailed Student’s t-test). d, A plot presenting mean basal OCR and ECAR levels (top) and OCR/ECAR ratios (bottom) ± s.e.m. are presented (n = 5 biologically independent samples for non-stimulated, n = 9 biologically independent samples for Nutr+, n = 8 biologically independent samples for −GLC and −GLN conditions; two-tailed Student’s t-test). P > 0.05; *P < 0.05; **P < 0.01; ***P < 0.001; ****P < 0.0001. All precise P values are presented in Supplementary Table 3.
Fig. 4 |
Fig. 4 |. Inhibiting glycolysis results in increased susceptibility of CD4 T cells to HIV-1 infection.
a, Relative abundance of 13C3-lactate in 48 h TCR-activated CD4 T cells (mean ± s.e.m., n = 6 technical replicates from two biologically independent samples). b, 13C3-lactate and 13C3-pyruvate levels were assessed following TCR stimulation of CD4 T cells under control conditions or following LDH inhibition with the competitive pyruvate analogue oxamate. Total pool size and distribution of isotopologues are presented (mean ± s.e.m., n = 6 technical replicates from two biologically independent samples). c, CD4 T cells were activated in the presence or absence of oxamate or the competitive LDHA inhibitor, GSK2837808. Cells were infected at 24 h with single-round HIV-GFP virions and representative dot plots are shown 48 h later (left panels). Quantification ± s.e.m. of HIV infection in the different conditions is presented (right; n = 4 biologically independent samples, two-tailed Student’s t-test). *P = 0.0347; **P = 0.0067. d, Schematic representation of the effects of the pyruvate analogue oxamate (red) and exogenous lactate (blue circle) on the LDH-mediated forward and reverse conversions between pyruvate and lactate (left). Representative plots (middle plots) and mean levels of HIV-GFP+ cells ± s.e.m. (right histograms) are presented (n = 6 individual donors, one-way ANOVA plus Tukey’s test). e, CD4 T cells were activated in the absence or presence of lactate or oxamate as above. The presence of early (R-U5) and late (LTR-Gag) reverse-transcript viral DNAs, as well as 2-LTR circles, a surrogate of successful nuclear entry, were monitored by qPCR at 6 h and 24 h postinfection. Mean levels ± s.e.m. in each condition relative to β2m DNA are presented (technical triplicates of three biologically independent samples; two-tailed Student’s t-test). P > 0.05; *P < 0.05; **P < 0.01; ***P < 0.001. All precise P values are provided in Supplementary Table 3.
Fig. 5 |
Fig. 5 |. under conditions of glutamine deprivation, α-ketoglutarate rescues early steps in HIV-1 infection.
a, CD4 T cells were activated in glucose-deprived or glutamine-deprived conditions in the absence or presence of oligomycin or antimycin A (1 μM). Cells were infected with HIV-1-GFP virions and reporter expression was monitored 48 h later. Representative dot plots are shown (left panels) and mean percentages ± s.e.m. are presented (right; n = 4 biologically independent samples for no drug and antimycin A conditions and n = 3 biologically independent samples for oligomycin condition; two-tailed Student’s t-test, ***P = 0.0008, **P = 0.0089, NS P = 0.5807 and P = 0.3965, respectively). b, The distribution of α-KG isotopologues from 13C-glucose and 13C-glutamine to α-KG are shown (mean ± s.e.m.; n = 6 technical replicates from two biologically independent samples). c, T4N and T4M lymphocytes were activated in glutamine-deprived conditions in the absence or presence of α-KG (dimethyl α-KG), as indicated, and infected at 24 h with single-round HIV-GFP virions. Representative dot plots are shown 48 h later (left panels). Quantification ± s.e.m. of HIV infection in the different conditions is presented (right; n = 5 biologically independent samples, two-tailed Student’s t-test, **P = 0.0059 for T4N and *P = 0.0135 for T4M). d, CD4 T cells were activated in complete (Nutr+), glucose-deprived (−GLC) or glutamine-deprived (−GLN) media in the absence or presence of α-KG, as indicated. The presence of early (R-U5) and late (LTR-Gag) reverse-transcript viral DNAs, as well as 2-LTR circles (LTRc), a surrogate of successful nuclear entry, was monitored by qPCR at 6 h and 24 h postinfection. Mean levels ± s.e.m. in each condition relative to β2m DNA are presented (means of technical triplicates from six biologically independent samples; two-tailed Student’s t-test). NS P > 0.05; *P < 0.05; **P < 0.01. All precise P values are presented in Supplementary Table 3.
Fig. 6 |
Fig. 6 |. Enhanced respiratory capacity is associated with increased levels of HIV-1 infection.
a, OCR and ECAR levels were assessed in TCR-stimulated glutamine-deprived T4N and T4M lymphocytes (48 h) in the absence or presence of α-KG and immediately following injection of α-KG (dimethyl α-KG) into the XFe96 flux analyser (dashed arrows; left). Quantification ± s.e.m. of OCR/ECAR ratios and mitochondrial ATP production in the indicated conditions are presented (right; n = 7 biologically independent samples for all conditions except for ‘−GLN+ α-KG’ where n = 5 biologically independent samples were used; two-tailed Student’s t-test; ***P = 0.0003, P = 0.0010, P = 0.0002, P = 0.0002). b, Mean OCR and ECAR levels in CD4 T cells, activated in the presence or absence of oxamate or lactate (48 h), are presented with measure of centre reflecting the mean levels of both OCR and ECAR ± s.e.m. of each parameter (left). Mean OCR/ECAR ratios as well as mitochondrial ATP production ± s.e.m. are shown (n = 11 biologically independent samples; two-tailed Student’s t-test; **P = 0.0014 for control versus lactate, P = 0.0073 for oxamate versus lactate, ****P < 0.0001). c, The ratio of NADH/NAD+ was assessed in T cells activated in the absence or presence of LDH inhibition by mass spectrometry (MS; left panel), assessing only the light isotopologues (M+0, mean ± s.e.m., n = 6 technical replicates in two biologically independent samples), and by an enzymatic assay (right panel, mean ± s.e.m., n = 4 biologically independent samples, two-tailed Student’s t-test; *P = 0.0222). d, Mitochondrial biomass and mitochondrial ROS were evaluated by MitoGreen and MitoSox staining, respectively. Relative MFIs (mean ± s.e.m., defined as the ratio of the MFI in each independent sample relative to the control condition in the absence of oxamate) in HIV− and HIV+ CD4 T-cell subsets are presented (n = 18 biologically independent samples for MitoGreen and n = 15 biologically independent samples for MitoSox; two-tailed Student’s t-test; ***P < 0.001; ****P < 0.0001). e, CD4 T cells, activated in the absence or presence of oxamate, were infected with single-round HIV-1 virions harbouring a truncated CD8 molecule. At 48 h later, infected cells were sorted on the basis of CD8 expression and OCR was then monitored in HIV− and HIV+ subsets as indicated. Representative data are shown and mean levels ± s.e.m. are presented (n = 5 biologically independent samples, two-tailed Student’s t-test, ****P < 0.0001). All precise P values are presented in Supplementary Table 3.
Fig. 7 |
Fig. 7 |. Mitochondrial biomass regulates the susceptibility of CD4 T cells to HIV-1 infection.
a, CD4 T cells were activated for 24 h and sorted by MitoTracker Green staining. The 10% of cells with the lowest (blue histogram) and highest (red histogram) mitochondrial biomass were sorted as shown and representative histograms showing the sorted populations are shown. Mitochondrial function on the sorted CD4 T cells was assessed by monitoring OCR (mean ± s.e.m.; n = 3 biologically independent samples per condition; left bottom). Basal OCR was quantified and measure of centre reflects means levels ± s.e.m. are presented (n = 4 biologically independent samples, two-tailed Student’s t-test; **P = 0.0015; right bottom). b, To assess the relative infection of CD4 T cells with high (MitoHigh) and low (MitoLow) mitochondrial biomass, sorted populations were distinguished by VPD staining and mixed prior to infection. MitoLow CD4 T cells were VPD-stained and mixed with unstained MitoHigh T cells (left) or MitoHigh CD4 T cells were VDP-stained and mixed with unstained MitoLow T cells (right). Mixed cells were exposed to single-round HIV-1 virions harbouring a truncated CD8 molecule for 2 h (immediately following sorting) and then washed to remove free virions. The percentages of VPD− and VPD+ cells were evaluated by flow cytometry (48 h) and representative histograms are presented (top). HIV-1 infection was evaluated on the basis of CD8 expression and percentage infection is shown (bottom left). Quantification of HIV-1-infected MitoLow and MitoHigh cells ± s.e.m. are presented (middle) as well as the geometric mean ± s.e.m. of transgene staining in infected cells (n = 6 technical replicates from three biologically independent samples, two-tailed Student’s t-test). *P = 0.0450; **P = 0.0016 All precise P values are presented in Supplementary Table 3. c, Schematic of HIV-1 infection following TCR stimulation. Induction of GLUT1 and ASCT2 transporters following TCR stimulation results in increased aerobic glycolysis and oxidative phosphorylation (OXPHOS), respectively (left). Under conditions where glucose is shunted into the TCA cycle by LDH inhibition (LDHi) or exogenous α-KG directly feeds the TCA cycle, there is an increased fuelling of the electron transport chain (ETC) and an increased OXPHOS (right). This metabolic reprogramming, with an augmented OXPHOS/aerobic glycolysis ratio, is associated with an enhanced level of HIV-1 infection (bottom).

References

    1. Zack JA, Kim SG & Vatakis DN HIV restriction in quiescent CD4+ T cells. Retrovirology 10, 37 (2013). - PMC - PubMed
    1. Rathmell JC, Elstrom RL, Cinalli RM & Thompson CB Activated Akt promotes increased resting T cell size, CD28-independent T cell growth, and development of autoimmunity and lymphoma. Eur. J. Immunol 33, 2223–2232 (2003). - PubMed
    1. Frauwirth KA et al. The CD28 signaling pathway regulates glucose metabolism. Immunity 16, 769–777 (2002). - PubMed
    1. Manel N et al. The HTLV receptor is an early T-cell activation marker whose expression requires de novo protein synthesis. Blood 101, 1913–1918 (2003). - PubMed
    1. Curi R et al. Glutamine, gene expression, and cell function. Front. Biosci 12, 344–357 (2007). - PubMed

Publication types