. 2020 May 29;40(5):BSR20190629.
doi: 10.1042/BSR20190629.

Genetic and expression variations of cell cycle pathway genes in brain tumor patients

Affiliations

Genetic and expression variations of cell cycle pathway genes in brain tumor patients

Anum Zehra Naqvi et al. Biosci Rep. .

Abstract

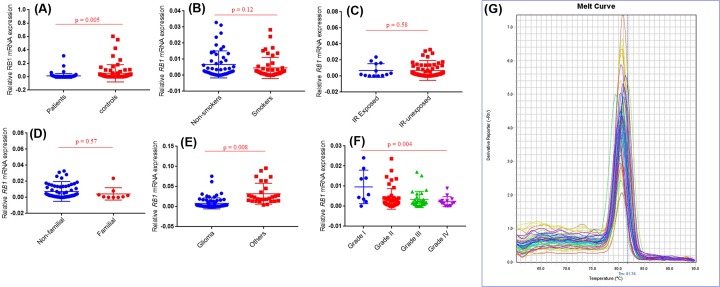
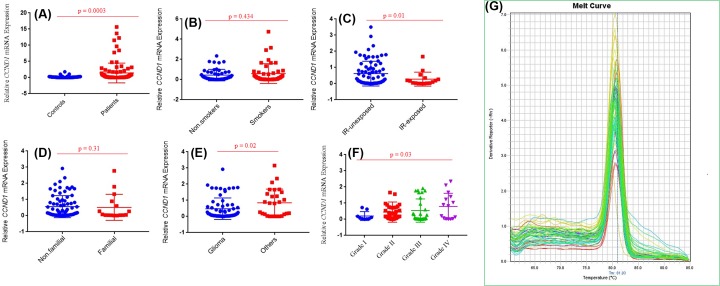
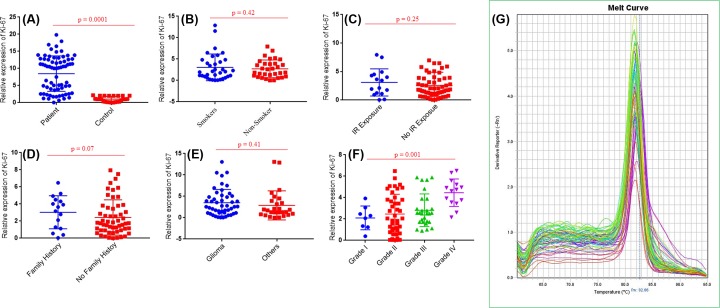
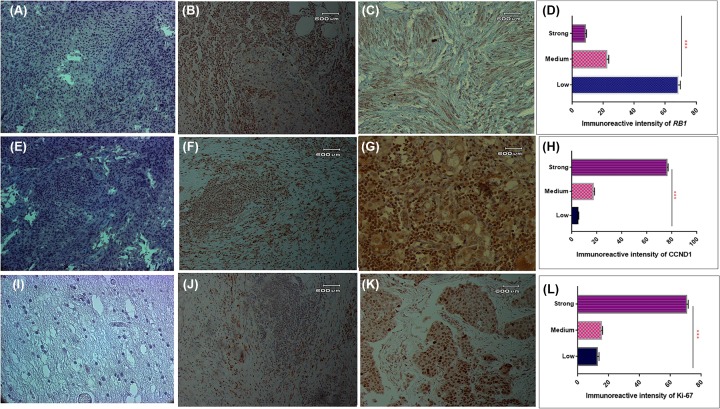
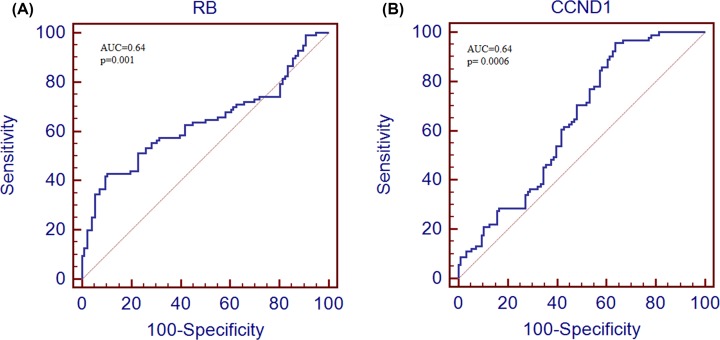
The present study was designed to determine the association between the genetic polymorphisms/expression variations of RB1 and CCND1 genes and brain tumor risk. For this purpose, 250 blood samples of brain tumor patients along with 250 controls (cohort I) and 96 brain tumor tissues (cohort II) with adjacent control section were collected. Mutation analysis of RB1 (rs137853294, rs121913300) and CCND1 (rs614367, rs498136) genes was performed using ARMS-PCR followed by sequencing, and expression analysis was performed using real-time PCR and immunohistochemistry. The results showed homozygous mutant genotype of RB1 gene polymorphism, rs121913300 (P=0.003) and CCND1 gene polymorphism rs614367 (P=0.01) were associated significantly with brain tumor risk. Moreover, significant down-regulation of RB1 (P=0.005) and up-regulation of CCND1 (P=0.0001) gene was observed in brain tumor sections vs controls. Spearman correlation showed significant negative correlation between RB1 vs proliferation marker, Ki-67 (r = -0.291*, P<0.05) in brain tumors. Expression levels of selected genes were also assessed at protein level using immunohistochemical analysis (IHC) and signification down-regulation of RB1 (P=0.0001) and up-regulation of CCND1 (P=0.0001) was observed in brain tumor compared with control sections. In conclusion, it is suggested that polymorphisms/expression variations of RB1 and CCND1 genes may be associated with increased risk of brain tumor.

Keywords: Brain tumor; CCND1; Expression analysis; Polymorphism; RB1.


Conflict of interest statement

The authors declare that there are no competing interests associated with the manuscript.

Figures

Figure 1
Figure 1. LD plot for RB1 and CCND1 polymorphism
(A) Control sample; (B) tumor patient samples. Site1 for rs137853294; Site2 for rs121913300; Site3 for rs614367; Site4; rs498136; darker region shows higher r2-value.
Figure 2
Figure 2. Protein and mRNA secondary structure prediction of RB1 exonic SNPs
(A) Super-imposed structure of normal and mutated RB1 proteins (blue, wild; white, SNP1 mutated); purple, SNP2 truncated). (B) mRNA secondary structure of normal RB1 gene. (C) mRNA secondary structure of SNP1 rs137853294 polymorphism. (D) mRNA secondary structure of SNP2 rs121913300 polymorphism.
Figure 3
Figure 3. Expression profiling of RB1 gene in study cohort
mRNA expression of (A) RB1 in brain tumor samples and normal control samples. (B) RB1 in brain tumor samples with smoking status. (C) RB1 in brain tumor samples with IR. (D) RB1 in tumor samples with family history. (E) RB1 in different types of brain tumor. (F) RB1 in brain tumor samples with different grades. Among these grades, grade I included meningiomas (9), grade II included diffuse astrocytoma (7), choroid glioma (12), oligodandroglioma (5), eppendoma (7), atypical meningioma (8) and pituitary adenoma (4). Grade III inculded anaplastic astrocytoma (19), anaplastic oligodandroglioma (3), anaplastic meningioma (4) and pituitary adenoma (3). Grade IV included GBM (11) and diffuse medine glioma (4). (G) Melt curve analysis of RB1 gene.
Figure 4
Figure 4. Expression profiling of CCND1 gene in study cohort
mRNA expression of (A) CCND1 in brain tumor samples and normal control samples, (B) CCND1 in brain tumor samples with smoking status, (C) CCND1 in brain tumor samples with IR, (D) CCND1 in tumor samples with family history, (E) CCND1 in different types of brain tumor, (F) CCND1 in brain tumor samples with different grades. Among these grades, grade I included meningiomas (9), grade II included diffuse astrocytoma (7), choroid glioma (12), oligodandroglioma (5), eppendoma (7), atypical meningioma (8) and pituitary adenoma (4). Grade III inculded anaplastic astrocytoma (19), anaplastic oligodandroglioma (3), anaplastic meningioma (4) and pituitary adenoma (3). Grade IV included GBM (11) and diffuse medine glioma (4). (G) melt curve analysis of CCND1 gene.
Figure 5
Figure 5. Expression profiling of Ki-67 gene in study cohort
mRNA expression of (A) Ki-67 in brain tumor samples and normal control samples, (B) Ki-67 in brain tumor samples with smoking status (C) Ki-67 in brain tumor samples with IR. (D) Ki-67 in tumor samples with family history, (E) Ki-67 in different types of brain tumor, (F) Ki-67 in brain tumor samples with different grades. Among these grades, grade I included meningiomas (9), grade II included diffuse astrocytoma (7), choroid glioma (12), oligodandroglioma (5), eppendoma (7), atypical meningioma (8) and pituitary adenoma (4). Grade III inculded anaplastic astrocytoma (19), anaplastic oligodandroglioma (3), anaplastic meningioma (4) and pituitary adenoma (3). Grade IV included GBM (11) and diffuse medine glioma (4). (G) Melt curve analysis of Ki-67 gene.
Figure 6
Figure 6. Immunohistochemical analysis of cell cycle pathway genes in study cohort
Protein expression of RB1 gene (A), negative control (B), adjacent control section (C) brain tumor. Immunoreactive intesity of RB1 gene in brain tumor sections (D). Protein expression of CCND1 gene (E), negative control (F), adjacent control section (G) brain tumor. Immunoreactive intesity of CCND1 gene in brain tumor sections (H). Protein expression of Ki-67 gene (I), negative control (J), adjacent control section (K) brain tumor. Immunoreactive intesity of Ki-67 gene in brain tumor sections (L).
Figure 7
Figure 7. ROC curve analysis of cell cycle pathway genes in study cohort
ROC curve anlysis of RB1 gene (A) and CCND1 (B) in brain tumor patients.

References

    1. Louis D.N., Perry A., Reifenberger G., Von Deimling A., Figarella-Branger D., Cavenee W.K. et al. (2016) The 2016 World Health Organization classification of tumors of the central nervous system: a summary. Acta Neuropathol. (Berl.) 131, 803–820 10.1007/s00401-016-1545-1 - DOI - PubMed
    1. Gladson C.L., Prayson R.A. and Liu W.M. (2010) The pathobiology of glioma tumors. Annu. Rev. Pathol. Mech. Dis. 5, 33–50 10.1146/annurev-pathol-121808-102109 - DOI - PMC - PubMed
    1. Louis D.N., Ohgaki H., Wiestler O.D., Cavenee W.K., Burger P.C., Jouvet A. et al. (2007) The 2007 WHO classification of tumours of the central nervous system. Acta Neuropathol. 114, 97–109 10.1007/s00401-007-0243-4 - DOI - PMC - PubMed
    1. Ohgaki H., Dessen P., Jourde B., Horstmann S., Nishikawa T., Di Patre P.L. et al. (2004) Genetic pathways to glioblastoma: a population-based study. Cancer Res. 64, 6892–6899 10.1158/0008-5472.CAN-04-1337 - DOI - PubMed
    1. Ohgaki H. and Kleihues P. (2005) Epidemiology and etiology of gliomas. Acta Neuropathol. (Berl) 109, 93–108 10.1007/s00401-005-0991-y - DOI - PubMed

MeSH terms