. 2020 Aug 15;41(12):3468-3535.
doi: 10.1002/hbm.25013. Epub 2020 May 6.

Towards a brain-based predictome of mental illness

Affiliations

Towards a brain-based predictome of mental illness

Barnaly Rashid et al. Hum Brain Mapp. .

Abstract

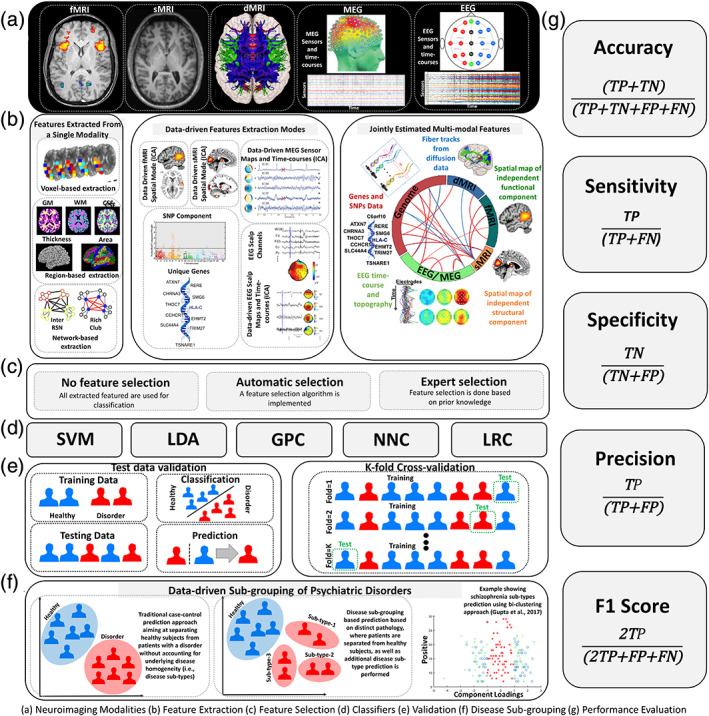
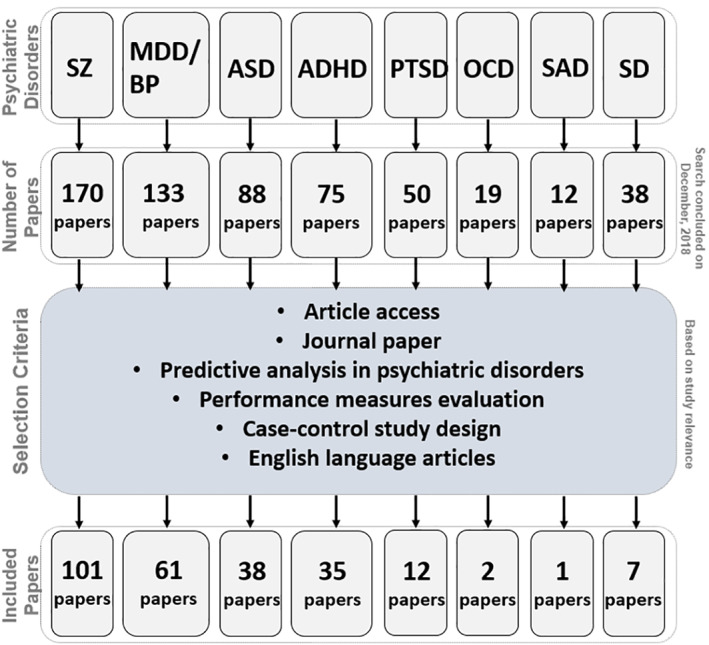
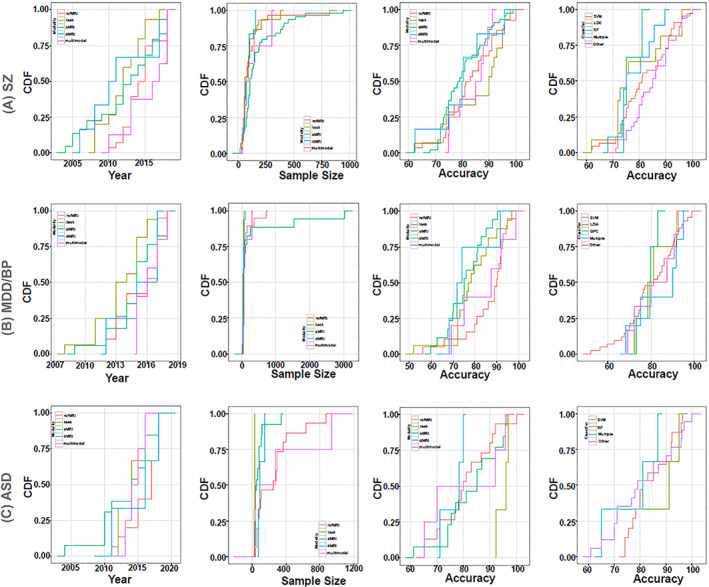
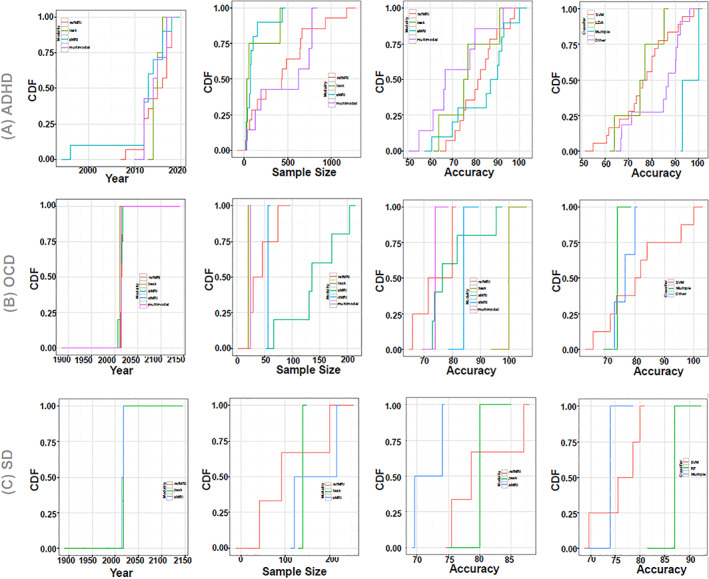
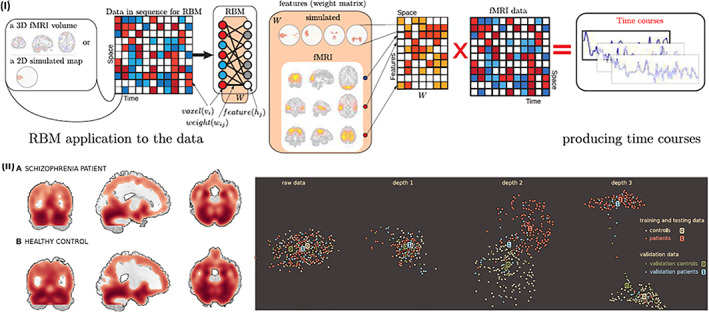
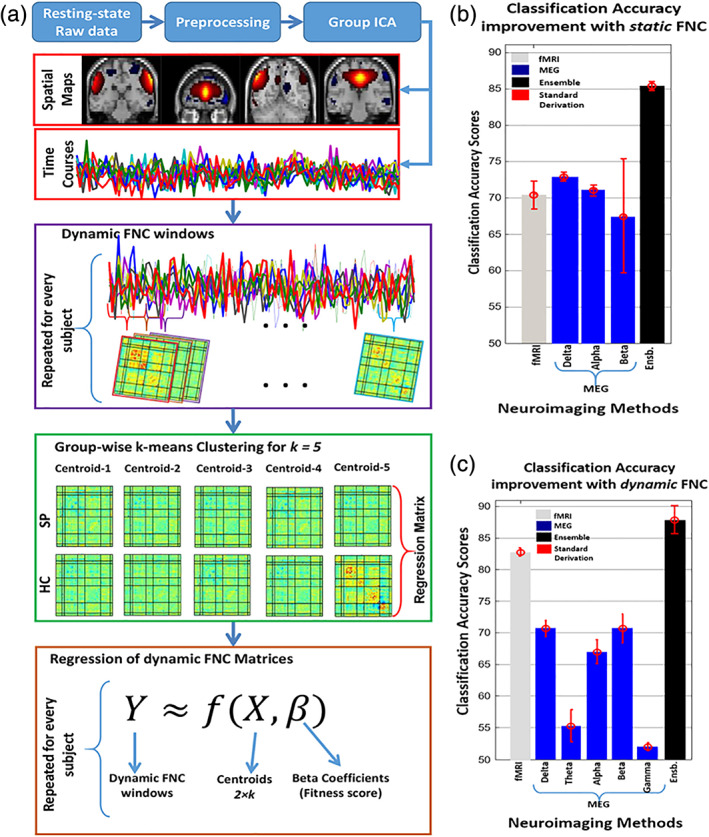
Neuroimaging-based approaches have been extensively applied to study mental illness in recent years and have deepened our understanding of both cognitively healthy and disordered brain structure and function. Recent advancements in machine learning techniques have shown promising outcomes for individualized prediction and characterization of patients with psychiatric disorders. Studies have utilized features from a variety of neuroimaging modalities, including structural, functional, and diffusion magnetic resonance imaging data, as well as jointly estimated features from multiple modalities, to assess patients with heterogeneous mental disorders, such as schizophrenia and autism. We use the term "predictome" to describe the use of multivariate brain network features from one or more neuroimaging modalities to predict mental illness. In the predictome, multiple brain network-based features (either from the same modality or multiple modalities) are incorporated into a predictive model to jointly estimate features that are unique to a disorder and predict subjects accordingly. To date, more than 650 studies have been published on subject-level prediction focusing on psychiatric disorders. We have surveyed about 250 studies including schizophrenia, major depression, bipolar disorder, autism spectrum disorder, attention-deficit hyperactivity disorder, obsessive-compulsive disorder, social anxiety disorder, posttraumatic stress disorder, and substance dependence. In this review, we present a comprehensive review of recent neuroimaging-based predictomic approaches, current trends, and common shortcomings and share our vision for future directions.

Keywords: functional magnetic resonance imaging; machine learning; multimodal studies; neuroimaging; psychiatric disorder.


Conflict of interest statement

The authors declare no conflict of interest related to this work.

Figures

FIGURE 1
FIGURE 1
Predictome pipeline. An overview of neuroimaging‐based predictome pipeline. (a) Neuroimaging modalities typically used for mental illness prediction. (b) Current approaches for feature selection. Feature extraction can include (i) voxel‐based (ii) network‐based, (iii) data‐driven approaches (e.g., independent component analysis, ICA), or (iv) jointly estimated features from multiple modalities (e.g., fMRI and genomics). (c) Types of feature selections can include automatic or expert selection approaches. (d) Choice of classifiers may include support vector machine (SVM), linear discriminant analysis (LDA), Gaussian process classifier (GPC), neural network classifier (NNC) or logistic regression classifier (LRC). (e) Model validation can be performed using either a test‐validation setup or using a k‐fold cross‐validation scheme. (f) Data‐driven subtype identification can also be performed for homogeneous disorders (Gupta et al., 2017; Marquand, Rezek, Buitelaar, & Beckmann, 2016). (g) Various measures for performance evaluation such as accuracy, sensitivity, specificity, precision and F1‐score. FN, false negative; FP, false positive; TN, true negative; TP, true positive
FIGURE 2
FIGURE 2
The systematic literature review procedure, the inclusion criteria and the number of surveyed studies for each modality. ADHD, attention‐deficit/hyperactivity disorder; ASD, autism spectrum disorder; MDD/BP, major depression disorder/bipolar disorder; OCD, obsessive–compulsive disorder; PTSD, posttraumatic stress disorder; SAD, social anxiety disorder; SD, substance dependence; SZ, schizophrenia
FIGURE 3
FIGURE 3
Visual summary of the surveyed mental illness prediction studies. (a) The number of studies published in each year for each modality. (b) The number of studies published in each year for each disorder type. (c) The number of studies published in each year for each disorder type and each modality. (d) The overall prediction accuracy against the commonly used classifiers in each disorder type. (e) The overall prediction accuracy against each modality and each disorder type. (f) The total sample size against each disorder type for each modality
FIGURE 4
FIGURE 4
Visual summary of the surveyed mental illness prediction studies. (a) The overall accuracy against the total sample size for each disorder and for each classifier used in the studies. (b) The overall accuracy against the total sample size for each modality and for each classifier used in the studies. (c) The overall accuracy against the total sample size for each disorder and each modality used in the studies. (d) The sample size distribution for number of studies in the survey. (e) The overall accuracy against each modality for each disorder and for each classifier used in the studies
FIGURE 5
FIGURE 5
Disorder‐specific cumulative density function (CDF) of the surveyed mental illness prediction studies. Summary results are shown for (a) schizophrenia (SZ), (b) major depression disorder/ bipolar disorder (MDD/BP), (c) autism spectrum disorder (ASD). For each of the disorders, CDFs for publication year per modality, sample size per modality, accuracy per modality, and accuracy per classifier are presented
FIGURE 6
FIGURE 6
Disorder‐specific cumulative density function (CDF) of the surveyed mental illness prediction studies. Summary results are shown for (a) attention‐deficit/hyperactivity disorder (ADHD), (b) obsessive–compulsive disorder (OCD), and (c) substance dependence (SD). Summary for posttraumatic stress disorder (PTSD) and social anxiety disorder (SAD) were excluded due to very few publication number. For each of the disorders, CDFs for publication year per modality, sample size per modality, accuracy per modality, and accuracy per classifier are presented
FIGURE 7
FIGURE 7
A deep‐learning approach for schizophrenia prediction. (I) Methodological illustration of restricted Boltzmann machine (RBM) based deep learning pipeline. Features were learned from the time‐courses of the data. (II) Example showing a smoothed gray matter segmentation of a training sample of a schizophrenia patient and a healthy control (left), and the effect of a deep belief network's (DBN) depth on neighborhood relations (right). Results showing that after Depth 1 and Depth 2, the DBN continues distilling details that pull the classes further apart. Figures reprinted with permission from Plis et al. (2014)
FIGURE 8
FIGURE 8
Schematic description showing the multimodal, MEG‐fMRI classification framework. (a) Both resting‐state fMRI and MEG data went through group ICA, windowed‐FNC and k‐means clustering approach. Regression analyses were performed on dynamic FNC measures to extract features. (b) Bar plots showing average classification accuracy improvement with static FNC approach. (c) Bar plots showing average classification accuracy improvement with dynamic FNC approach. Dynamic approach clearly outperformed static FNC approach. Figures reused with permission from Cetin et al. (2016)
FIGURE 9
FIGURE 9
Prediction of schizophrenia (SZ) and bipolar disorder (BP) using temporal lobe and default mode components. (a) Group‐wise average temporal lobe and (b) default mode features, extracted from fMRI data from healthy control (HC), SZ, and BP patients. Components are thresholded at p < .001 (corrected). (c) Classification results illustrated with a priori decision regions, and actual diagnosis of test subjects. The average sensitivity and specificity were 90 and 95%, respectively. Figures modified and reprinted with permission from Calhoun et al. (2008)
FIGURE 10
FIGURE 10
Classification approach using static and dynamic FNC measures. (a) Windowed FNC and k‐means clustering methods were used to extract dynamic FNC features from schizophrenia (SZ), bipolar (BP) and healthy control (HC). (b) Classification results showing that dynamic FNC approach outperformed static FNC framework (accuracy: 84% versus 59%, respectively). (c) Another FNC‐based approach showing dynamic FNC approach clearly outperforms static FNC approach (Saha et al., 2019, ISBI). Multiple dynamic states (k = 2–10) were utilized to evaluate classification performance. (d) Further, using subsets of states and flat and Brute Force (BF) approaches, performance was evaluated, showing improvement in accuracy with subsets of states (Saha et al., 2019, ohbm). Figures modified and reprinted with permission from Rashid et al. (2016), Saha, Abrol, et al. (2019), and Saha, Damaraju, et al. (2019)
FIGURE 11
FIGURE 11
A joint estimation approach for schizophrenia prediction using parallel group ICA + ICA. Flowchart showing steps to extract first‐level fMRI (a) and sMRI (b) features, feature integration using parallel GICA+ICA (c), group‐level components extraction from GICA (d), subject‐level GICA components extraction (e), group‐level GICA components extraction (f), FNC analysis. Figures reprinted with permission from Qi et al. (2019)
FIGURE 12
FIGURE 12
Predicting cognition. An approach to predict cognition with constrained data fusion. Comparison of composite cognition associated with multimodal covarying patterns between multiple cohorts. The composite cognitive scores were used as references for multisite data cohorts. Figures reprinted with permission from Sui et al. (2018)
FIGURE 13
FIGURE 13
An approach to classify schizophrenia (SZ) using resting‐state functional network connectivity (FNC) measures. (a) Feature extraction and classification steps of the FNC‐based framework. (b) group‐wise mean FNC (left), and T values (FDR corrected, p < .05) (right). (c) Group difference in mean FNC measures (left), and FDR corrected (p < .05) T values showing group difference. Figures reprinted with permission from Arbabshirani et al. (2013)
FIGURE 14
FIGURE 14
An example showing prediction of schizophrenia and bipolar using network measures and hierarchical clustering. (a) Distance matrix from the feature vectors. (b) The mean inter‐group and intra‐group distance matrix. (c) The Results from t‐distributed stochastic neighbor embedding (t‐SNE) method showing the projection results of subjects, where each point refers to a subject (group‐wise colored). (d) The linkage results from the hierarchical clustering method. BP, bipolar; HC, healthy control; SADD: schizoaffective (depression); SADM, schizoaffective (manic); SZ, schizophrenia. Figure reprinted with permission from Du et al. (2015)
FIGURE 15
FIGURE 15
Illustration of the neuromark approach. The neuromark approach aims at linking neuromarkers among different diseases and separate studies. (a) The fully automated Group ICA components were found to be very stable which can be performed for individual subjects. (b) Strong correlation (>0.95) between functional network connectivity (FNC) was obtained across data from multiple sites, with consistent group difference between schizophrenia (SZ) and healthy cohorts. Figures reprinted with permission from Y. Du et al. (2019) and Lin et al. (2018)
FIGURE 16
FIGURE 16
An approach for schizophrenia (SZ) prediction using multi‐component and symptom biclustering. (a) Block diagram of the general framework. (b) Discriminative components whose loading parameters were used as features. (c) F1 similarity index between estimated and ground truth biclusters, where a higher value indicates more similarity (better estimation). Red dotted line indicates method outperformed other methods. (d) Correlations between the symptom scores and biclusters. Colors represents different symptom scores; tall spikes indicate significant correlations. (e) Mean and standard deviation of symptom scores across biclusters. The dots represent the subject‐wise symptom score. Magenta: positive scores; black: negative scores; blue: general scores. Figures reprinted with permission from Rahaman, Turner, et al. (2019)
FIGURE 17
FIGURE 17
An imaging‐genomics framework to jointly estimate group differences in schizophrenia (SZ) and healthy controls (HC). The parallel ICA based multimodal framework incorporating imaging (dynamic FNC measures) and genomic (single nucleotide polymorphism, SNP) data. Figures reprinted with permission from Rashid et al. (2019)

References

    1. Abraham, A. , Milham, M. P. , Di Martino, A. , Craddock, R. C. , Samaras, D. , Thirion, B. , & Varoquaux, G. (2017). Deriving reproducible biomarkers from multi‐site resting‐state data: An autism‐based example. NeuroImage, 147, 736–745. - PubMed
    1. Abrol, A. , Rashid, B. , Rachakonda, S. , Damaraju, E. , & Calhoun, V. D. (2017). Schizophrenia shows disrupted links between brain volume and dynamic functional connectivity. Frontiers in Neuroscience, 11, 624. - PMC - PubMed
    1. Ad‐Dab'bagh, Y. , Lyttelton, O. , Muehlboeck, J. , Lepage, C. , Einarson, D. , Mok, K. , … Fombonne, E. (2006). The CIVET image‐processing environment: a fully automated comprehensive pipeline for anatomical neuroimaging research. Paper presented at the Proceedings of the 12th annual meeting of the organization for human brain mapping.
    1. Akshoomoff, N. , Lord, C. , Lincoln, A. J. , Courchesne, R. Y. , Carper, R. A. , Townsend, J. , & Courchesne, E. (2004). Outcome classification of preschool children with autism spectrum disorders using MRI brain measures. Journal of the American Academy of Child & Adolescent Psychiatry, 43(3), 349–357. - PubMed
    1. Alain, G. , & Bengio, Y. (2016). Understanding intermediate layers using linear classifier probes. arXiv preprint arXiv:1610.01644.

Publication types